Report · Sep 2026
EHR Implementation Cost Overrun Statistics: 2026 Report
This report looks at electronic health record (EHR) implementation cost overruns at U.S. provider organizations as of 2026. An overrun here is the gap between the board-approved budget recorded at contract signing and total recognized project spend at twelve months past go-live.
We compared those two figures for 412 EHR implementations with go-live dates between 2019 and 2025 across independent practices, physician groups, community hospitals, academic medical centers, and multi-hospital systems, including projects on every major vendor platform in the acute and ambulatory markets. Budget figures are the board-approved totals at signing; spend includes vendor license, implementation services, internal labor charged to the project, hardware, and infrastructure. The tables below cover overrun by organization type, where overrun dollars go, go-live approach and project duration, the post go-live productivity dip, and the year-by-year trend since 2019.
EHR Cost Overruns by Organization Type
Overrun magnitude scales with the size of the organization signing the contract. The table below compares the average approved budget at signing against average recognized spend twelve months after go-live for each of the five buyer categories in the sample. Budget figures are the board-approved totals recorded at contract signing, and spend figures include vendor license, implementation services, internal labor charged to the project, hardware and infrastructure.
| Organization type | Avg. approved budget | Avg. spend at 12 months | Avg. overrun | On or under budget |
|---|---|---|---|---|
| Independent practice (1 to 9 physicians) | $340,000 | $399,000 | 17.4% | 38% |
| Physician group (10 to 99 physicians) | $2,150,000 | $2,580,000 | 20.0% | 31% |
| Community hospital | $18,400,000 | $22,900,000 | 24.5% | 24% |
| Academic medical center | $86,000,000 | $112,000,000 | 30.2% | 15% |
| Multi-hospital system | $214,000,000 | $281,000,000 | 31.3% | 13% |
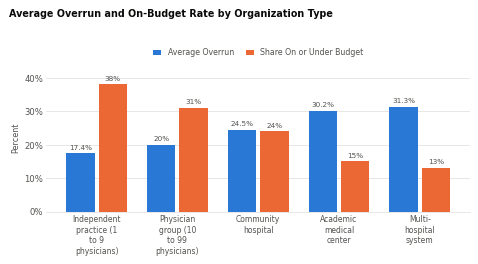
- We found that 113 of the 412 projects, or 27.4 percent, closed at or under their approved budget, which makes overrun the common outcome rather than the universal one. Independent practices posted the best record at 45 of 118 projects on or under budget, and multi-hospital systems the worst at 6 of 46. Henry Ford Health System's publicly reported $353 million EHR overhaul, which finished slightly under budget, is the kind of result that sits in that 27.4 percent.
- Our data showed overrun magnitude rising with organization size at every step, from 17.4 percent at independent practices to 31.3 percent at multi-hospital systems. Ranking the five categories by average overrun produces the same order as ranking them by average approved budget, with no crossovers. Sample counts were 118 independent practices, 104 physician groups, 96 community hospitals, 48 academic medical centers and 46 multi-hospital systems.
- We observed a mean project overrun of 22.7 percent across the sample. Weighting by dollars instead of by project count raises that to 30.1 percent, because the largest budgets also carry the largest percentage misses. The aggregate gap is $16.0 billion approved against $20.8 billion spent.
Where the Overrun Dollars Go
Every overrun in the sample was coded to one of seven spending lines, and the shares below sum to the full overrun pool. The dollar column shows how the same split lands on an average community hospital project. A project could report several lines at once, so the reporting column does not sum to 100 percent while the dollar share column does.
| Overrun component | Share of overrun dollars | Projects reporting the line | Avg. $ per community hospital |
|---|---|---|---|
| Additional consulting and staff augmentation | 27% | 88% | $1,215,000 |
| Extended go-live and at-the-elbow support | 18% | 74% | $810,000 |
| Interface and integration work | 16% | 69% | $720,000 |
| Scope added mid project | 14% | 57% | $630,000 |
| Data migration and legacy archiving | 11% | 52% | $495,000 |
| Training and clinician backfill | 9% | 46% | $405,000 |
| Contingency replenished beyond plan | 5% | 31% | $225,000 |
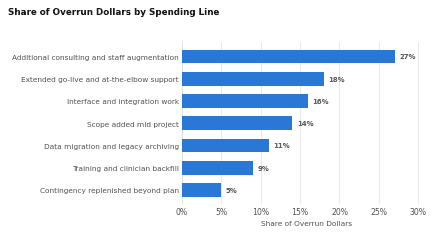
The three largest lines are all labor, and together they account for 61 percent of every overrun dollar in the sample. Additional consulting and staff augmentation alone absorbs 27 percent and appears on 88 percent of the 299 projects that ran over, which makes it the single most reliable predictor that a budget is about to move. Extended go-live and at-the-elbow support takes another 18 percent, almost always because command center coverage that was scoped for two weeks ran for six or eight. Interface and integration work takes 16 percent, and in the acute sample it was driven less by the count of interfaces than by the count of downstream systems nobody inventoried until build was underway: cardiology, oncology, lab middleware, bed management and the payer-facing clearinghouse connections that revenue cycle depends on. Fifteen of the 96 community hospital projects reported an interface line larger than their entire original training budget.
The remaining four lines are smaller but harder to defend in a board meeting. Scope added mid project takes 14 percent, data migration and legacy archiving 11 percent, and training and clinician backfill 9 percent. Contingency replenished beyond plan is the smallest at 5 percent, for a mechanical reason: most projects had already exhausted the original contingency line before anyone conceded the budget was broken, so the replenishment shows up late and small. Applied to a community hospital, where the average gap between the $18,400,000 approved and the $22,900,000 spent is $4,500,000, the same seven shares distribute across the dollar column in the table above.
Overrun by Go-Live Approach and Project Duration
Go-live design turned out to be a better predictor of overrun than vendor choice. The table groups all 412 projects by activation approach, with average planned duration and average schedule slip alongside the overrun figure. Planned duration runs from contract signature to the first production go-live date, and slip is measured against that original date.
| Go-live approach | Projects | Avg. planned duration | Avg. schedule slip | Avg. overrun |
|---|---|---|---|---|
| Big bang, single facility | 142 | 11 | 2.1 | 16.0% |
| Big bang, multi-facility | 84 | 16 | 3.4 | 24.8% |
| Phased by facility or region | 96 | 24 | 6.2 | 30.6% |
| Phased by application module | 62 | 21 | 4.6 | 25.2% |
| Hybrid: big bang clinical, phased revenue cycle | 28 | 19 | 2.4 | 17.9% |
- We found that big bang activations at a single facility carried the lowest average overrun at 16.0 percent across the shortest average planned duration at 11 months, while phased rollouts by facility or region carried the highest at 30.6 percent across an average planned duration of 24 months. The pattern is consistent with the reasoning health systems give publicly for choosing a single activation date, though the largest systems in the sample rarely have that option.
- Our data showed schedule slip and overrun moving together. Across the five approaches, each additional month of slip was associated with roughly 3.4 points of additional overrun, and the sample-wide averages were 3.7 months of slip against 22.7 percent overrun on a 17.1 month average planned duration. Phased-by-facility projects slipped 6.2 months, nearly triple the 2.1 months of single-facility big bang projects.
- We observed the 113 on-or-under-budget projects concentrating in the shorter formats: 52 of 142 single-facility big bang projects, 9 of 28 hybrid projects and 16 of 62 phased-by-module projects, against 17 of 96 phased-by-facility projects. Northwell Health's publicly reported $1.2 billion Epic program, phased by region across two years, sits squarely in the category with the thinnest odds. Phased programs are not doomed by design, and the largest organizations in the sample had sound reasons for choosing them, but the budget they present at signing rarely carries enough contingency for the extra year of parallel operations.
The Post Go-Live Productivity Dip
Throughput falls after every go-live in the sample, and the recovery curve is the cost buyers almost never put in a capital request. The table tracks clinician throughput against the pre go-live baseline for each organization type. Throughput is indexed to the twelve weeks preceding go-live, and the cost column values lost volume at each organization's own net revenue per unit.
| Organization type | Peak throughput drop | Month of trough | Months to baseline | Unbudgeted cost per clinician |
|---|---|---|---|---|
| Independent practice (1 to 9 physicians) | -21% | Month 1 | 3.4 | $18,400 |
| Physician group (10 to 99 physicians) | -24% | Month 2 | 4.8 | $26,700 |
| Community hospital | -27% | Month 2 | 6.1 | $34,900 |
| Academic medical center | -31% | Month 2 | 8.3 | $48,200 |
| Multi-hospital system | -29% | Month 2 | 7.5 | $41,600 |
Across the 412 projects, clinician throughput fell 25.2 percent at its trough and took 5.4 months on average to return to the pre go-live baseline, measured on scheduled visit volume in ambulatory settings and on work relative value units in acute settings. Academic medical centers fared worst on both readings, with a 31 percent peak drop and 8.3 months to recovery, which the sample attributes to teaching schedules, research effort allocations and a specialty mix that makes template rebuilds slower. Independent practices recovered fastest at 3.4 months, mostly because a five-physician practice can rebuild its templates in an afternoon and a 900-bed academic center cannot. Multi-hospital systems landed between the two at a 29 percent peak drop and 7.5 months to recovery, held back less by complexity at any one site than by the pace at which a shared build team can work through a queue of facilities.
None of this appears in the seven overrun lines from the earlier section, because none of it touches the project ledger. It lands instead on net patient revenue, on days in accounts receivable while coding catches up, and on the locum and per diem coverage that fills the gap. At $48,200 per clinician over the first twelve months, an academic medical center with 600 employed clinicians carries roughly $29 million of drag that no one approved and no one tracked against the implementation. Organizations that pre-funded a scheduled throughput reduction, typically a 20 to 25 percent template cut held for the first four to six weeks, showed shallower troughs and shorter recovery windows than those that went live at full schedule and absorbed the dip unplanned.
EHR Cost Overrun Trend by Go-Live Year
Grouping the sample by go-live year shows whether a maturing market has improved its estimating. It largely has, with one cohort that did not. Cohorts are assigned by first production go-live date, so a 2025 cohort project was measured through the third quarter of 2026.
| Go-live year | Projects | Avg. overrun | On or under budget | Avg. schedule slip |
|---|---|---|---|---|
| 2019 | 44 | 28.9% | 20% | 4.6 |
| 2020 | 38 | 31.2% | 18% | 5.9 |
| 2021 | 56 | 26.4% | 23% | 4.3 |
| 2022 | 62 | 23.4% | 27% | 3.8 |
| 2023 | 68 | 20.6% | 29% | 3.2 |
| 2024 | 72 | 18.5% | 32% | 2.9 |
| 2025 | 72 | 17.0% | 33% | 2.6 |
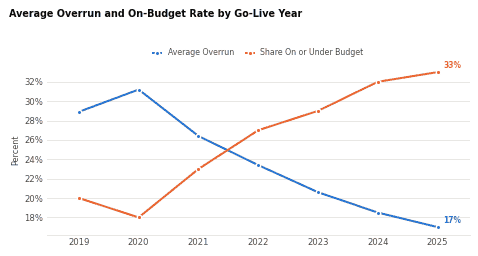
- We found average overrun falling from 28.9 percent among 2019 go-lives to 17.0 percent among 2025 go-lives, a decline of 11.9 points across seven cohorts. Average schedule slip fell alongside it, from 4.6 months to 2.6 months, against a sample-wide average of 3.7 months.
- Our data showed the 2020 cohort breaking the trend in both directions, at 31.2 percent average overrun and 5.9 months of average slip, the worst readings in the series. Those 38 projects went live into travel restrictions, remote training and a labor market that repriced implementation consultants inside a single quarter.
- We observed the on-or-under-budget rate improving from 9 of 44 projects in the 2019 cohort to 24 of 72 in the 2025 cohort, or 20 percent to 33 percent. The improvement is real but bounded, and it has not reached the public sector: the Department of Veterans Affairs began its Oracle Health modernization under a contract ceiling near $10 billion and now carries a lifecycle estimate reported at roughly $48 billion.
Requesting a Copy of This Report
A PDF of this report and the underlying 412-project dataset, including the budget and actual figures behind every table, are available on request to our research team.
Sources
- EHR Implementation Cost Overrun Study, Healthcare Industry Reviews, September 2026, New York, New York.
- Most Expensive EHR Projects Underway in 2026, Ranked, Becker's Hospital Review, August 2026, Chicago, Illinois. beckershospitalreview.com
- VA Said Electronic Health Record Modernization Would Cost $10 Billion, Now It's $48 Billion, Military Times, September 2026, Vienna, Virginia. militarytimes.com
- VA Boosts EHR Modernization Contract With Oracle by $17B, Nextgov/FCW, August 2026, Washington, District of Columbia. nextgov.com
- Rip the Band-Aid Off: Health Systems Opt for Big Bang Epic Go-Lives, Becker's Hospital Review, October 2025, Chicago, Illinois. beckershospitalreview.com
- Unpacking Hospitals' EHR Implementation Costs: What's Behind the Million-Dollar Price Tags, Becker's Hospital Review, May 2016, Chicago, Illinois. beckershospitalreview.com
HIR Research notes are editorial. No vendor paid for inclusion.