Report · Sep 2026
Healthcare SaaS Sales Cycle Length Statistics: 2026 Report
This report looks at healthcare SaaS sales cycle length for software sold into U.S. providers and payers as of 2026. Cycle length here is elapsed days from the first qualified meeting to a fully executed contract.
We tracked 1,062 closed-won contracts from 214 health technology and services vendors selling software, analytics, artificial intelligence and documentation tools, clearinghouse services, and outsourced revenue cycle platforms. For each deal we recorded deal size, buyer type, pilot structure, stakeholder count, and stage duration. The median cycle was 178 days, with an interquartile range of 81 to 313 days. The tables below break that figure down by buyer type and by annual contract value, show where the days go stage by stage, quantify what a pilot adds and what it returns, and track the quarterly direction of cycle length since the third quarter of 2024.
Sales Cycle Length by Buyer Type
Buyer type explains more of the variance in cycle length than any other variable we tested, including deal size. The table below reports days from first qualified meeting to signed contract for the seven buyer categories with the deepest coverage in the study.
| Buyer type | 25th percentile (days) | Median (days) | 75th percentile (days) | Contracts |
|---|---|---|---|---|
| Independent practice | 27 | 44 | 71 | 168 |
| Physician group | 58 | 92 | 146 | 204 |
| Ambulatory organization | 96 | 151 | 228 | 149 |
| Community hospital | 141 | 214 | 321 | 186 |
| Payer | 198 | 291 | 436 | 85 |
| Academic medical center | 217 | 326 | 471 | 118 |
| Multi-hospital system | 244 | 362 | 528 | 152 |
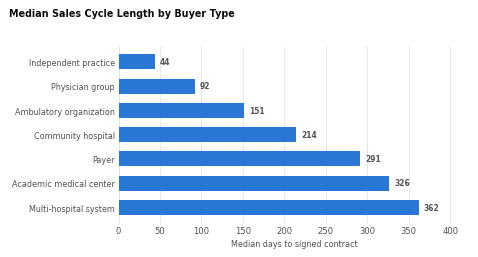
- We found that a multi-hospital system takes 8.2 times as long to sign as an independent practice, 362 days against 44, and that the gap is structural rather than a matter of negotiating posture. The independent practice deals in our sample were signed by one or two people. The multi-hospital system deals passed through a median of 27 distinct stakeholders and 6 formal approval bodies.
- Our data showed that the tail matters more than the median for anyone building a forecast. At academic medical centers the 75th percentile sits at 471 days, meaning one deal in four takes more than 15 months, while the 25th percentile at 217 days is already longer than the full-sample median. A vendor that plans against the midpoint of that range will miss a quarter of its pipeline by two quarters or more.
- We observed that payers behave like a large provider organization rather than a separate species, landing at a median of 291 days, between community hospitals at 214 and academic medical centers at 326. Across the full sample the median deal touched 14 distinct stakeholders and 2 formal approval committees, and stakeholder count tracked cycle length more tightly than contract value did.
Sales Cycle Length by Annual Contract Value
The second question every founder asks is whether a bigger deal is worth the wait. We banded the sample by first-year annual contract value and measured the same first-meeting-to-signature interval within each band.
| Annual contract value | 25th percentile (days) | Median (days) | 75th percentile (days) | Share of contracts |
|---|---|---|---|---|
| Under $25,000 | 36 | 58 | 96 | 20.8% |
| $25,000 to $74,999 | 71 | 124 | 192 | 25.2% |
| $75,000 to $249,999 | 116 | 191 | 288 | 23.9% |
| $250,000 to $749,999 | 167 | 261 | 379 | 16.3% |
| $750,000 to $1,999,999 | 228 | 338 | 472 | 8.8% |
| $2,000,000 and above | 291 | 417 | 594 | 5.0% |
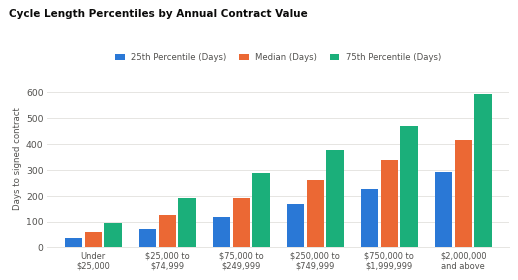
Cycle length rises with contract value, but it rises far more slowly than the value itself. Moving from the under $25,000 band to the $2,000,000 and above band multiplies first-year revenue by roughly eighty, while the median cycle lengthens by a factor of 7.2, from 58 days to 417. On a revenue-per-selling-day basis the largest deals in our sample are the most efficient by a wide margin, which is the opposite of the conclusion most early-stage health technology teams draw from the pain of a long enterprise cycle.
The step between adjacent bands is stable. Each move up the table adds between 66 and 79 days at the median, with the increments growing slowly as deals get larger: 66 days from the smallest band to the second, 67 to the third, then 70, 77 and 79. There is no cliff and no plateau, which tells us that price itself does not trip a new review; each band simply adds another committee to the queue. The consequence falls hardest in the middle. A vendor whose average contract sits at $60,000 is already absorbing 124 median days, roughly seven tenths of the full-sample cycle, while collecting a fraction of the enterprise price. The interquartile range in that band runs from 71 to 192 days, so even the fast half of those deals takes longer to close than the entire median cycle at an independent practice.
Where the Time Goes, Stage by Stage
We decomposed each cycle into seven sequential, non-overlapping stages and measured the elapsed days in each. Stage medians do not add in general, but in this sample the seven medians below sum to 178 days, matching the full-sample median, so the shares can be read as a decomposition of the typical cycle.
| Stage | Median duration (days) | Share of total cycle | Distinct stakeholders engaged |
|---|---|---|---|
| Discovery and qualification | 25 | 14% | 3 |
| Clinical or department evaluation | 32 | 18% | 6 |
| Security and privacy review | 39 | 22% | 4 |
| IT integration review | 22 | 12% | 5 |
| Legal and contracting | 30 | 17% | 3 |
| Committee or board approval | 21 | 12% | 9 |
| Signature and countersignature | 9 | 5% | 2 |
We found that security and privacy review is the single longest stage at a median of 39 days and 22 percent of the cycle, longer than legal and contracting at 30 days and longer than the clinical or department evaluation that decides whether the product is wanted at all. The stage engages a median of 4 stakeholders, fewer than the clinical or department evaluation before it and fewer than the IT integration review after it, which suggests the delay is queue depth rather than debate.
Our data showed that the three stages a vendor can directly influence through product and clinical evidence, discovery and qualification, clinical or department evaluation, and IT integration review, together account for 44 percent of the cycle. The three administrative stages of security review, legal and contracting, and committee or board approval account for 51 percent. Signature and countersignature closes the remaining 5 percent at a median of 9 days.
We observed that committee or board approval is short in elapsed days, 21 days at the median, but the most crowded stage in the cycle, drawing a median of 9 distinct participants. Elapsed time at that step is governed by the meeting calendar, so a deal that misses a monthly capital committee loses four weeks without a single objection being raised. Individuals are counted once per stage and many appear in several, so the stakeholder column describes the working group at each step rather than summing to the deal total of 14.
What a Pilot Adds and What It Returns
Pilots are the most consequential structural choice in a healthcare technology sale. We separated deals that ran a pilot from those that went straight to contract, and measured conversion against the full population of pilots that reached a decision during the study window.
| Path to contract | Share of signed contracts | Median days to signature | Days added vs. no pilot | Pilot-to-contract conversion |
|---|---|---|---|---|
| No pilot, direct to contract | 58.3% | 138 | 0 | Not applicable |
| Unpaid pilot or proof of concept | 21.4% | 263 | +125 | 44.3% |
| Paid pilot, single site | 14.5% | 229 | +91 | 69.7% |
| Paid pilot, multi-site | 5.8% | 317 | +179 | 75.6% |
A pilot costs between 91 and 179 median days, and what a vendor gets for that time depends almost entirely on whether money changed hands. Across the 815 pilots in our sample that reached a decision, 443 converted into a signed contract, an overall pilot-to-contract conversion of 54.4 percent. Split by structure, the spread is wide. Unpaid pilots and proofs of concept converted at 44.3 percent while adding 125 days to the cycle. Paid single-site pilots converted at 69.7 percent and added 91 days, the shortest pilot path in the study and the highest return per day spent.
Multi-site paid pilots converted best at 75.6 percent, but they are the most expensive path in calendar terms, adding 179 days and pushing the median deal to 317 days from first meeting to signature. The pattern across all three structures is consistent: a buyer willing to fund a pilot has already cleared an internal budget hurdle, and that hurdle is a better predictor of eventual signature than any product criterion we measured. Just under six in ten contracts, 58.3 percent of the sample, involved no pilot at all and closed at a median of 138 days, well under the full-sample median of 178.
Quarterly Trend in Cycle Length, Q3 2024 to Q2 2026
Health system capital budgets tightened through 2025 and into 2026. We tracked the median cycle by quarter of signature to see whether that pressure lengthened deals or compressed them.
| Quarter | Median days to signature | Median security review (days) | Share requiring committee or board approval | Contracts closed |
|---|---|---|---|---|
| Q3 2024 | 158 | 32 | 52% | 118 |
| Q4 2024 | 168 | 34 | 54% | 141 |
| Q1 2025 | 163 | 36 | 55% | 127 |
| Q2 2025 | 177 | 38 | 57% | 132 |
| Q3 2025 | 189 | 42 | 61% | 119 |
| Q4 2025 | 184 | 41 | 60% | 148 |
| Q1 2026 | 196 | 45 | 63% | 136 |
| Q2 2026 | 188 | 43 | 62% | 141 |
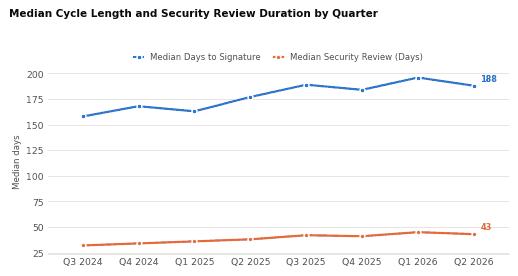
- We found that cycles lengthened by 30 days over the eight quarters, from a median of 158 in the third quarter of 2024 to 188 in the second quarter of 2026, an increase of 19.0 percent. The path wobbled rather than climbing cleanly. Cycles eased in the first quarter of 2025 and again in the fourth quarter of 2025 before resuming their rise, so a vendor reading either dip as a turn in the market would have been wrong twice inside eighteen months.
- Our data showed that security and privacy review absorbed most of the increase, rising from a median of 32 days to 43 days over the same period, a gain of 34.4 percent. That single stage accounts for 11 of the 30 added days, with the remaining 19 spread across committee approval and legal review.
- We observed that the share of contracts requiring a formal committee or board vote climbed from 52 percent to 62 percent, averaging 58 percent across the full sample. That is the clearest mechanism behind the lengthening: as budgets tightened, purchases that a department head could once approve were routed upward. The first quarter of 2026 was the slowest in the series at a median of 196 days, and the pullback to 188 in the second quarter is the only compression signal in the data, too small on its own to call a reversal.
Requesting a Copy of This Report
A full PDF of this report, along with the underlying deal-level dataset covering all 1,062 contracts, stage timings and pilot outcomes, is available on request to analysts, journalists and operators who want to cut the data differently.
Sources
- Healthcare SaaS Sales Cycle Length Study, Healthcare Industry Reviews, September 2026, New York, New York.
- H1 2026 Funding and Market Overview: Durable Roots, Shifting Routes, Rock Health, July 2026, San Francisco, California. rockhealth.com
- PHTI Playbook on Performance-Based Contracting: A Guide for Purchasers and Digital Health Companies, Peterson Health Technology Institute, September 2026, New York, New York. phti.org
- Uncertainty on Multiple Fronts Slowed EHR Purchases: Insights from KLAS's 2026 Acute Care EHR Market Share Report, KLAS Research, May 2026, Pleasant Grove, Utah. klasresearch.com
- Third-Party Risk Management Stalls After Onboarding, KLAS Finds Life-Cycle Oversight Gap, Anthony Guerra, healthsystemCIO, June 2026, Fair Haven, New Jersey. healthsystemcio.com
- Large Funding Rounds Help Boost Digital Health Investment in H1, Emily Olsen, Healthcare Dive, July 2026, Washington, District of Columbia. healthcaredive.com
- Why Selling to Healthcare Takes So Long, Adam Turinas, Health Launchpad, March 2024, Boston, Massachusetts. healthlaunchpad.com
HIR Research notes are editorial. No vendor paid for inclusion.