Report · Sep 2026
Healthcare Staffing Agency Markup Statistics: 2026 Report
This report looks at healthcare staffing agency markup across U.S. facilities in 2026. Markup is the gap between the bill rate a facility pays a staffing agency and the pay rate the clinician receives, normalized here to a single hour of billed clinical time.
We collected 6,410 matched bill rate and pay rate pairs from executed staffing agreements, vendor management system extracts, and paid invoices covering 214 facilities and 83 staffing firms. Pay rate means the clinician's all-in hourly compensation, including taxable wages and any tax-free stipends; pass-through is the share of every billed dollar that lands with the clinician. The tables below cover markup by clinician type, the anatomy of a bill rate, markup by contract structure, markup and pass-through by facility type, and the quarterly trend for travel registered nurse contracts since the pandemic peak unwound.
Markup by Clinician Type
Markup is quoted here as the premium over the clinician's all in hourly compensation, meaning taxable wages plus any tax free stipends. Pass through is the mirror image, the share of every billed dollar that lands with the clinician.
| Clinician type | Median pay | Median bill | Median markup | Pass-through |
|---|---|---|---|---|
| Travel registered nurse | $63.40 | $96.20 | 51.7% | 65.9% |
| Respiratory therapist | $58.10 | $87.90 | 51.3% | 66.1% |
| Surgical technologist | $47.80 | $73.60 | 54.0% | 64.9% |
| Imaging and laboratory technologist | $55.20 | $84.30 | 52.7% | 65.5% |
| Advanced practice clinician (NP and PA) | $93.50 | $139.30 | 49.0% | 67.1% |
| Locum hospitalist | $196.00 | $287.00 | 46.4% | 68.3% |
| Locum psychiatrist | $238.00 | $341.00 | 43.3% | 69.8% |
| Locum anesthesiologist | $322.00 | $452.00 | 40.4% | 71.2% |
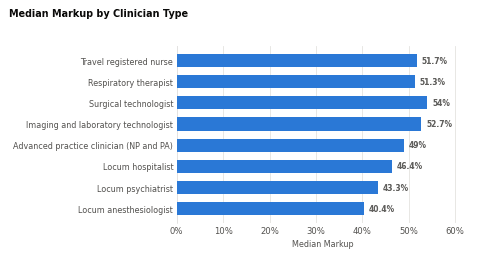
- We found that markup broadly falls as the pay rate rises. Surgical technologists carry the highest median markup of any clinician type at 54.0%, locum anesthesiologists the lowest at 40.4%, a spread of 13.6 points. Percentage markup and dollar margin move in opposite directions: the surgical technologist placement yields $25.80 an hour of gross spread, the anesthesiology placement $130.00. Agencies price the recruiting effort, and recruiting a surgical technologist costs roughly what recruiting an anesthesiologist costs while generating a fifth of the gross spread to cover it.
- Our data showed that the travel registered nurse, the archetype of the whole category, sits close to the middle at a 51.7% markup on a $63.40 pay rate and a $96.20 bill rate. The $32.80 gap between those two numbers is what gets quoted in staffing debates as agency profit. Most of it is spent before it reaches the income statement, and the next section takes it apart line by line. Advanced practice clinicians sit one step down the markup curve at 49.0%, between the allied health cluster and the physician specialties.
- We observed that physician placements pass through more of the bill dollar than any other category, between 68.3% and 71.2%, largely because locum physicians are usually engaged as independent contractors and carry no employer payroll burden. Allied health roles, which are almost always W2, cluster between 64.9% and 66.1%. The gap between the two groups is a difference in tax and insurance treatment surfacing in the pass through column, with the clinician carrying the cost either way.
The Anatomy of a Bill Rate
Every component below is expressed as a share of the bill rate, and the four components sum to the full billed dollar. Employer burden covers payroll taxes, workers compensation, professional liability and, for physicians, malpractice. Agency operating cost covers recruiting, credentialing, compliance, billing, invoice financing and vendor management system fees.
| Clinician group | Pay & stipends | Employer burden | OpEx & VMS | Net margin |
|---|---|---|---|---|
| Travel registered nurse | 65.9% | 11.4% | 18.2% | 4.5% |
| Respiratory therapist and imaging technologist | 65.8% | 11.6% | 17.7% | 4.9% |
| Surgical technologist | 64.9% | 12.1% | 17.8% | 5.2% |
| Advanced practice clinician | 67.1% | 10.3% | 17.4% | 5.2% |
| Locum physician | 69.3% | 7.9% | 16.1% | 6.7% |
| All placements, volume weighted | 66.5% | 11.0% | 17.7% | 4.8% |
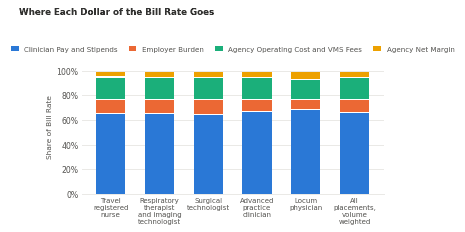
The confusion that drives most public argument about staffing markup lives in the distance between column two and column five. Across all 6,410 rate pairs the clinician receives 66.5% of the bill rate, which leaves an agency gross margin of 33.5%. Of that gross margin, 11.0 points go to employer burden the agency never touches and 17.7 points go to operating cost, including the fee the vendor management system deducts before the agency sees the invoice. What survives is 4.8 points of net margin. On the median travel nurse hour that is $4.33, against a $32.80 headline gap.
The locum physician column behaves differently for a structural reason. Contractor status strips employer burden down to 7.9% of the bill rate, roughly a third below the travel nurse figure, and the savings split between the physician and the agency. Locum physicians keep 4.4 more cents of every billed dollar than surgical technologists do, and locum agencies still clear the highest net margin in the table at 6.7%. Malpractice coverage, state licensure and credentialing absorb most of what remains of the burden line, which is why physician markup can look modest while physician placements remain the most profitable work an agency takes. The broader lesson sits in the same comparison. Markup prices the cost of employing a clinician, net margin prices the cost of finding one, and the two columns can move independently. A facility benchmarking suppliers on markup alone is reading the column that tells it least about what its supplier earns.
Markup by Contract Type
Contract structure moves markup more than any single clinician attribute. The share column reports each structure's portion of all placements in the study.
| Contract type | Pricing basis | Median markup/fee | Pass-through | Share |
|---|---|---|---|---|
| Travel contract, 13 weeks | Hourly bill rate, stipends included | 50.5% | 66.4% | 48.2% |
| Per diem, shift by shift | Hourly bill rate, shift minimum | 58.9% | 62.9% | 21.3% |
| Local contract, no stipends | Hourly bill rate, taxable wage only | 44.8% | 69.1% | 14.6% |
| Locum tenens assignment | Hourly or daily bill rate | 44.1% | 69.4% | 8.7% |
| Crisis or rapid response | Hourly bill rate, premium term | 41.6% | 70.6% | 5.4% |
| Direct hire conversion | Percent of first year base salary | 20.8% of salary | Not applicable | 1.8% |
- We found that per diem work carries the highest markup of any hourly structure at 58.9%, and crisis or rapid response contracts the lowest at 41.6%, a spread of 17.3 points. The ordering surprises facilities that assume they are being gouged on emergency coverage. Crisis rates are high in absolute dollars and thin in percentage terms, because almost the entire premium is spent buying a clinician on short notice. Rapid response pricing passes 70.6% of the billed hour straight through to the clinician, the highest figure in the table.
- Our data showed that the two structures a facility reaches for most, travel contracts and per diem shifts, together account for 69.5% of placements and return pass through of 66.4% and 62.9% respectively, the two lowest figures in the table. Per diem loses ground because a single shift carries the same credentialing, scheduling and billing cost as a thirteen week assignment and amortizes it over a fraction of the hours. Facilities running large per diem books are paying a fixed cost repeatedly that a contract would let them pay once.
- We observed that local contracts, where the clinician lives within commuting distance and receives no tax free stipend, return the third highest pass through at 69.1% on a 44.8% markup. Direct hire conversion is priced on a different axis entirely, a median 20.8% of first year base salary, and represents 1.8% of placements, a small share that carries outsized weight in renewal negotiations. Across all hourly structures the volume weighted markup is 50.4% and the volume weighted pass through is 66.5%, which are the two headline numbers for the study as a whole.
Markup and Pass Through by Facility Type
Buying power tracks size and sophistication. The vendor management system column reports the fee deducted from the agency's invoice where a VMS or managed service provider sits between the facility and the supplier.
| Facility type | Median markup | VMS/MSP fee | Pass-through | Net margin |
|---|---|---|---|---|
| Academic medical center | 45.2% | 4.4% | 68.9% | 3.6% |
| Multi hospital system, acute | 48.1% | 3.9% | 67.5% | 4.2% |
| Ambulatory surgery and clinic | 51.4% | 2.2% | 66.1% | 5.5% |
| Community hospital, independent | 53.6% | 2.8% | 65.1% | 5.4% |
| Critical access hospital | 58.7% | 1.6% | 63.0% | 6.8% |
| Skilled nursing and post acute | 61.9% | 1.1% | 61.8% | 7.3% |
Academic medical centers pay the lowest median markup of any facility type at 45.2% and skilled nursing and post acute facilities the highest at 61.9%, a spread of 16.7 points on identical clinical work. The mechanism is procurement maturity rather than anything about the care delivered. Academic centers and multi hospital systems run competitive vendor panels, publish rate caps by specialty and audit invoices against them. Critical access hospitals and post acute operators buy in single shift increments, often after a call out, and pay the premium that urgency commands. Volume compounds the effect. A system placing several hundred contracts a year can hold a supplier to a published rate card; a twenty five bed rural hospital placing a dozen has nothing to hold anyone to.
The vendor management system column runs in the opposite direction, from 4.4% of the bill rate at academic medical centers down to 1.1% at skilled nursing and post acute facilities, and it complicates the picture for suppliers. A low markup account with a high VMS fee is a thin account twice over, which is why agency net margin at academic medical centers lands at 3.6% while post acute work clears 7.3%, a 3.7 point difference. Clinicians see the same ordering in reverse: pass through is highest at academic medical centers, at 68.9%, and lowest in post acute settings, at 61.8%. Facilities that negotiate hardest on markup are the same facilities whose clinicians take home the largest share of the billed hour, an alignment of interests that neither side usually notices. The ambulatory category is the outlier worth watching: a 51.4% markup with a 2.2% vendor management fee leaves agencies 5.5% net margin, above every hospital category except critical access, which explains why suppliers have been building ambulatory desks.
Quarterly Markup Trend Since the Pandemic Peak
The series below tracks travel registered nurse contracts, the category with the deepest quarterly history in our data. Bill rates and pay rates are medians for the quarter; net margin is the agency's after cost result.
| Quarter | Median bill | Median pay | Median markup | Net margin |
|---|---|---|---|---|
| Q3 2024 | $92.80 | $65.10 | 42.5% | 2.9% |
| Q4 2024 | $93.60 | $65.40 | 43.1% | 3.0% |
| Q1 2025 | $95.90 | $66.60 | 44.0% | 3.3% |
| Q2 2025 | $94.10 | $65.60 | 43.4% | 3.1% |
| Q3 2025 | $93.40 | $64.20 | 45.5% | 3.6% |
| Q4 2025 | $95.20 | $65.10 | 46.2% | 4.0% |
| Q1 2026 | $97.80 | $65.90 | 48.4% | 4.3% |
| Q2 2026 | $96.20 | $63.40 | 51.7% | 4.5% |
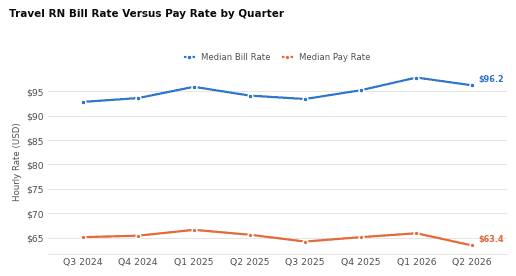
- We found that travel nurse markup widened from 42.5% in Q3 2024 to 51.7% in Q2 2026, a gain of 9.2 points across eight quarters, with only Q2 2025 breaking the direction. Bill rates did not drive it. The median bill rate moved between $92.80 and $97.80 across the whole series and peaked in Q1 2026, a range of about five dollars over two years.
- Our data showed that the widening came from the pay side. Median pay rates fell from $65.10 to $63.40 over the same eight quarters as the clinician supply that the pandemic pulled into travel work settled back toward staff and local roles. Q2 2026 produced the steepest single quarter move in the series, 3.3 points, when bill rates slipped 1.6% while pay rates fell 3.8%. Markup widens fastest when the supply of willing travelers loosens faster than facility budgets tighten.
- We observed that agency net margin recovered alongside markup but at a fraction of the pace, from 2.9% to 4.5% of the bill rate, because burden, vendor management system fees and credentialing cost absorbed most of the reclaimed spread. Eight quarters of markup expansion bought agencies 1.6 points of net margin, roughly one point of profit for every six points of markup. Facilities reading rising markup as rising supplier profit are reading a number that mostly went somewhere else.
Requesting a Copy of This Report
The full Healthcare Staffing Markup Study is available as a PDF, and the underlying 6,410 rate pairs can be released as a spreadsheet with facility type, contract type and clinician category retained. Write to our research team to request either.
Sources
- Healthcare Staffing Markup Study, Healthcare Industry Reviews, September 2026, New York, New York.
- Signs of Stability in Travel Nursing, but Profitability Challenges Remain, Staffing Industry Analysts, June 2026, Mountain View, California. staffingindustry.com
- After Pandemic Boom, Travel Nursing Finds New Footing, Staffing Industry Analysts, February 2026, Mountain View, California. staffingindustry.com
- Everything Travel Nurses Want to Know About Bill Rates, Vivian Health, March 2025, San Francisco, California. vivian.com
- Anatomy of a Traveler Bill Rate, HWL, August 2024, Brookfield, Wisconsin. hwlworks.com
- Understanding MSP Fees in Healthcare Staffing and Their Market Impact, VARS Health, January 2026, Dallas, Texas. varshealth.com
- How Locums Pricing Works: Agency Markups, Bill Rates and What You Actually Pay, Locums.one, April 2026, Austin, Texas. locums.one
HIR Research notes are editorial. No vendor paid for inclusion.