Report · Sep 2026
RCM Outsourcing Pricing Statistics: 2026 Report
This report looks at revenue cycle management (RCM) outsourcing pricing across U.S. provider organizations as of 2026. Most of these engagements are sold as a share of the cash the vendor brings in, and every rate below is reported as a median with 25th and 75th percentiles.
We collected 1,184 priced RCM engagements from executed contracts, vendor proposals, and published rate cards covering independent practices, physician groups, ambulatory organizations, community hospitals, academic medical centers, and multi-hospital systems, priced between January 2024 and August 2026. The tables below cover percentage-of-collections rates by specialty, the volume discount curve by annual net collections, the mix of pricing models and what each one costs, the scope of work bundled at each price point, and the quarterly path of the median rate since late 2024.
Percentage of Collections Rates by Specialty
Just under six in ten priced engagements in our sample are billed as a percentage of net collections, at a median of 5.8 percent with an interquartile range of 4.4 to 7.3 percent. The rate a practice is quoted tracks the average dollar value of its claims far more closely than it tracks clinical complexity. We ranked the eight specialty groupings with the deepest coverage in the study.
| Specialty | 25th percentile | Median rate | 75th percentile | Engagements |
|---|---|---|---|---|
| Behavioral health and substance use treatment | 6.9% | 8.4% | 9.8% | 74 |
| Physical and occupational therapy | 6.3% | 7.6% | 9.1% | 61 |
| Primary care and internal medicine | 5.2% | 6.2% | 7.4% | 138 |
| Obstetrics and gynecology | 4.9% | 5.9% | 7.0% | 58 |
| Multispecialty physician groups | 4.6% | 5.6% | 6.8% | 112 |
| Radiology and pathology | 4.2% | 5.1% | 6.2% | 67 |
| Cardiology | 4.0% | 4.9% | 5.9% | 83 |
| Orthopedic surgery | 3.8% | 4.6% | 5.5% | 94 |
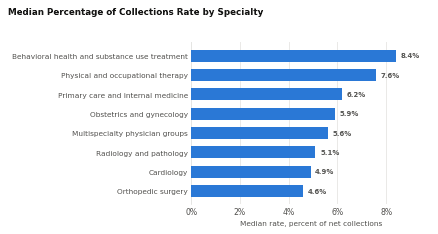
- We found that behavioral health and substance use treatment carries the highest median rate at 8.4 percent and orthopedic surgery the lowest at 4.6 percent, a spread of 3.8 points and a ratio of 1.8 to 1. Physical and occupational therapy sits second at 7.6 percent, and primary care and internal medicine third at 6.2 percent.
- Our data showed that the ranking follows average cash per claim. A behavioral health encounter that settles for $95 consumes roughly the same eligibility check, submission, posting and follow up labor as a surgical claim worth ten times as much, and vendors recover that fixed labor as a larger share of the smaller dollars it produces. Radiology and pathology break the pattern slightly at 5.1 percent, held down by claim volumes high enough to automate most of the submission and posting work.
- We observed that the interquartile range broadly widens as the median rises. Behavioral health spans 6.9 to 9.8 percent, a band of 2.9 points, while orthopedic surgery spans 3.8 to 5.5 percent, a band of 1.7 points. Buyers in the high rate specialties therefore have the most room to move a quote.
Pricing by Annual Net Collections Band
Size is the strongest single predictor of rate in our dataset, stronger than specialty. We sorted the same 687 percentage of collections engagements by the annual net collections of the buying organization, using the figure stated in the contract or proposal in place of a self reported estimate. The bands below follow the breaks vendors themselves use in their rate cards.
| Annual net collections | 25th percentile | Median rate | 75th percentile | Engagements |
|---|---|---|---|---|
| Under $2 million | 6.7% | 8.1% | 9.6% | 158 |
| $2 million to $10 million | 5.4% | 6.6% | 7.9% | 195 |
| $10 million to $50 million | 4.4% | 5.3% | 6.4% | 168 |
| $50 million to $250 million | 3.5% | 4.2% | 5.1% | 106 |
| $250 million to $1 billion | 2.8% | 3.4% | 4.2% | 42 |
| Over $1 billion | 2.2% | 2.7% | 3.3% | 18 |
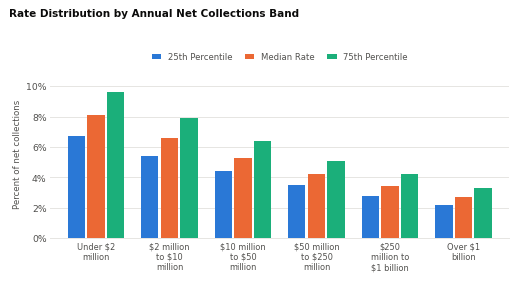
The volume discount curve runs from a median of 8.1 percent for organizations collecting under $2 million a year to 2.7 percent for those collecting more than $1 billion, a spread of 5.4 points. The smallest band pays exactly three times the rate of the largest. Translated into cost to collect, the vendor fee alone consumes $8.10 of every $100 posted at the bottom of the market and $2.70 of every $100 at the top. A 12 provider group collecting $40 million a year, priced at the band median of 5.3 percent, pays $2.12 million annually for outsourced revenue cycle management.
The curve is steepest at the small end and flattens quickly. Moving from the sub $2 million band to the $2 million to $10 million band saves 1.5 points, the next step saves 1.3, and the final step above $250 million saves 0.7. Two forces explain the shape. Implementation cost, payer enrollment work and account management overhead are close to fixed per client, so they amortize hardest over the first few million dollars of collections. Above $250 million, buyers run structured procurements with three or more bidders and often unbundle the work into per FTE and managed services constructs that sit outside the percentage model entirely. Only 18 engagements in our sample sit above $1 billion, so the quartiles in that row should be read as directional.
Pricing Model Mix and Typical Rates
Percentage of collections dominates, but four other constructs together account for 42.0 percent of priced engagements. Rates below are medians across all 1,184 engagements in the study, with the interquartile range for each model. Converting them onto a common basis is the only way to compare two offers that quote on different terms.
| Pricing model | Share of engagements | Median rate | Interquartile range | Engagements |
|---|---|---|---|---|
| Percentage of net collections | 58.0% | 5.8% of net collections | 4.4% to 7.3% | 687 |
| Per claim | 14.0% | $6.40 per claim | $4.10 to $9.30 | 166 |
| Per FTE, offshore delivery | 12.0% | $3,150 per FTE per month | $2,400 to $4,050 | 142 |
| Flat monthly retainer | 9.0% | $1,240 per provider per month | $780 to $2,100 | 106 |
| Hybrid base plus percentage | 7.0% | $860 base plus 2.9% of collections | $540 to $1,420 base | 83 |
We found that the models sort by buyer type. Percentage of collections accounts for 58.0 percent of engagements and concentrates among independent practices and physician groups, while per FTE offshore staffing accounts for 12.0 percent and concentrates among community hospitals, health systems and the RCM vendors that subcontract capacity themselves. Flat monthly retainers, at 9.0 percent of engagements, appear mostly in single specialty practices with predictable encounter volumes, and hybrid deals, at 7.0 percent, appear where a buyer wants the vendor to carry part of the collections risk without paying a pure contingency rate.
Our data showed that per claim and hybrid pricing land close to the percentage median once converted. At the median $6.40 per claim, a practice posting an average of $110 of cash per claim pays the equivalent of 5.8 percent. The median hybrid deal, $860 per provider per month plus 2.9 percent, works out to 4.3 percent all in for a provider collecting $60,000 a month, which is the discount buyers accept in exchange for carrying the volume risk.
We observed that per FTE pricing is quoted as a bill rate rather than a pay rate, and the distinction matters when comparing offers. One offshore FTE at the median $3,150 per month costs $37,800 a year, so a $9 million group staffing four offshore FTEs spends $151,200, or 1.7 percent of collections, before onshore supervision, software and clearinghouse fees are added.
Scope of Work Included at Each Price Point
A rate means little without the scope attached to it. We coded each percentage of collections engagement by the functions the base fee covers and took the median rate at each tier.
| Scope tier | Functions added | Median rate | Share | Engagements |
|---|---|---|---|---|
| Tier 1 | Claims submission and payment posting | 3.2% | 11.1% | 76 |
| Tier 2 | Accounts receivable follow up | 4.7% | 18.9% | 130 |
| Tier 3 | Professional coding | 5.8% | 24.0% | 165 |
| Tier 4 | Denial management and appeals | 6.6% | 22.0% | 151 |
| Tier 5 | Prior authorization and eligibility | 7.5% | 15.0% | 103 |
| Tier 6 | Patient billing and contact center | 8.0% | 6.1% | 42 |
| Tier 7 | Credentialing and payer enrollment | 8.7% | 2.9% | 20 |
Scope moves price by 5.5 points, from 3.2 percent for submission and posting alone to 8.7 percent for a full cycle engagement that also carries credentialing and payer enrollment. The top tier costs 2.7 times the bottom one. The largest single increment is accounts receivable follow up, which adds 1.5 points, followed by professional coding at 1.1 points and prior authorization and eligibility at 0.9. Denial management and appeals adds 0.8, credentialing and payer enrollment adds 0.7, and patient billing with a contact center adds 0.5. The middle of the market clusters tightly around coding and denials: tiers three and four together account for 46.0 percent of percentage priced engagements, which is where most quotes a practice receives will land.
Two quotes that differ by two points usually describe different products. A buyer comparing a 4.7 percent proposal against a 6.6 percent proposal is most often comparing a billing and follow up scope against one that also owns coding and the denial queue, and the cheaper offer leaves both functions on the practice payroll. The tail of the distribution is thin at the top: 2.9 percent of percentage priced engagements fold credentialing and payer enrollment into the base fee, and the rest bill enrollment separately at a per payer, per provider rate. Our recommendation to buyers is a function by function scope matrix signed alongside the rate, with denial appeal thresholds, patient statement volumes and credentialing turnaround stated in the same document.
Quarterly Trend in the Median Rate by Arrangement Type
Offshore delivery and automation have pushed rates down since late 2024. Of the 687 percentage of collections engagements, 604 were priced in the eight quarters below and 83 earlier in 2024; full outsourcing accounts for 70.9 percent of them, extended business office work for 19.9 percent and overflow or legacy accounts receivable projects for 9.2 percent. We report the median for each arrangement separately because the three are priced against very different pools of dollars.
| Quarter | Full outsourcing | Extended business office | Overflow & legacy AR | All engagements |
|---|---|---|---|---|
| Q4 2024 | 5.3% | 8.1% | 11.4% | 6.4% |
| Q1 2025 | 5.2% | 8.0% | 11.3% | 6.3% |
| Q2 2025 | 5.3% | 8.1% | 11.4% | 6.4% |
| Q3 2025 | 5.0% | 7.8% | 11.1% | 6.1% |
| Q4 2025 | 4.9% | 7.7% | 11.0% | 6.0% |
| Q1 2026 | 4.7% | 7.5% | 10.8% | 5.8% |
| Q2 2026 | 4.6% | 7.3% | 10.6% | 5.7% |
| Q3 2026 | 4.4% | 7.1% | 10.4% | 5.5% |
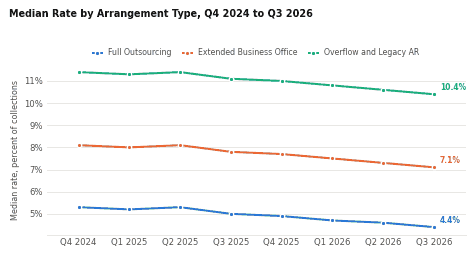
- We found that the blended median fell from 6.4 percent in the fourth quarter of 2024 to 5.5 percent in the third quarter of 2026, a decline of 0.9 points or 14.1 percent. The path wobbles instead of sliding cleanly: the second quarter of 2025 returned to the fourth quarter 2024 level of 6.4 percent before the decline resumed. Four of the seven quarter over quarter moves in the series were 0.1 points, which makes the compression steady rather than abrupt.
- Our data showed that full outsourcing absorbed the deepest cut in proportional terms, falling 0.9 points from 5.3 to 4.4 percent, or 17.0 percent of its starting rate. It is the scope most exposed to offshore labor arbitrage and to autonomous coding and claim status automation, and it is the scope large buyers put out to competitive bid most often.
- We observed that narrower arrangements held price better. Extended business office engagements fell 1.0 point from 8.1 to 7.1 percent, a 12.3 percent decline, and overflow or legacy accounts receivable projects fell 1.0 point from 11.4 to 10.4 percent, a decline of 8.8 percent. These arrangements are priced against aged and previously worked balances where recovery per touch is low, and that economics has proved more resistant to automation than clean claim processing.
Requesting a Copy of This Report
The full report is available as a PDF, along with the underlying dataset of 1,184 priced engagements broken out by specialty, collections band, pricing model and scope tier. Write to our research team to request either, and note which cuts you would like extended.
Sources
- RCM Outsourcing Pricing Study, Healthcare Industry Reviews, September 2026, New York, New York.
- Medical Billing Cost: 2026 Pricing Guide, Neolytix, July 2026, Chicago, Illinois. neolytix.com
- Medical Billing Cost Guide 2026: Percent of Collections, Per Claim and Hidden Fees, GetPracticeHelp, March 2026, United States. getpracticehelp.com
- HFMA Guide to Better Practices in Measuring Cost-to-Collect, Healthcare Financial Management Association, September 2025, Downers Grove, Illinois. hfma.org
- 49 Top-Rated RCM Vendors for 2026, Per Black Book, Becker's Hospital Review, June 2026, Chicago, Illinois. beckershospitalreview.com
- Operating Costs Keep Climbing for Medical Practices in 2026, Medical Group Management Association, June 2026, Englewood, Colorado. mgma.com
- Medical Billing Philippines Cost 2026: Outsourcing Rates and Comparison, RCM Staff, April 2026, United States. rcmstaff.com
HIR Research notes are editorial. No vendor paid for inclusion.