Report · Oct 2026
Health System Operating Margin Benchmarks: 2026 Report
Published · Updated
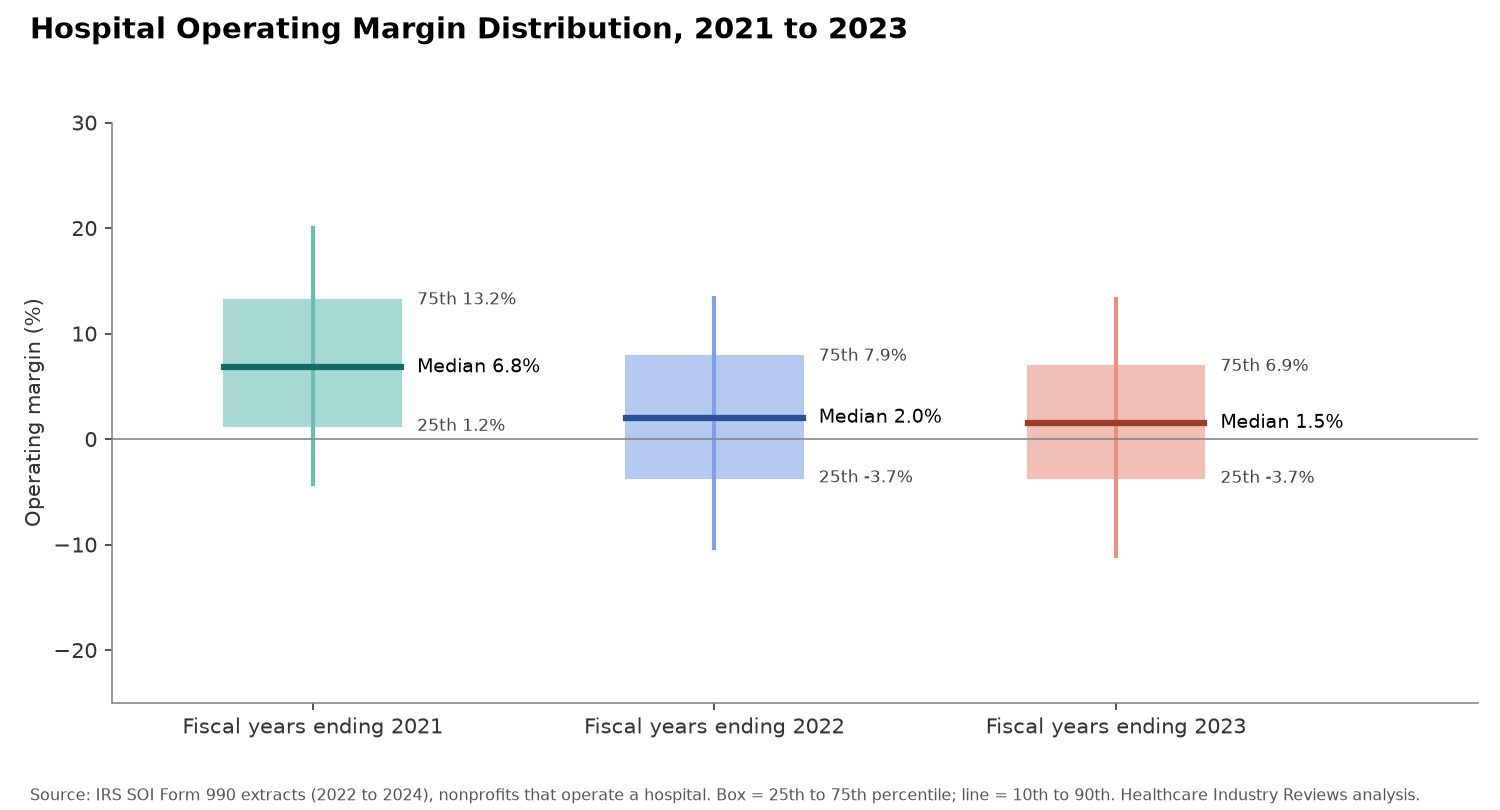
In fiscal 2021, the typical US nonprofit hospital kept 6.8% of its operating revenue after paying its expenses. Over the next two years that margin shrank, and far more hospitals began losing money on their operations, so we looked at how far margins fell and where.
Our analysts studied the finances of every US nonprofit that reported operating a hospital, using the Form 990 returns they file with the IRS for the three fiscal years through 2023. We measured each organization's operating margin before investment gains. By fiscal 2023, the median had fallen to 1.5%. Newer figures show margins are still thin: Kaufman Hall's national hospital median was 2.5% for 2026 through August, and Fitch's median for the nonprofit systems it rates was 1.5% in fiscal 2025.
In the following sections, we compare operating margins across the three years, set them beside total margins that include investment income, and break them down by organization size and for the 14 largest systems, then add the latest published medians for 2025 and 2026.
Health System Operating Margin Benchmarks by Year
Percentiles give a fuller benchmark than a single average, because hospital margins vary widely. We computed the 10th, 25th, 50th, 75th and 90th percentile margins for each year from the IRS's annual Form 990 extracts.
| Fiscal Year Ending | Organizations | 10th Percentile | 25th Percentile | Median | 75th Percentile | 90th Percentile | Share Below Zero |
|---|---|---|---|---|---|---|---|
| 2021 | 2,266 | -4.3% | 1.2% | 6.8% | 13.2% | 20.0% | 20.5% |
| 2022 | 2,270 | -10.3% | -3.7% | 2.0% | 7.9% | 13.3% | 39.3% |
| 2023 | 2,214 | -11.1% | -3.7% | 1.5% | 6.9% | 13.3% | 41.7% |
- The median operating margin fell from 6.8% in fiscal 2021 to 2.0% in fiscal 2022 and 1.5% in fiscal 2023.
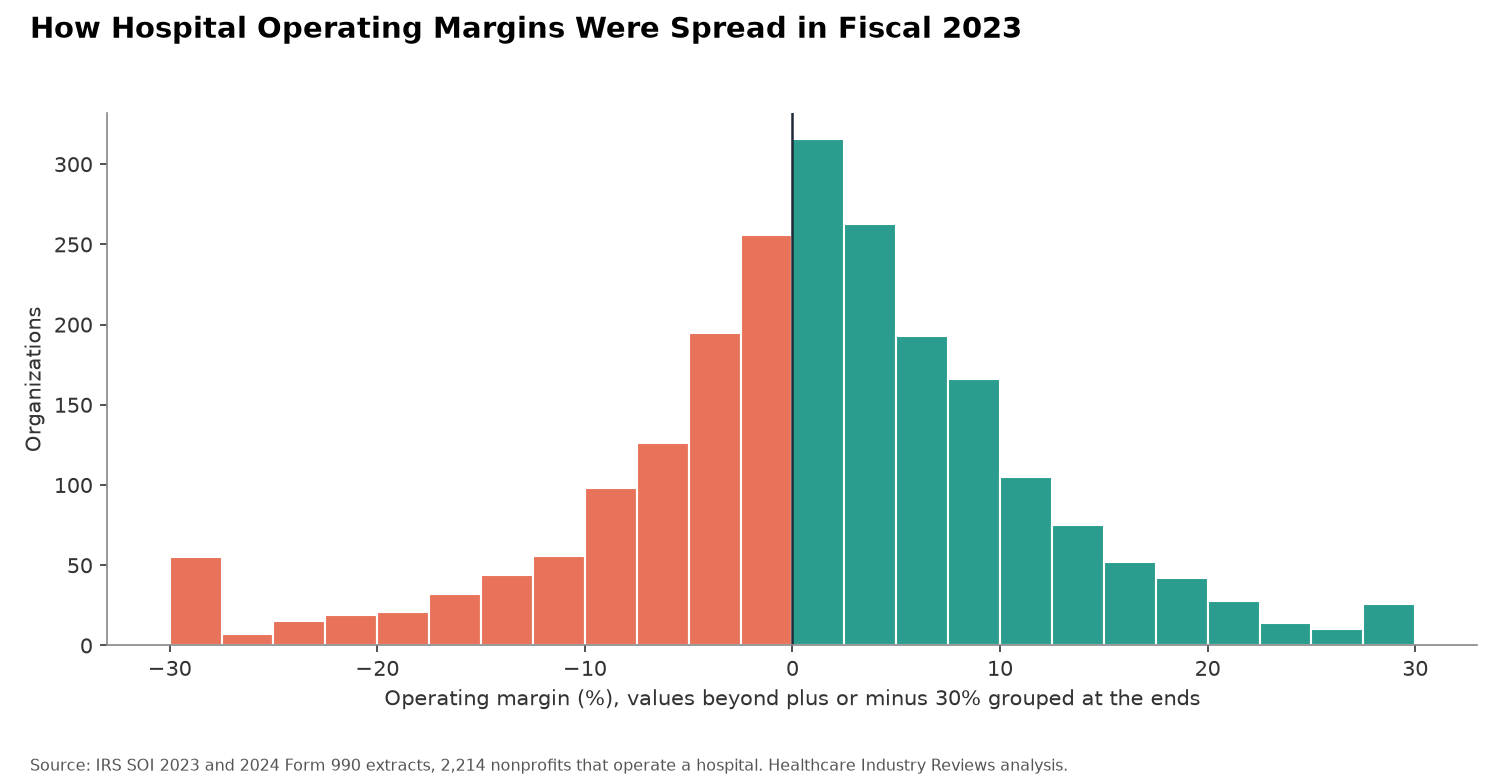
- The share of hospital organizations with negative operating margins doubled, from 20.5% to 41.7%.
- A top-quartile operating margin, the 75th percentile, was 6.9% in fiscal 2023, against 13.2% in fiscal 2021.
- Hospitals now have little room for a bad year. When the typical organization keeps so little of each operating dollar, a modest rise in wages or supply costs can turn a small profit into a loss. If margins stay this low, more hospitals may delay building projects or cut services.
Operating Margin vs Total Margin
Total margin counts investment income and gains on asset sales as revenue, so it runs higher than operating margin in most years.
| Fiscal Year Ending | Median Operating Margin | Median Total Margin | Combined Operating Margin, All Organizations | Combined Total Margin, All Organizations |
|---|---|---|---|---|
| 2021 | 6.8% | 8.6% | 5.2% | 8.3% |
| 2022 | 2.0% | 3.2% | 1.5% | 3.6% |
| 2023 | 1.5% | 2.5% | 2.1% | 3.8% |
- The median total margin was 2.5% in fiscal 2023, 1.0 percentage point above the median operating margin.
- Combined across all organizations, the operating margin rose to 2.1% in fiscal 2023 from 1.5% in fiscal 2022, while the median kept falling. That points to larger organizations recovering faster than the typical one.
- Investment income and gains on asset sales keep many hospitals' bottom lines positive. Those gains rise and fall with stock and bond markets, so a weak year for markets could push more hospitals into the red even if patient care results hold steady.
Operating Margin Benchmarks by Health System Size
Size changes what counts as a normal margin. The benchmarks below group organizations by operating revenue in fiscal 2023.
| Operating Revenue | Organizations | 25th Percentile | Median | 75th Percentile | Share Below Zero |
|---|---|---|---|---|---|
| Under $50M | 611 | -6.5% | 0.8% | 7.5% | 47.5% |
| $50M to $250M | 743 | -4.3% | 1.6% | 7.3% | 41.6% |
| $250M to $1B | 596 | -3.0% | 1.5% | 6.4% | 40.3% |
| $1B to $5B | 227 | -1.2% | 3.3% | 7.7% | 31.3% |
| $5B and up | 37 | -0.9% | 0.9% | 4.3% | 37.8% |
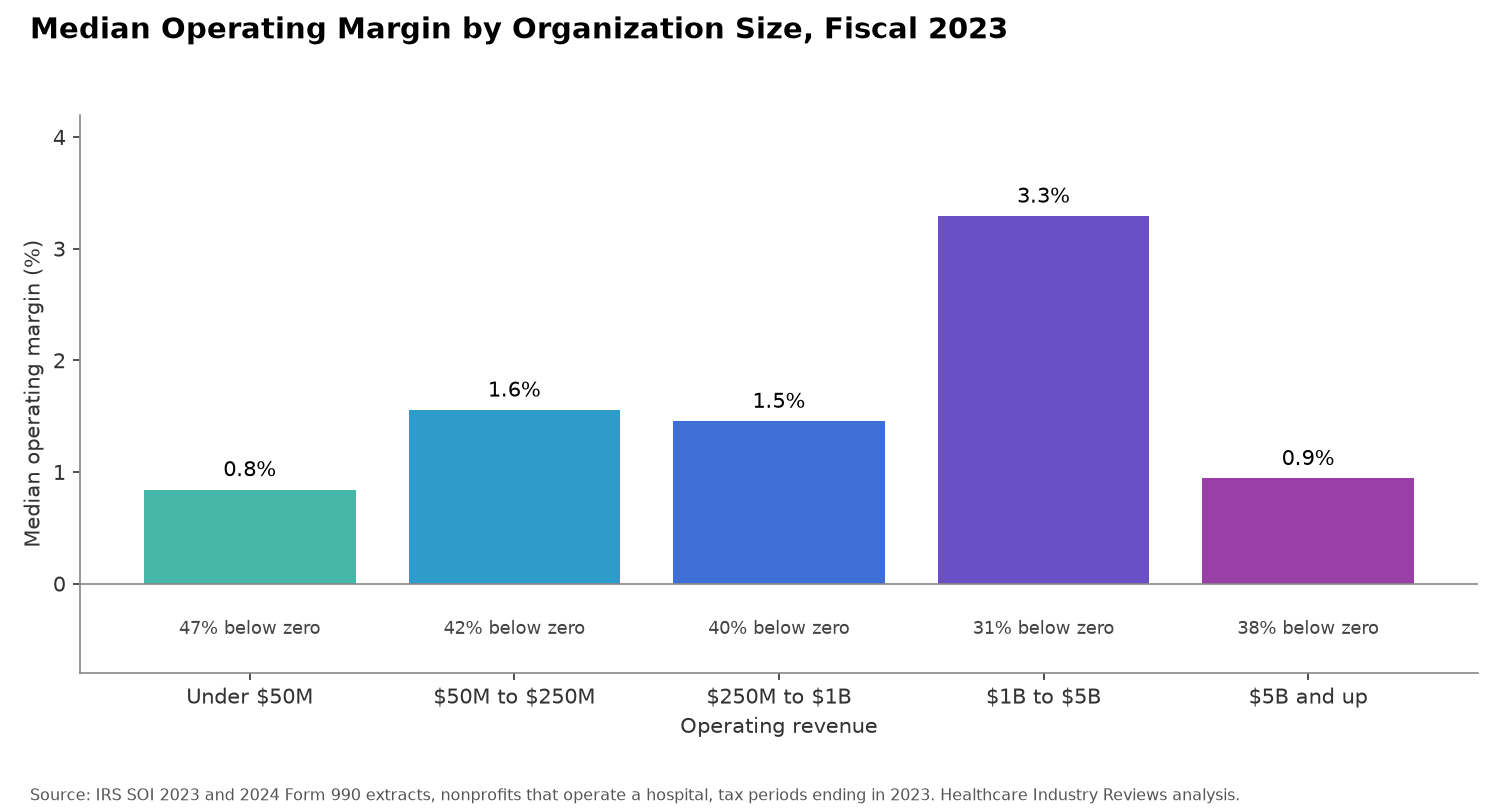
- Organizations with $1 billion to $5 billion in operating revenue had the highest median margin, 3.3%, and the lowest share below zero, 31.3%.
- Nearly half of the smallest organizations, those under $50 million, had negative operating margins.
- Losses reach every size group, including the biggest systems, so growing larger does not by itself fix a thin margin. Small hospitals have the least revenue to absorb a loss, and if losses continue, more of them may cut services or look for a larger partner.
Operating Margins at the Largest Health Systems
The largest filers are mostly parent organizations of major health systems. Their Form 990 results show how widely margins differ even at the top of the market.
| Organization | State | Tax Period End | Operating Revenue | Operating Margin | Total Margin |
|---|---|---|---|---|---|
| Kaiser Foundation Hospitals | CA | Dec. 2023 | $30.51B | -0.4% | 6.5% |
| Mass General Brigham and Affiliates (group return) | MA | Sept. 2023 | $22.55B | 4.3% | 5.1% |
| UPMC | PA | June 2023 | $22.51B | -0.7% | -0.5% |
| Cleveland Clinic Foundation | OH | Dec. 2023 | $15.43B | 4.3% | 5.3% |
| Mayo Clinic (group return) | MN | Dec. 2023 | $13.89B | 0.8% | 1.4% |
| Corewell Health | MI | Dec. 2023 | $10.31B | 0.7% | 1.4% |
| NewYork-Presbyterian Hospital | NY | Dec. 2023 | $9.95B | 2.0% | 4.9% |
| Providence Health & Services Washington | WA | Dec. 2023 | $9.64B | -5.0% | -3.5% |
| Dignity Health | CA | June 2023 | $9.64B | -5.1% | -2.1% |
| Banner Health | AZ | Dec. 2023 | $9.24B | 6.1% | 8.5% |
| IHC Health Services (Intermountain) | UT | Dec. 2023 | $9.23B | 4.7% | 8.8% |
| Northwestern Memorial HealthCare | IL | Aug. 2023 | $9.14B | 2.3% | 2.3% |
| NYU Langone Hospitals | NY | Aug. 2023 | $8.75B | 13.6% | 14.7% |
| Bon Secours Mercy Health | OH | Dec. 2023 | $8.53B | -5.5% | -3.4% |
- Five of the 14 posted negative operating margins: Kaiser Foundation Hospitals, UPMC, Providence, Dignity Health and Bon Secours Mercy Health.
- Kaiser Foundation Hospitals ran a -0.4% operating margin but a 6.5% total margin, the widest gap in the group, because of investment income and gains.
Hospital operating margins in 2025 and 2026
Form 990 data run two to three years behind, so the most recent figures come from monthly hospital data and rating agency medians. Each uses a different sample and definition from the Form 990 benchmarks above, so the direction of change is more comparable than the exact level.
| Source | Group measured | Period | Median operating margin | Earlier period |
|---|---|---|---|---|
| Kaufman Hall, including allocations | US hospitals, more than 1,300 in sample | January to August 2026 | 2.5% | 3.4% (full year 2025) |
| Kaufman Hall, without allocations | US hospitals, more than 1,300 in sample | January to August 2026 | 8.0% | 7.5% (full year 2025) |
| Kaufman Hall, including allocations | US hospitals, single month | August 2026 | 1.8% | 3.8% (July 2026) |
| Fitch Ratings | Nonprofit hospital systems rated by Fitch | Fiscal 2025 | 1.5% | 1.1% (fiscal 2024) |
| Moody's Ratings | 201 nonprofit and public hospitals and systems rated by Moody's | Fiscal 2025 | 1.2% | 1.3% (fiscal 2024) |
| Healthcare Industry Reviews | 2,214 nonprofits that operate a hospital, Form 990 | Fiscal 2023 | 1.5% | 2.0% (fiscal 2022) |
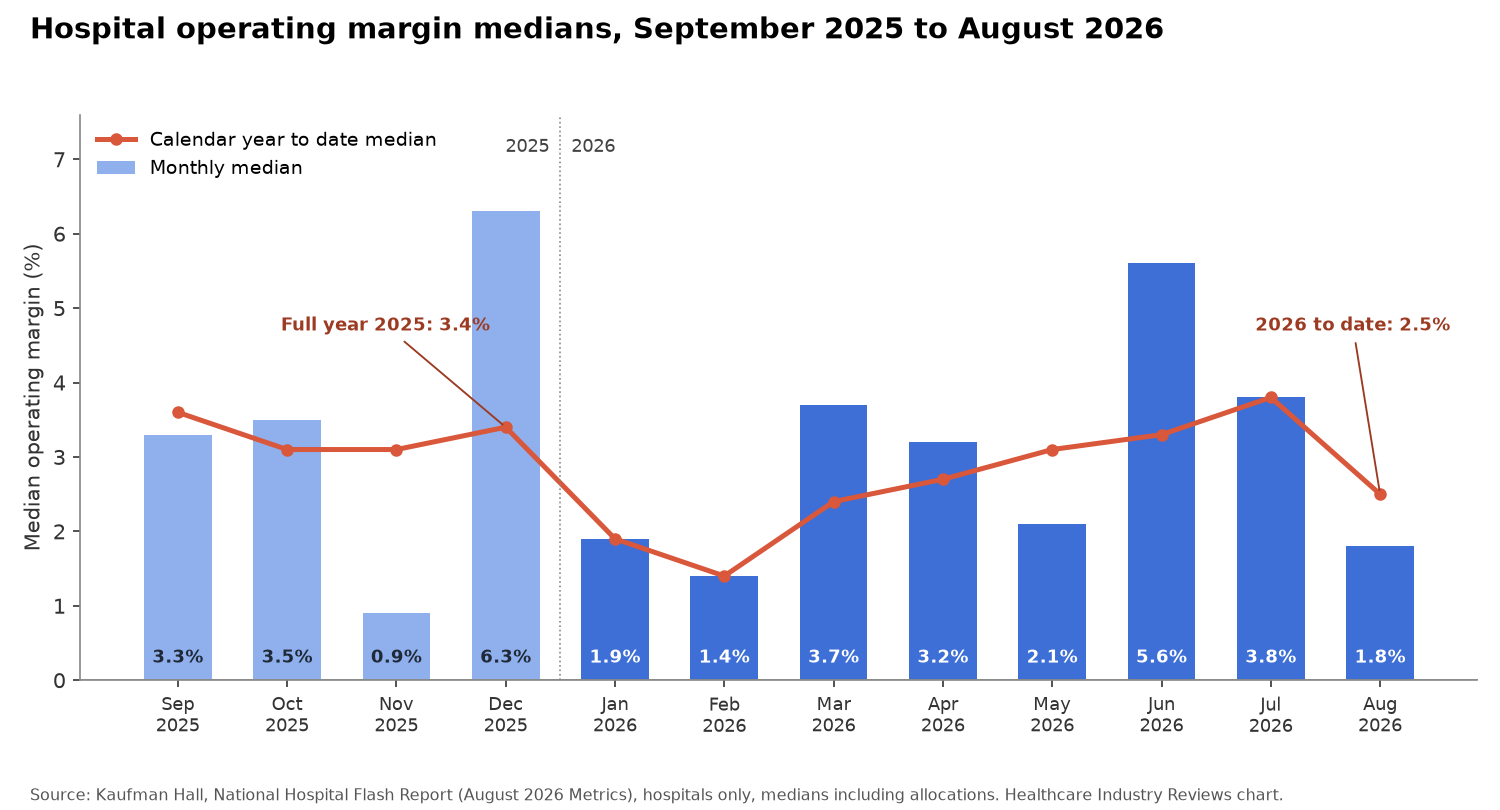
- The national hospital median was 2.5% for 2026 through August, below the 3.4% for all of 2025, on Kaufman Hall's measure that includes costs allocated from corporate offices and physician groups.
- The monthly median fell to 1.8% in August 2026 from 3.8% in July. Kaufman Hall puts about 43% of hospitals at an operating loss, against about 33% before the pandemic, close to the 41.7% of nonprofit hospital organizations below zero in our fiscal 2023 data.
- Fitch's median for rated nonprofit systems rose to 1.5% in fiscal 2025 from 1.1%, a third straight year of improvement, while Moody's median slipped to 1.2% from 1.3%.
The rating agency medians for fiscal 2025 sit close to the 1.5% Form 990 median for fiscal 2023. Margins for the typical hospital have stopped falling but have not returned to the 6.8% of fiscal 2021, a year helped by federal pandemic relief. Fitch keeps a neutral outlook for 2026 but warns that tighter Medicaid eligibility and funding rules could weaken hospitals' payer mix beginning in 2027.
What Health System Operating Margin Trends Mean for 2027 and Beyond
Thin margins leave hospitals with little room to absorb higher wages or supply costs. When money is short, a hospital may delay new buildings and equipment, close units that lose money or hold down hiring, and those choices shape what care is available nearby.
If margins stay this thin, more hospitals are likely to join larger systems or close services. Communities served by small hospitals that lose money could see their hospital change hands. Fiscal 2024 filings are not yet in the IRS bulk data, and they will show whether the decline has leveled off.
So if you rely on a small local hospital, follow news on its finances and any merger talks, because those decisions can change what care stays close to home.
Data Collection and Methodology
The benchmarks use tax filings, which follow different rules from audited hospital financial statements, so the definitions below matter when comparing them with other sources.
We downloaded the IRS Statistics of Income annual extracts of Form 990 data for 2022, 2023 and 2024 and kept every organization that answered yes to Part IV, line 20a, which asks whether it operates one or more hospitals. Each organization was assigned to the year in which its tax period ended, with one return per organization per year. Organizations with less than $1 million in total revenue were left out. The final set has 6,750 returns from 2,347 organizations: 2,266 for fiscal 2021, 2,270 for fiscal 2022 and 2,214 for fiscal 2023. Operating revenue is total revenue (Part I, line 12) minus investment income, income from investment of tax-exempt bond proceeds and net gains or losses on sales of assets. Operating margin is operating revenue minus total functional expenses, divided by operating revenue. Total margin is total revenue minus total expenses, divided by total revenue, which is the Form 990's own revenue-less-expenses line (Part I, line 19) as a share of revenue. Percentiles were computed from unrounded margins.
Form 990 figures are reported by filing entity. A health system may file one group return, several returns for separate hospitals or a parent return alongside hospital returns, so the set mixes systems and single hospitals and some dollars can appear in more than one return. Contributions and government grants, which include federal pandemic relief payments in 2021, count as operating revenue here. Margins can differ from those in a system's audited statements and bond disclosures on the MSRB's EMMA site, which use accounting rules for nonprofit health care and often classify items differently. For-profit and government hospitals do not file Form 990 and are not included. The Trustees of the University of Pennsylvania, whose return covers the university and its health system together, are left out of the largest-system table. The 2024 extract is the most recent the IRS has published, so fiscal 2024 and 2025 results are not yet in the data.
The 2025 and 2026 figures come from published reports, not from the Form 990 data. Kaufman Hall's National Hospital Flash Report gives national medians for hospitals only, from monthly data on more than 1,300 hospitals, with and without costs allocated to hospitals from corporate, physician and other entities. Kaufman Hall updated that allocation adjustment in 2026, so its figures can differ from earlier editions of the report; the figures here are from the August 2026 edition. Fitch and Moody's medians cover fiscal 2025 results for only the organizations each agency rates.
Sources
- Healthcare Industry Reviews, Health System Operating Margin Study: analysis of 6,750 Form 990 returns from nonprofits that operate a hospital, tax periods ending in 2021 to 2023, from IRS Statistics of Income extracts, conducted October 2026.
- IRS, SOI Tax Stats: Annual Extract of Tax-Exempt Organization Financial Data
- IRS, 2024 Form 990 extract
- IRS, 2023 Form 990 extract
- IRS, 2022 Form 990 extract
- IRS, Instructions for Form 990 (Part IV, line 20, and Part I, lines 12 and 19)
- ProPublica Nonprofit Explorer API (organization names for the largest filers)
- MSRB, Electronic Municipal Market Access (EMMA)
- Kaufman Hall, National Hospital Flash Report: August 2026 Data (published Oct. 13, 2026)
- Fitch Ratings, U.S. Not-for-Profit Hospitals See Median Improvement Amid Growing Uncertainty (Aug. 4, 2026)
- Fitch Ratings, U.S. NFP Hospitals' Outlook Neutral as Margins Rebound, Balance Sheets Remain Strong (Dec. 8, 2025)
- Moody's Ratings, Not-for-Profit and Public Healthcare, US: Medians, Profitability softened modestly (August 2026, subscription)
- Chartis, summary of Moody's fiscal 2025 medians for 201 organizations (Aug. 21, 2026)