Report · Oct 2026
Hospital AI Adoption Statistics: 2026 Report
Published
Our analysts compiled two federal analyses of the American Hospital Association (AHA) Information Technology Supplement, a national survey of hospital IT, covering predictive AI answers from 2,425 hospitals in 2023 and 2,080 in 2024 and generative AI answers from 2,174 hospitals in 2024. Together they show which US hospitals had built AI into their electronic health records (EHRs) by 2024, what they used it for, and which kinds of hospitals lagged behind.
Key Findings
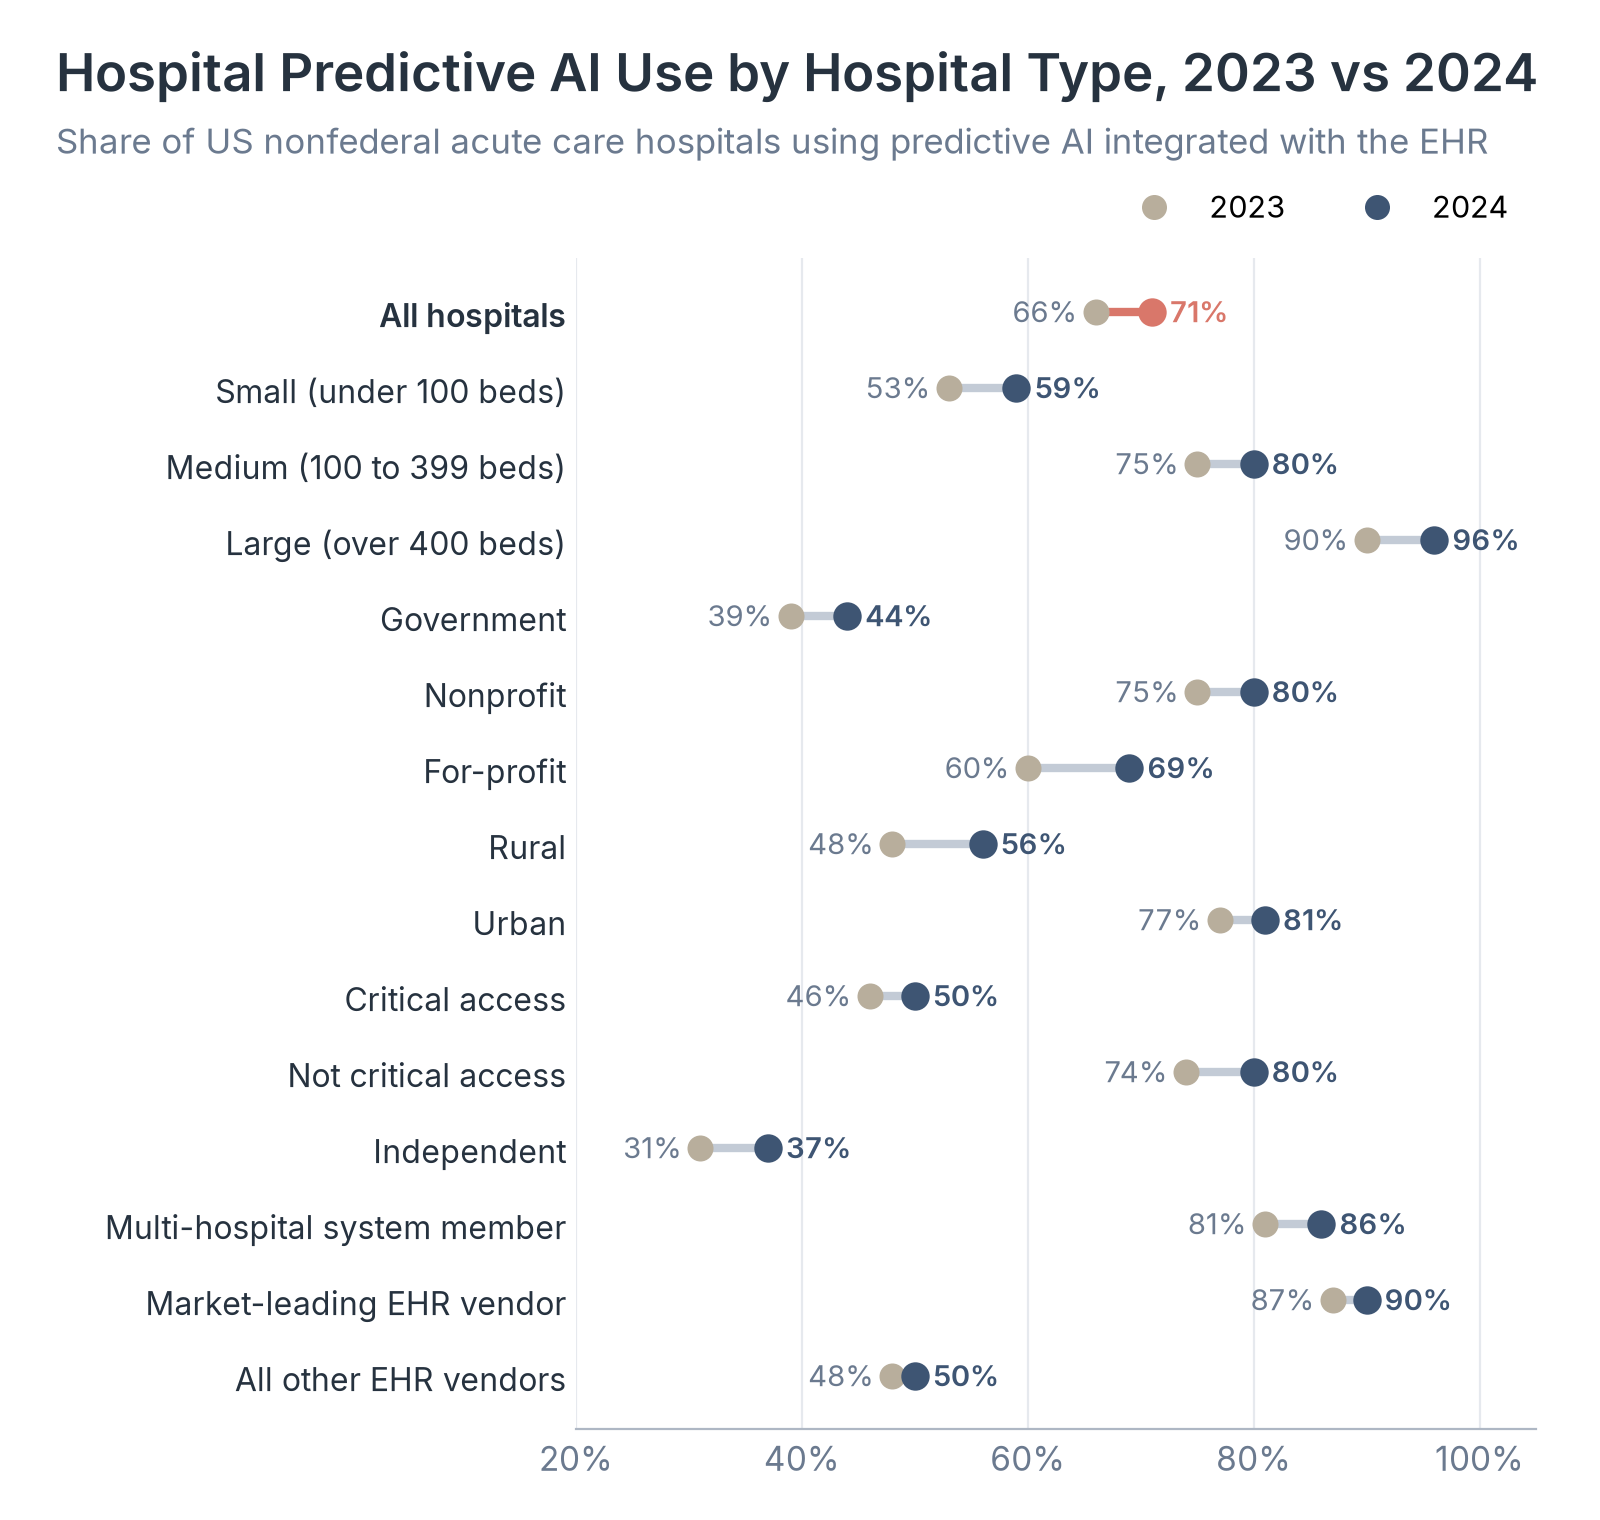
- 71% of US nonfederal acute care hospitals used predictive AI integrated with their EHR in 2024, up from 66% in 2023.
- 31.5% of hospitals used generative AI integrated with their EHR in 2024, and another 24.7% planned to start within a year.
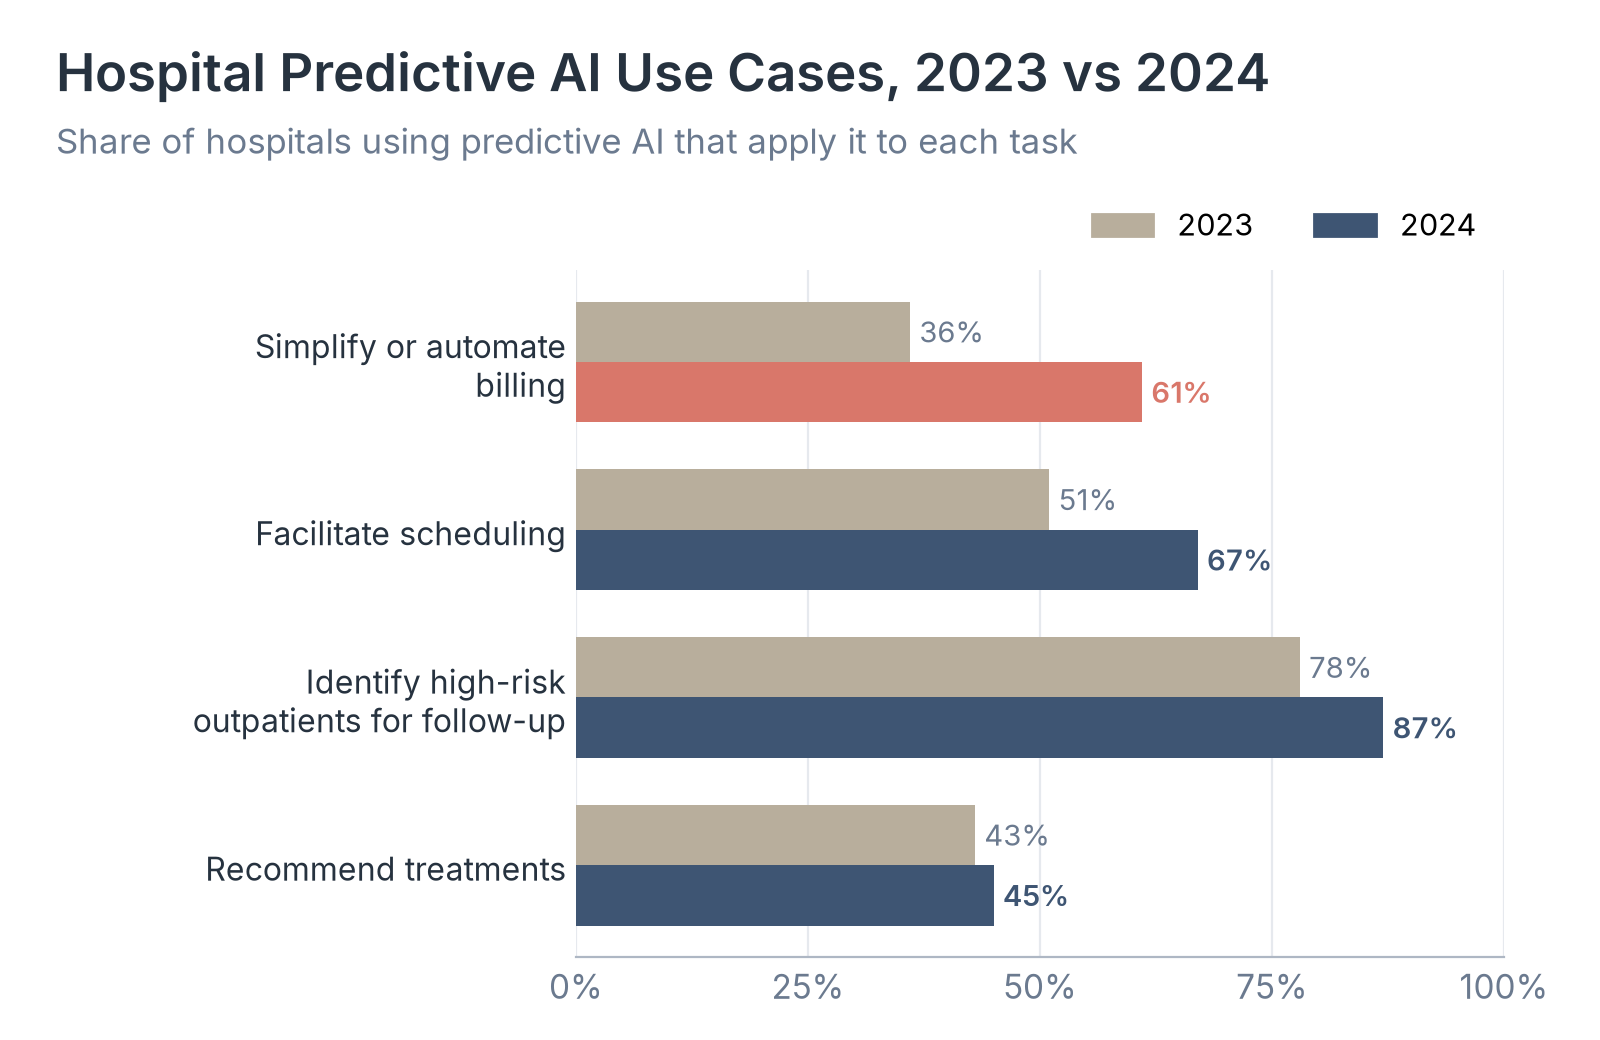
- Among hospitals using predictive AI, the share applying it to billing rose from 36% in 2023 to 61% in 2024.
- 86% of hospitals in multi-hospital systems used predictive AI in 2024, compared with 37% of independent hospitals.
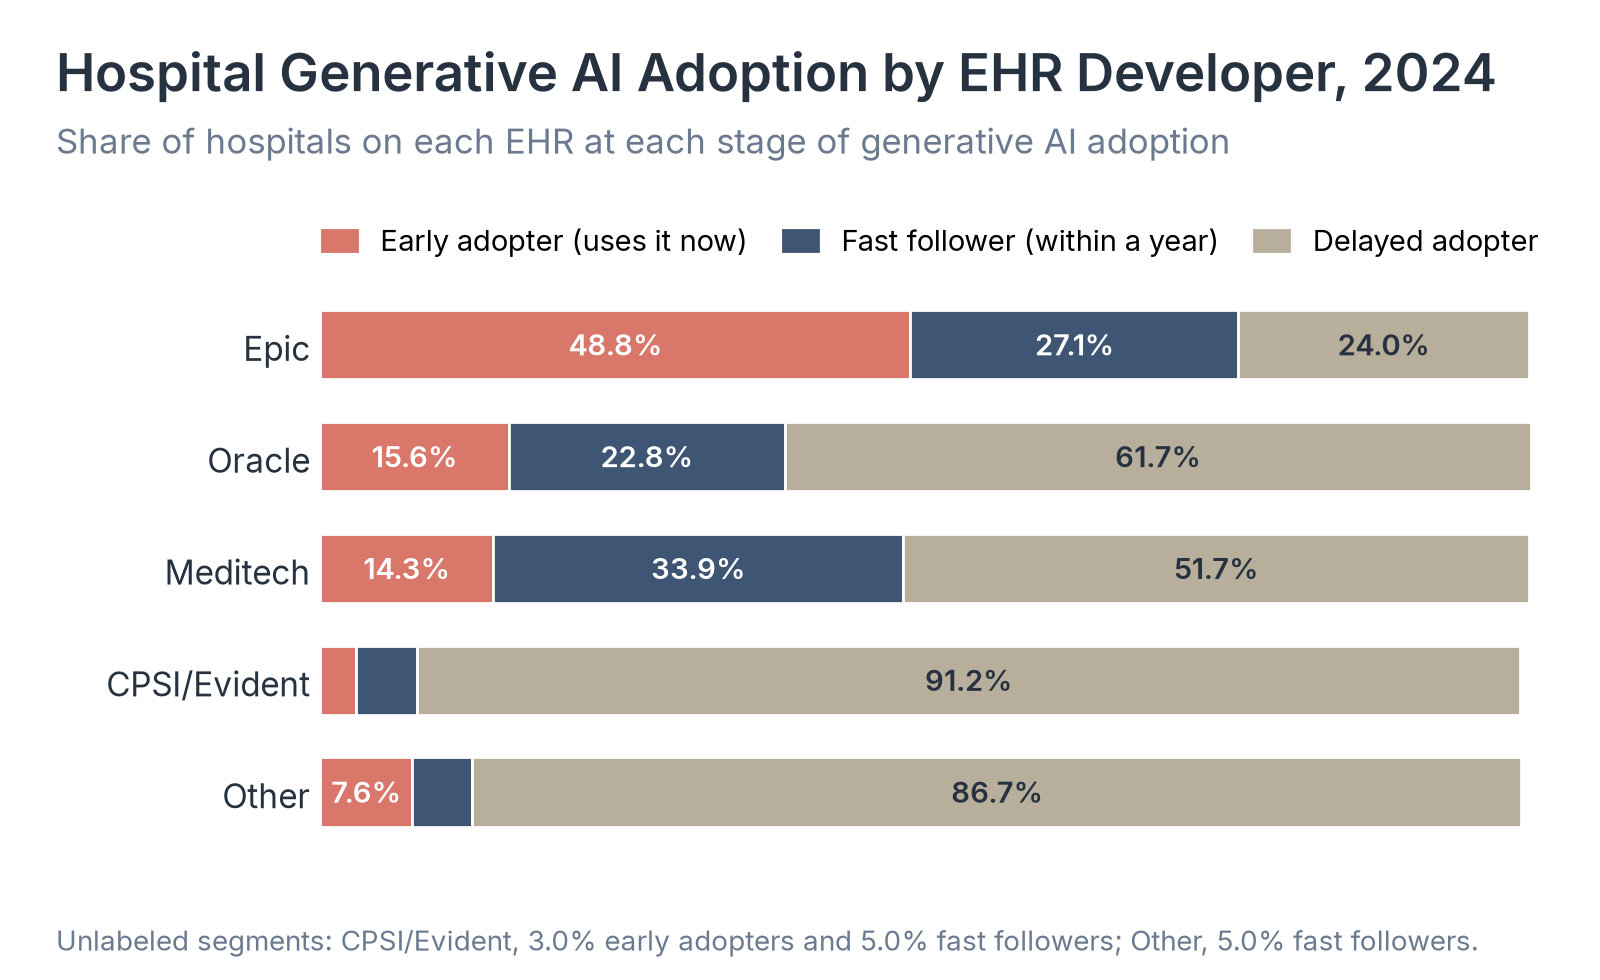
- 48.8% of hospitals on Epic were using generative AI in 2024, compared with 15.6% on Oracle and 14.3% on Meditech.
Hospitals have used software that predicts patient risk for decades, such as tools that flag a patient likely to develop sepsis, fall, or be readmitted after discharge. Much of that software now comes built into the hospital's EHR. Since late 2022, generative AI, which writes text such as draft patient messages and visit notes from ambient scribes, has joined it. Researchers at the Assistant Secretary for Technology Policy (ASTP), part of the Department of Health and Human Services, follow both through questions in the AHA's hospital IT survey, and their results show AI use rising quickly. But the rise has not reached every hospital equally.
We took predictive AI figures from ASTP Data Brief 80, published in September 2025, which covers use, use cases, model sources, evaluation, and oversight in 2023 and 2024. Generative AI figures come from a JAMA Network Open study by researchers at ASTP and the University of Minnesota, published December 12, 2025, which covers 2024. We set the two side by side by hospital type and calculated the gaps between groups.
In the following sections, we compare predictive AI use by hospital type, look at what hospitals use it for and who builds their models, show how hospitals check and oversee those models, break down generative AI adoption by EHR developer and hospital finances, and set predictive and generative AI side by side for each type of hospital.
Predictive AI Use by Hospital Size, Ownership, Location, and EHR Vendor
A national average can hide wide differences between a small rural hospital and a large health system. ASTP reports predictive AI use for each major hospital group in both survey years, and comparing them shows where adoption has spread fastest and where it lags.
| Hospital group | Hospitals in 2024 sample | 2023 | 2024 | Change, 2023 to 2024 |
|---|---|---|---|---|
| All hospitals | 2,080 | 66% | 71% | +5 points |
| Small (under 100 beds) | 951 | 53% | 59% | +6 points |
| Medium (100 to 399 beds) | 845 | 75% | 80% | +5 points |
| Large (over 400 beds) | 284 | 90% | 96% | +6 points |
| Government | 355 | 39% | 44% | +5 points |
| Nonprofit | 1,503 | 75% | 80% | +5 points |
| For-profit | 222 | 60% | 69% | +9 points |
| Rural | 751 | 48% | 56% | +8 points |
| Urban | 1,329 | 77% | 81% | +4 points |
| Critical access | 559 | 46% | 50% | +4 points |
| Not critical access | 1,521 | 74% | 80% | +6 points |
| Independent | 460 | 31% | 37% | +6 points |
| Multi-hospital system member | 1,620 | 81% | 86% | +5 points |
| Market-leading EHR vendor | 1,197 | 87% | 90% | +3 points |
| All other EHR vendors | 883 | 48% | 50% | +2 points |
Source: Assistant Secretary for Technology Policy (ASTP), Hospital Trends in the Use, Evaluation, and Governance of Predictive AI, 2023-2024, Data Brief 80, September 2025 (Table 1 and Figure 1).
Source: Healthcare Industry Reviews analysis of ASTP Data Brief 80 (Table 1 and Figure 1).
Key Findings
- Independent hospitals had the lowest rate of any group in both years and gained 6 points. Government-owned hospitals were next lowest, at 39% in 2023 and 44% in 2024.
- For-profit hospitals posted the largest gain, 9 points, to 69%. Hospitals on EHRs other than the market leader gained 2 points, so their gap with hospitals on the market-leading vendor widened from 39 points to 40.
- ASTP describes these gaps as a persistent digital divide. Small, rural, independent, and critical access hospitals all gained in 2024 but stayed at least 21 points behind their larger, urban, system-member, and non-critical access counterparts. The rural gap narrowed by 4 points in a year, from 29 to 25, so at that pace the gap would take about six more years to close.
What Hospitals Use Predictive AI For and Who Builds the Models
Knowing that a hospital uses predictive AI says little about the work the software does there. ASTP also asked hospitals that use it which tasks they apply it to and who developed their models, which shows how much of this market goes to EHR developers and how much to outside companies.
| Use case | 2023 | 2024 | Change, 2023 to 2024 |
|---|---|---|---|
| Simplify or automate billing | 36% | 61% | +25 points |
| Facilitate scheduling | 51% | 67% | +16 points |
| Identify high-risk outpatients to inform follow-up care | 78% | 87% | +9 points |
| Recommend treatments | 43% | 45% | +2 points |
| Predict health trajectories or risks for inpatients | 92% | Not labeled | Stable, per ASTP |
Source: Assistant Secretary for Technology Policy (ASTP), Hospital Trends in the Use, Evaluation, and Governance of Predictive AI, 2023-2024, Data Brief 80, September 2025 (Figure 2). Shares of hospitals that used any predictive AI (1,696 in 2023 and 1,587 in 2024).
| Model developer | 2023 | 2024 | Change, 2023 to 2024 |
|---|---|---|---|
| EHR developer | 79% | 80% | +1 point |
| Third-party developer | 59% | 52% | -7 points |
| Self-developed | 54% | 50% | -4 points |
Source: Assistant Secretary for Technology Policy (ASTP), Hospital Trends in the Use, Evaluation, and Governance of Predictive AI, 2023-2024, Data Brief 80, September 2025 (Appendix Figure A1). Hospitals could report more than one source.
Source: Healthcare Industry Reviews analysis of ASTP Data Brief 80 (Figure 2).
Key Findings
- Scheduling grew 16 points, to 67%, second only to billing. Clinical uses stayed the most common: 92% of hospitals using predictive AI applied it to inpatient risks in 2023, and 87% used it to flag high-risk outpatients in 2024.
- Hospitals that used only third-party or self-developed models applied them to billing more often than hospitals using EHR-developer AI, 73% against 58% in 2024.
- Use of EHR-developer models held at 80% while use of third-party and self-developed models fell 7 and 4 points, to 52% and 50%. ASTP reads the growth in administrative uses as a sign of an active, competitive market for billing and scheduling tools, in which hospitals are not tied to what their EHR developer offers.
How Hospitals Evaluate and Oversee Predictive AI
A model trained and tested elsewhere can perform differently on a hospital's own patients, which is why researchers recommend that hospitals check AI against their own patients' data. ASTP asked hospitals using predictive AI whether they had done those checks and who is responsible for them.
| Evaluation | Any models, 2023 | Any models, 2024 | All or most models, 2023 | All or most models, 2024 | Did not know, 2024 |
|---|---|---|---|---|---|
| Model accuracy | 80% | 82% | 63% | 71% | 15% |
| Model bias | 73% | 74% | 44% | 57% | 21% |
| Post-implementation evaluation or monitoring | Not asked | 79% | Not asked | 58% | 18% |
Source: Assistant Secretary for Technology Policy (ASTP), Hospital Trends in the Use, Evaluation, and Governance of Predictive AI, 2023-2024, Data Brief 80, September 2025 (Figure 3). Shares of hospitals that used any predictive AI. Post-implementation monitoring was first asked in 2024.
| Accountable group | Share of hospitals |
|---|---|
| Multiple groups | 74% |
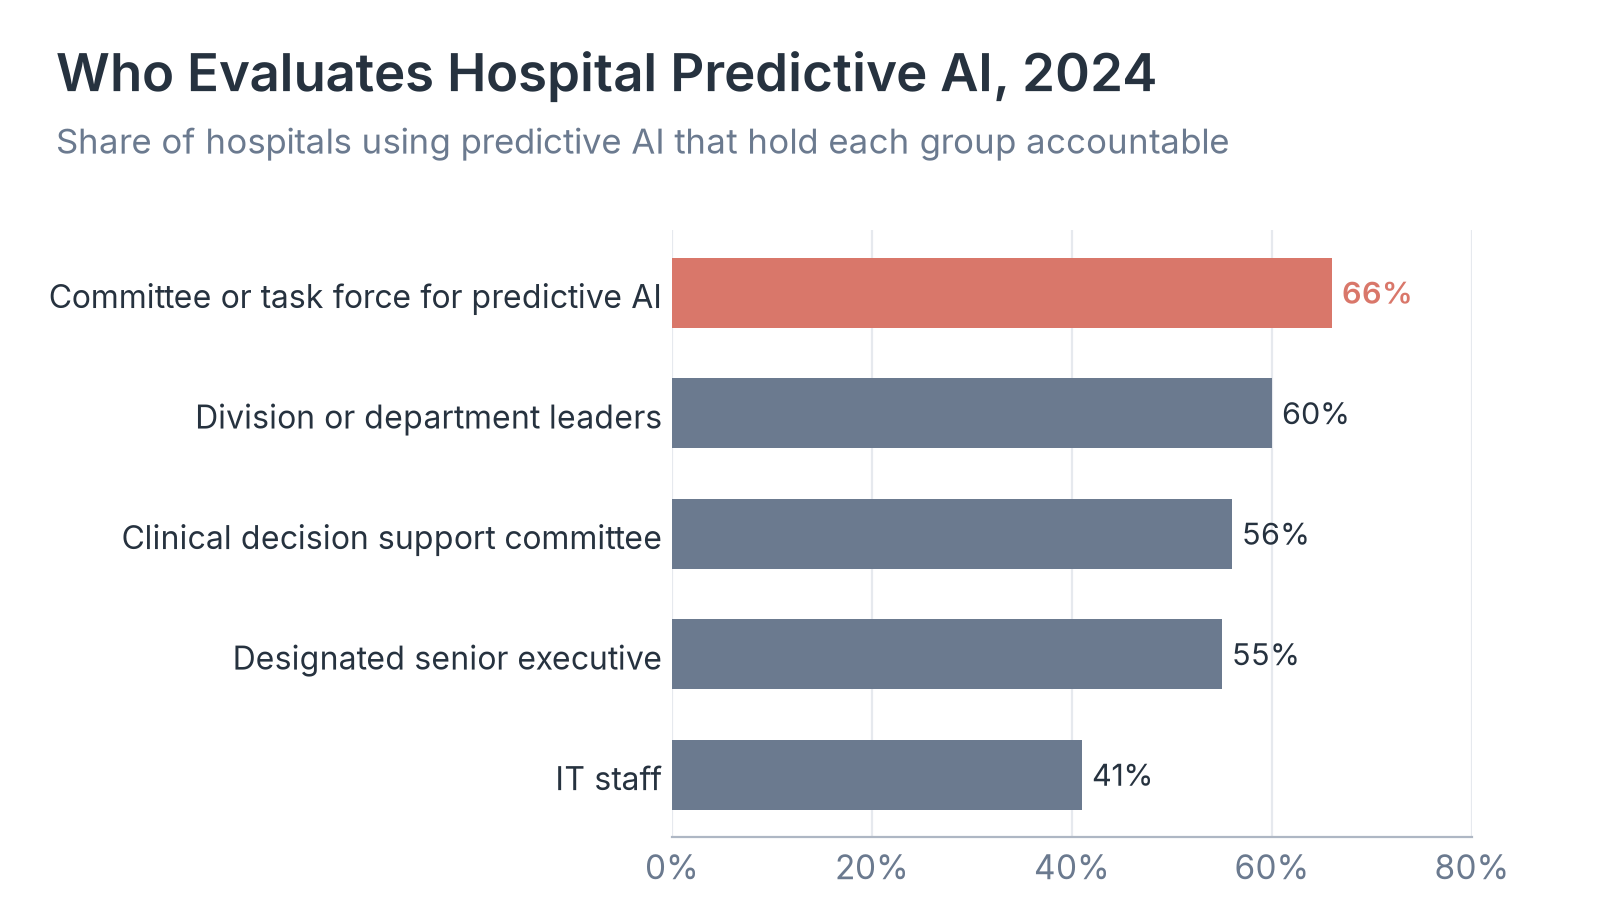
| Committee or task force for predictive AI | 66% |
| Division or department leaders | 60% |
| Clinical decision support committee | 56% |
| Designated senior executive (CMIO, CIO, or director of technology) | 55% |
| IT staff | 41% |
| None of the above | 3% |
Source: Assistant Secretary for Technology Policy (ASTP), Hospital Trends in the Use, Evaluation, and Governance of Predictive AI, 2023-2024, Data Brief 80, September 2025 (Figure 4). Hospitals could report more than one group.
Source: Healthcare Industry Reviews analysis of ASTP Data Brief 80 (Figure 4).
Key Findings
- The share of hospitals that checked all or most of their models for bias rose 13 points, to 57%, and for accuracy 8 points, to 71%. The share checking any of their models barely changed.
- A quarter of hospitals held four groups accountable for evaluation. In 2024, 21% of hospitals using predictive AI did not know whether their models had been checked for bias.
- In the JAMA Network Open study's 2024 sample, 46.7% of hospitals reported all three evaluation practices for most or all of their models and 32.6% reported none. The study's authors warn that some hospitals adopting generative AI may not be well equipped to take part in governing it.
Generative AI Adoption by EHR Developer, Teaching Status, and Finances
Generative AI reached hospitals more recently, so the JAMA Network Open study sorted hospitals by how far along they were in 2024: early adopters already using it with their EHR, fast followers planning to start within a year, and delayed adopters with later plans or none, including respondents who did not know. We broke those groups down by the hospital's EHR developer and by its teaching role and finances.
| EHR developer | Share of hospitals | Early adopters | Fast followers | Delayed adopters |
|---|---|---|---|---|
| Epic | 52.3% | 48.8% | 27.1% | 24.0% |
| Oracle | 19.9% | 15.6% | 22.8% | 61.7% |
| Meditech | 15.8% | 14.3% | 33.9% | 51.7% |
| CPSI/Evident | 6.6% | 3.0% | 5.0% | 91.2% |
| Other | 5.4% | 7.6% | 5.0% | 86.7% |
| All hospitals | 100% | 31.5% | 24.7% | 43.7% |
Source: Everson, Nong, and Richwine, Uptake of Generative AI Integrated With Electronic Health Records in US Hospitals, JAMA Network Open, December 12, 2025 (Table 1). Weighted shares of 2,174 nonfederal acute care hospitals.
| Hospital group | Early adopters | Fast followers | Delayed adopters |
|---|---|---|---|
| Nonteaching | 25.9% | 20.0% | 54.1% |
| Minor teaching | 35.0% | 30.2% | 34.8% |
| Major teaching | 53.9% | 25.9% | 20.2% |
| Operating margin, bottom 80% | 30.7% | 21.2% | 48.2% |
| Operating margin, top 20% | 34.9% | 38.8% | 26.3% |
| Medicaid share of discharges, bottom 80% | 33.3% | 24.1% | 42.5% |
| Medicaid share of discharges, top 20% | 24.4% | 27.1% | 48.6% |
Source: Everson, Nong, and Richwine, Uptake of Generative AI Integrated With Electronic Health Records in US Hospitals, JAMA Network Open, December 12, 2025 (Table 1). Operating margin and Medicaid groups split hospitals at the 80th percentile.
Source: Healthcare Industry Reviews analysis of Everson, Nong, and Richwine, JAMA Network Open (Table 1).
Key Findings
- Epic hospitals made up 52.3% of the sample, and only 24.0% of them were delayed adopters. Among CPSI/Evident hospitals, 91.2% were delayed adopters.
- 53.9% of major teaching hospitals were early adopters, about double the 25.9% of nonteaching hospitals. Hospitals in the top 20% for operating margin were more likely to be fast followers, at 38.8%, than other hospitals, at 21.2%.
- After controlling for size, teaching status, and other traits, Epic hospitals were still 21.9 points more likely than Oracle hospitals to be early adopters or fast followers. The authors conclude that hospitals may be relying on their EHR systems to bring in AI, and they note that a handful of EHR developers may have substantial ability to influence competition among health AI companies.
Predictive and Generative AI Gaps Between Hospital Types
Both federal analyses report results for the same kinds of hospitals. Putting them in one table shows whether the hospitals that trail on predictive AI also trail on generative AI, and by how much.
| Hospital type | Predictive AI | Generative AI, early adopters | Generative AI, early adopters and fast followers |
|---|---|---|---|
| Small | 59% | 26.8% | 45.6% |
| Medium | 80% | 34.4% | 64.5% |
| Large | 96% | 42.4% | 75.2% |
| Nonprofit | 80% | 41.1% | 61.9% |
| Government | 44% | 16.9% | 36.5% |
| For-profit | 69% | 6.5% | 57.9% |
| Urban | 81% | 35.5% | 64.4% |
| Rural | 56% | 25.4% | 43.6% |
| Not critical access | 80% | 34.7% | 63.2% |
| Critical access | 50% | 24.0% | 39.9% |
| System member | 86% | 38.5% | 67.7% |
| Independent | 37% | 16.3% | 31.3% |
Source: Healthcare Industry Reviews analysis of ASTP Data Brief 80 (Table 1) and Everson, Nong, and Richwine, JAMA Network Open (Table 1).
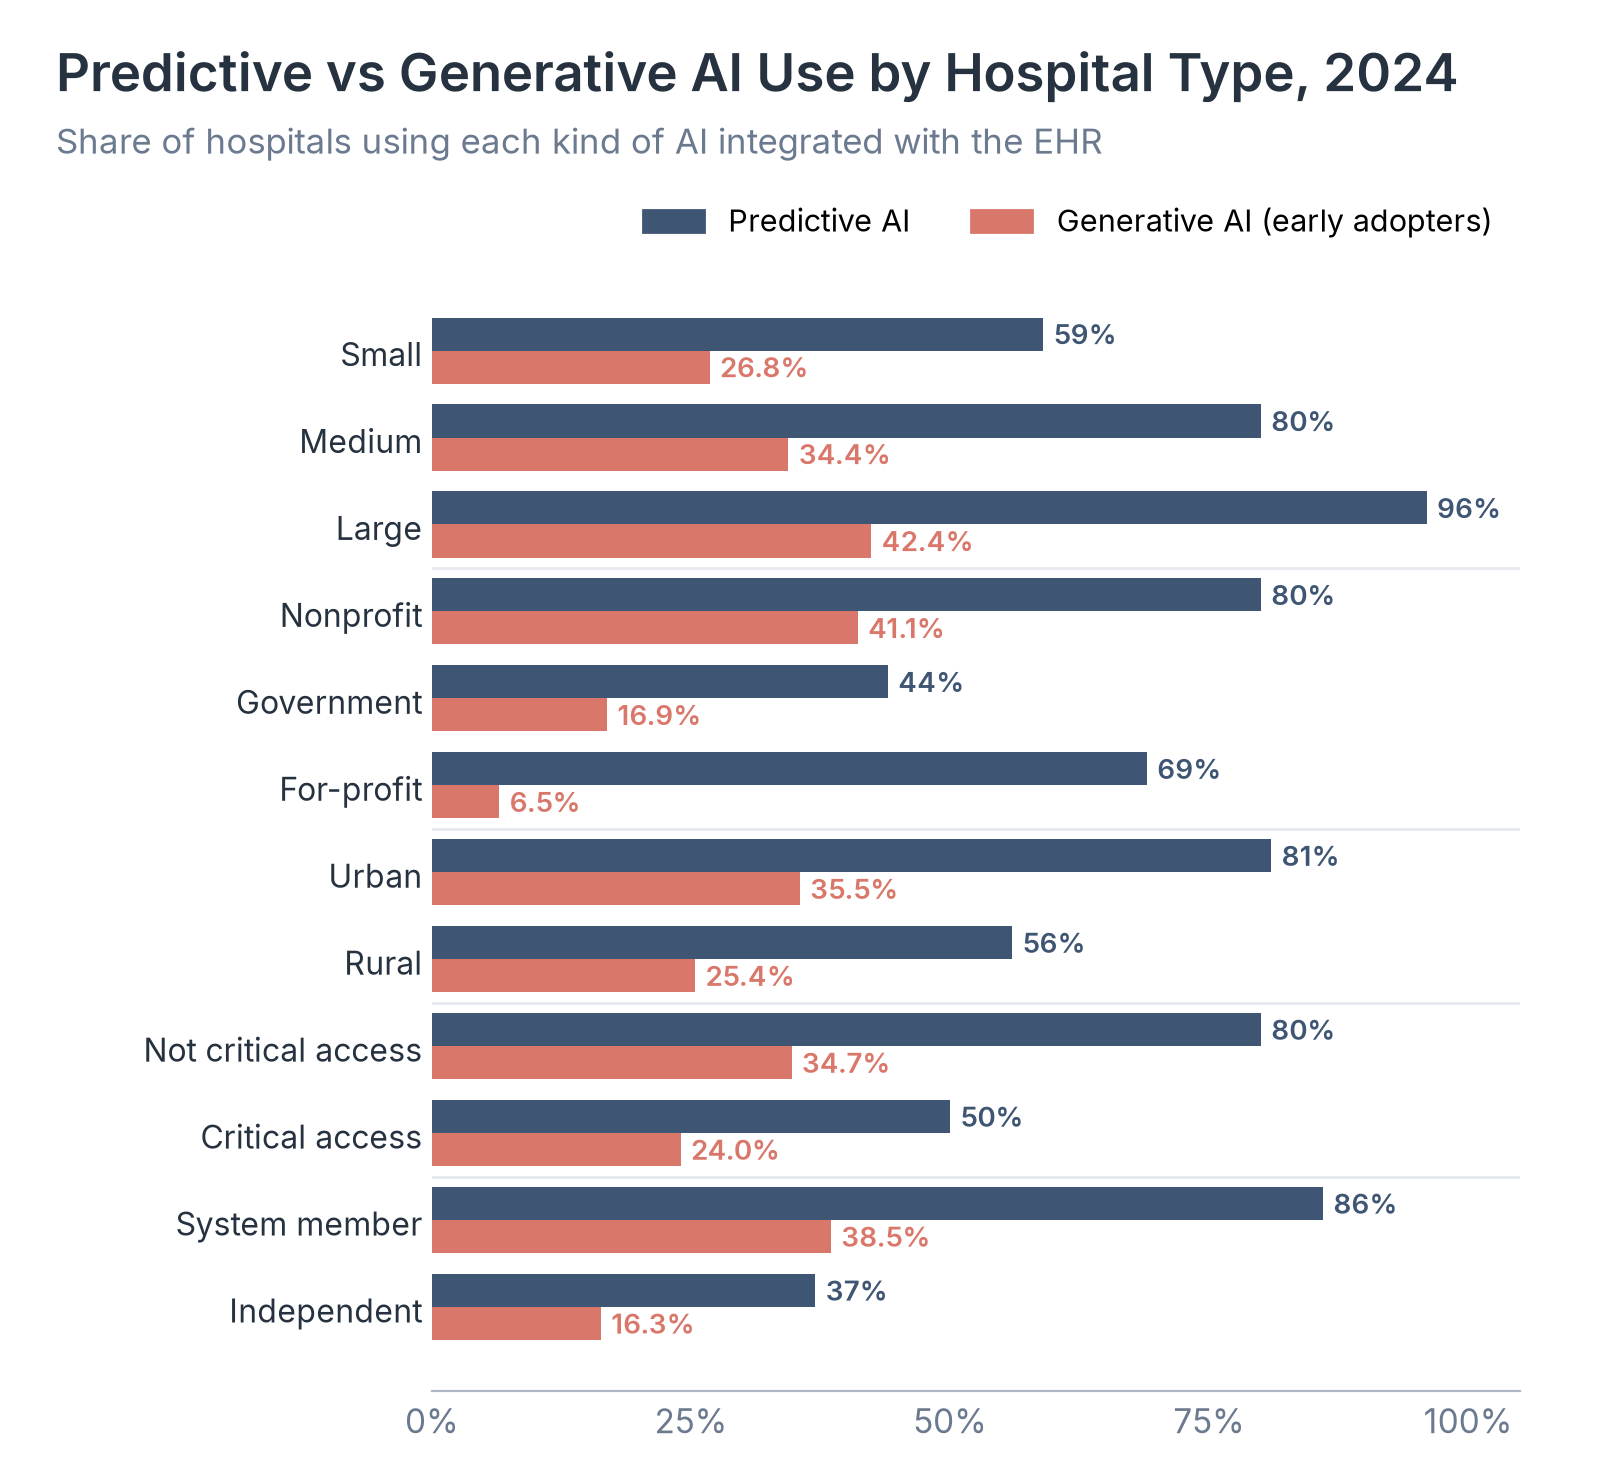
Source: Healthcare Industry Reviews analysis of ASTP Data Brief 80 (Table 1) and Everson, Nong, and Richwine, JAMA Network Open (Table 1).
Key Findings
- On generative AI, independent hospitals trailed system members by 22.2 points in early adoption, less than half their 49-point gap on predictive AI. Large hospitals led small ones by 15.6 points, against 37 points on predictive AI.
- For-profit hospitals had the lowest generative AI early adoption of any hospital type, 6.5%, but 51.4% planned to start within a year, the highest fast-follower share of any hospital type in the study.
- Every type that trailed on predictive AI also trailed on generative AI, and in most pairs the generative AI gap was smaller in points, with for-profit hospitals the exception. Hospitals that used machine learning models in their EHR were 26.2 points more likely to be early adopters or fast followers than hospitals with no predictive AI, and the JAMA authors write that the divide seen with predictive AI may be repeated with generative AI.
What Hospital AI Adoption Statistics Mean for 2026 and Beyond
For patients, these figures mean the software behind their care depends heavily on where they are treated. A large hospital in a health system is very likely to run risk prediction tools and to have generative AI in use or planned, while a small independent or critical access hospital often has neither.
The JAMA Network Open authors projected that more than half of US hospitals would use generative AI with their EHR by the end of 2025. How quickly smaller, rural, and independent hospitals follow will decide whether that spread narrows the gaps shown here or widens them.
So if you are comparing your hospital with its peers, measure against hospitals of the same size, ownership, and EHR vendor, because the national average hides gaps of 40 points or more between some hospital groups.
Data Collection and Methodology
We compiled published results from two federal analyses of the AHA Information Technology Supplement, which the AHA sends to the chief executives of all US hospitals alongside its Annual Survey.
Predictive AI figures come from ASTP Data Brief 80 by Chang, Owusu-Mensah, Everson, and Richwine, published in September 2025, which covers the 2023 and 2024 surveys. ASTP counts a hospital as using predictive AI if it uses machine learning or other predictive models that display output or recommendations in its EHR or in an app launched from the EHR. Adoption rates by hospital type use nonfederal acute care hospitals that gave informative answers, 2,425 in 2023 and 2,080 in 2024, and leave out missing and do-not-know answers. Use case, model source, evaluation, and accountability figures cover hospitals that used any predictive AI, 1,696 in 2023 and 1,587 in 2024. ASTP's use case chart labels each 2023 share and the change to 2024, and we added the two to get the 2024 shares; ASTP's text gives the billing and scheduling results, 61% and 67%, directly. For predicting inpatient risks, the chart labels only the 2023 share, and ASTP reports that this use stayed stable. ASTP does not identify the market-leading EHR vendor in its brief.
Generative AI figures come from the JAMA Network Open study by Jordan Everson, Paige Nong, and Chelsea Richwine, published December 12, 2025, which uses the 2024 survey, fielded from April to September 2024. Of 4,376 nonfederal acute care hospitals in the AHA Annual Survey, 2,253 responded to the IT Supplement, a 51.5% response rate, and 2,174 answered the AI questions. The study weights its percentages to represent all nonfederal acute care hospitals. It counts a hospital as an early adopter if its hospital or health system used a large language model integrated into the EHR, a fast follower if it planned to within a year, and a delayed adopter if it planned to within five years, had no plans, or did not know. The study describes Epic as the market-leading EHR developer. Operating margin, uncompensated care, and Medicaid discharge measures come from 2022 Medicare cost reports.
The two analyses use different samples, and only the JAMA figures are weighted, so the side-by-side table compares hospital groups within each source. Differences between its predictive and generative columns do not measure how many hospitals use one kind of AI and not the other. ASTP's large-hospital group has more than 400 beds, and the JAMA study's has 400 or more. We calculated differences and sums from the published values.
Sources
- Healthcare Industry Reviews, Hospital AI Adoption Study: analysis of federal survey results on predictive and generative AI use in US nonfederal acute care hospitals from the 2023 and 2024 AHA Information Technology Supplement, conducted October 2026.
- Chang W, Owusu-Mensah P, Everson J, Richwine C. Hospital Trends in the Use, Evaluation, and Governance of Predictive AI, 2023-2024. Office of the Assistant Secretary for Technology Policy, Data Brief 80, September 2025.
- Everson J, Nong P, Richwine C. Uptake of Generative AI Integrated With Electronic Health Records in US Hospitals. JAMA Network Open, published December 12, 2025.