Report · Oct 2026
Hospital at Home Statistics: 2026 Report
Published
Our analysts counted the 361 hospital entries on the Centers for Medicare & Medicaid Services (CMS) list of hospitals approved for its Acute Hospital Care at Home waiver, updated October 19, 2026, by state, health system, and approval date since November 2020, and combined that count with federal and peer-reviewed data on patient volume, outcomes, and Medicare spending. Together they show how widely US hospitals offer hospital-level care at home as of Q4 2026 and how those patients fare compared with similar patients treated in a hospital bed.
Key Findings
- 358 hospitals in 134 health systems across 37 states held CMS approval to treat inpatients at home as of October 19, 2026, compared with 366 hospitals in 139 systems in February 2026.
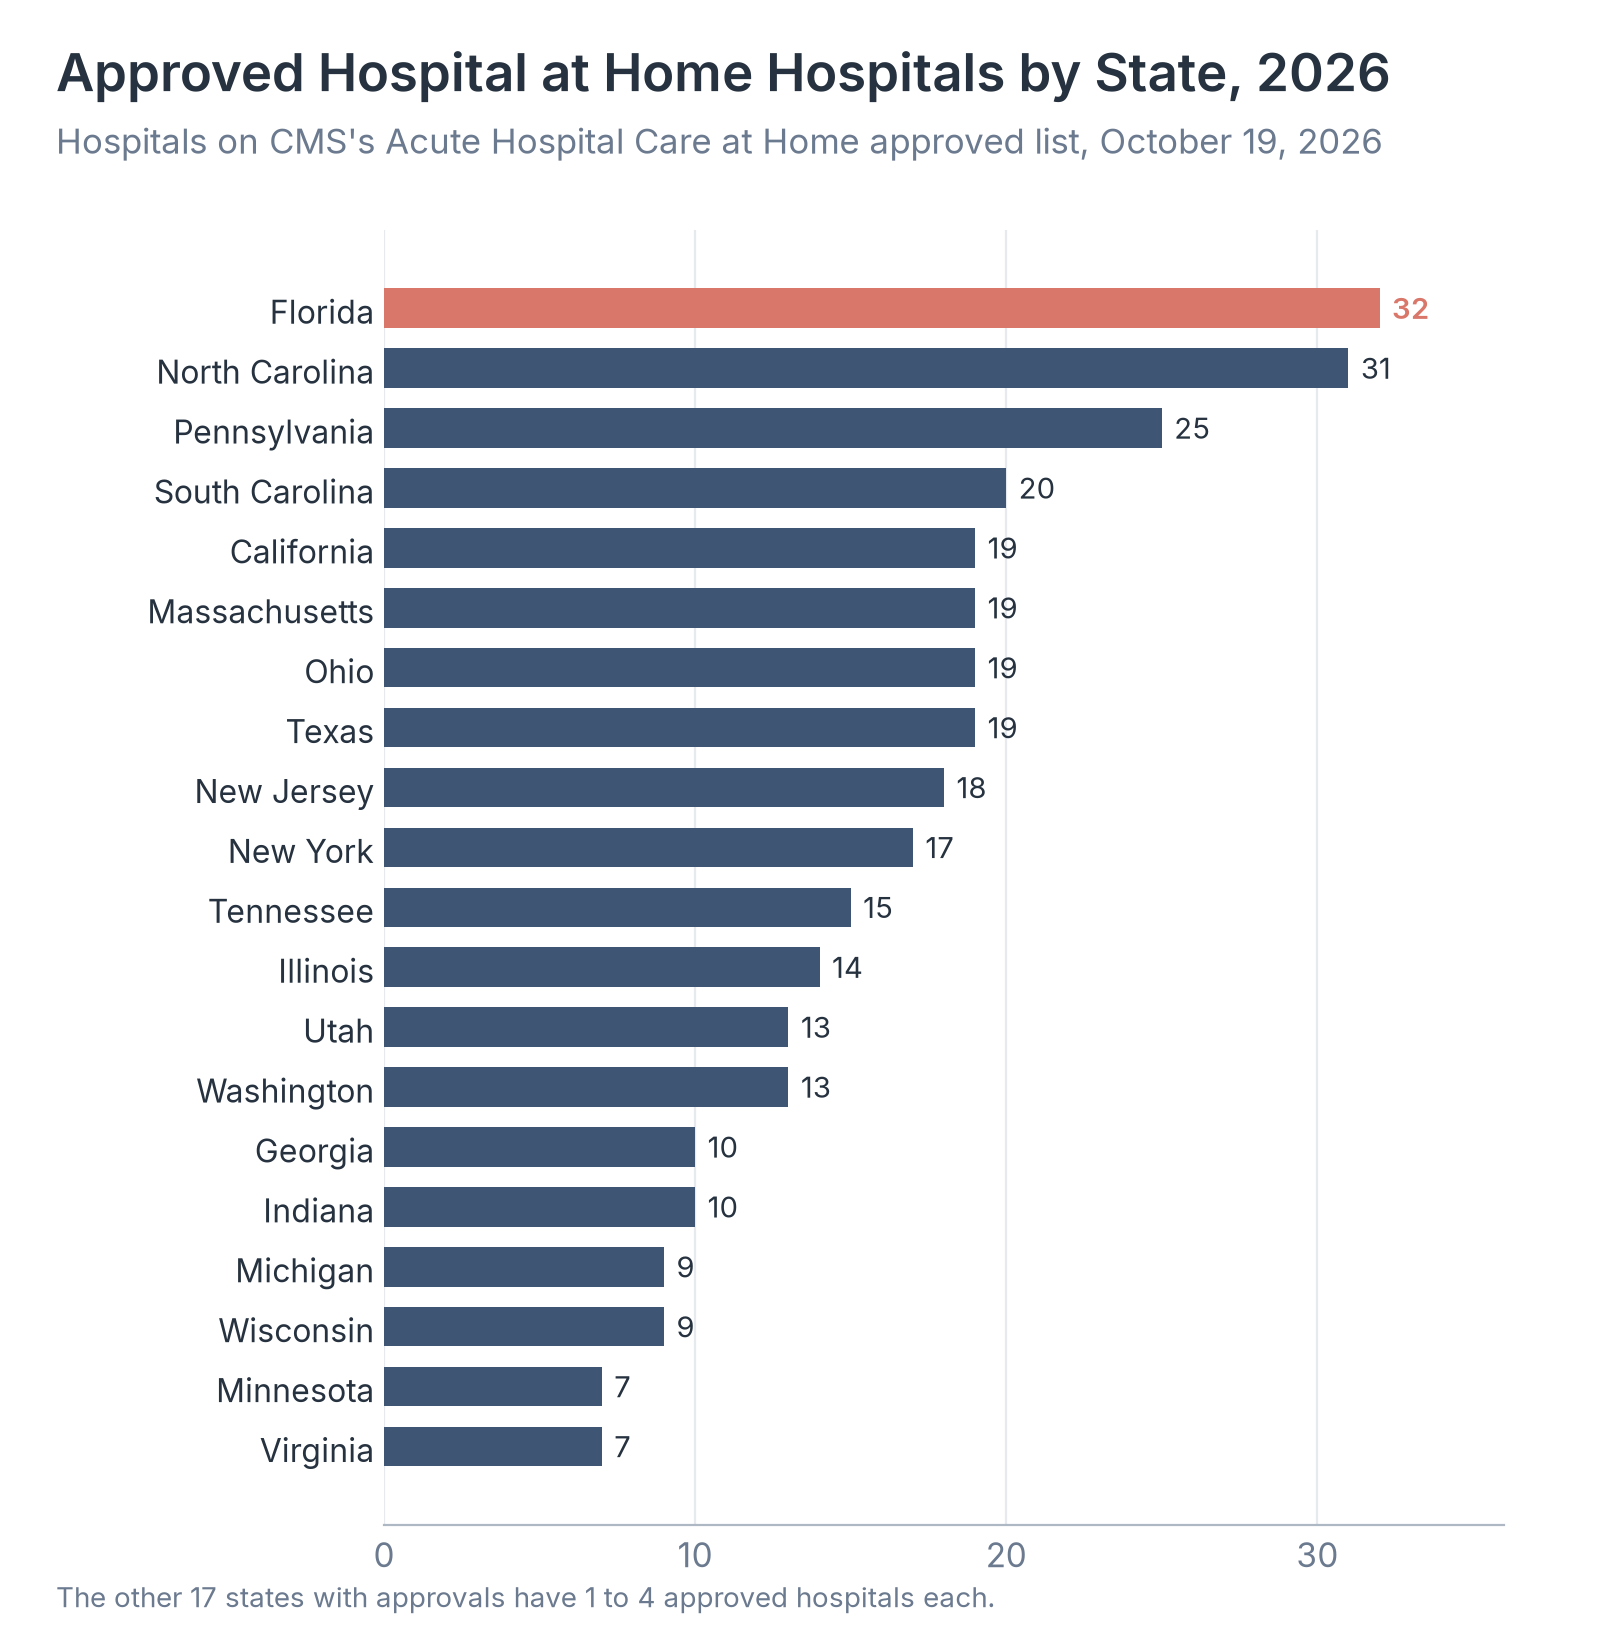
- Florida had the most approved hospitals in October 2026, 32, followed by North Carolina with 31, Pennsylvania with 25, and South Carolina with 20.
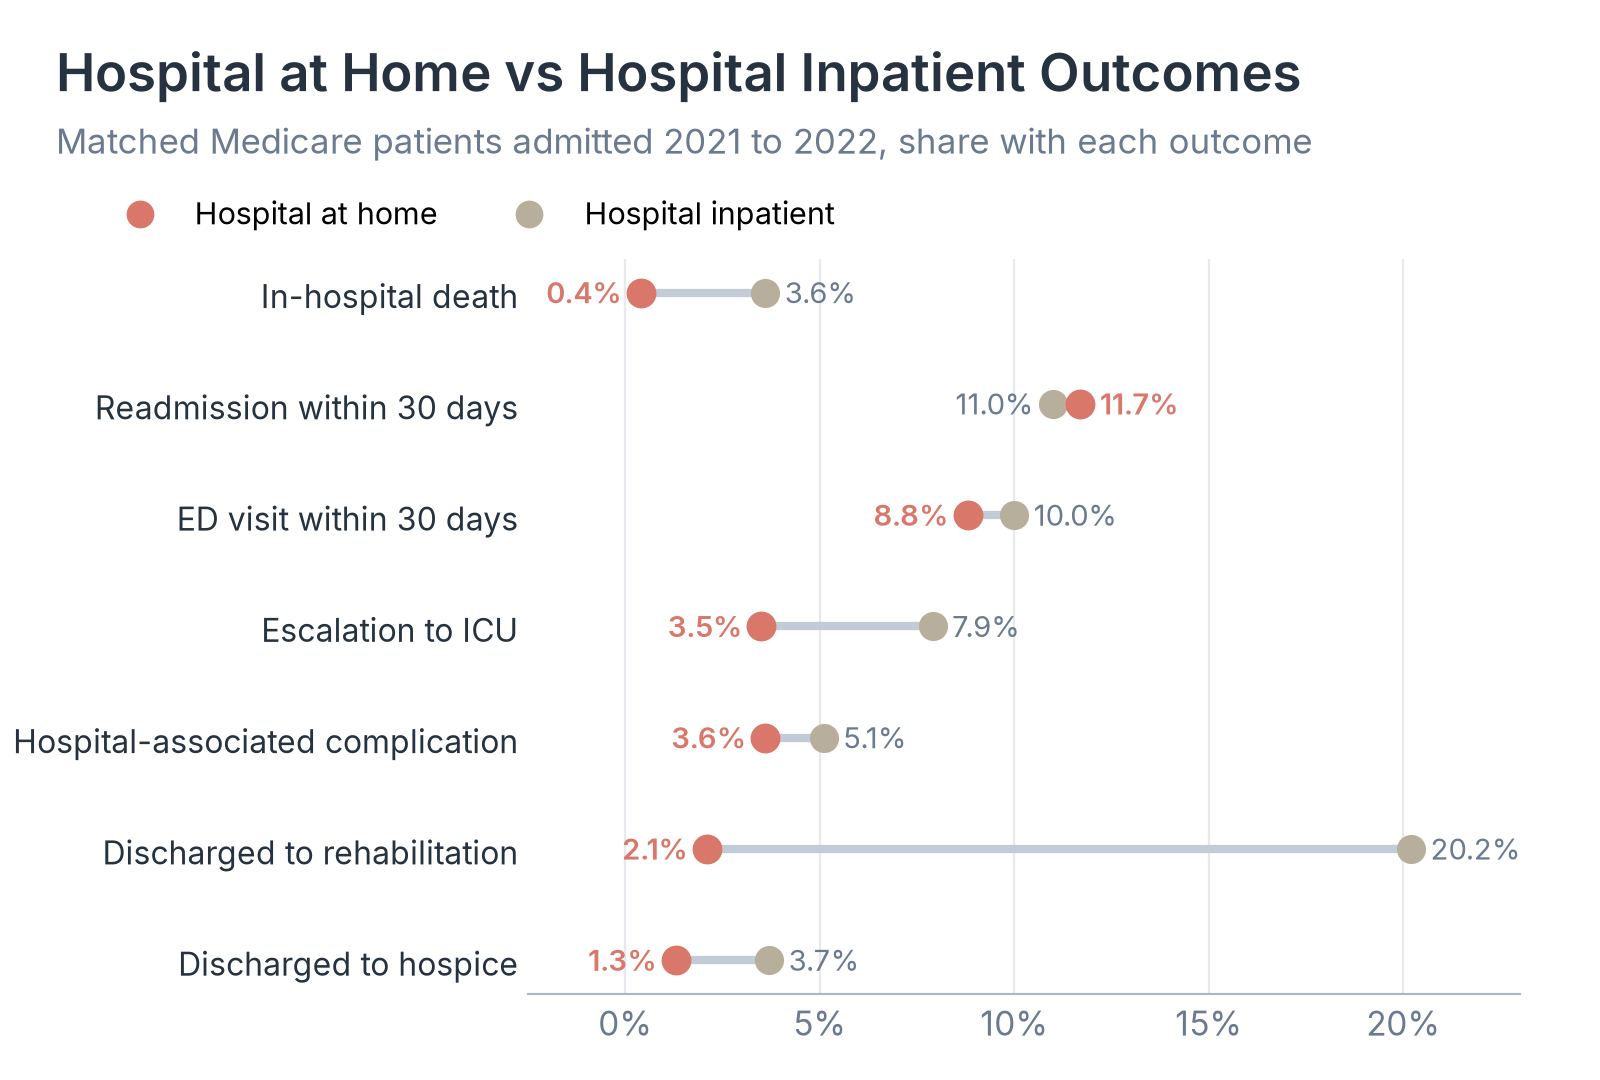
- In a matched study of 15,871 Medicare patients admitted in 2021 and 2022, 0.4% of hospital at home patients died in the hospital, compared with 3.6% of similar patients treated in a hospital bed.
- Health care costs in the 30 days after discharge averaged $3,538 for hospital at home patients and $6,414 for matched inpatients in the same study.
- The Consolidated Appropriations Act, 2026, signed February 3, 2026, extended the hospital at home waiver to September 30, 2030, after four shorter extensions since December 2022.
Hospital at home lets a hospital admit a patient who needs inpatient care, for an illness such as pneumonia, heart failure, or a urinary tract infection, and treat that patient in their own home. Clinical staff, such as nurses or paramedics, visit in person at least twice a day, and many programs add video visits with a doctor and remote monitoring of vital signs. Medicare pays the hospital the same amount it would pay for a stay in a hospital bed. CMS made this possible in November 2020, during the COVID-19 pandemic, by waiving the rule that a hospital must keep nurses on its premises around the clock, and Congress has kept the waiver going through a series of short extensions since. A five-year extension passed in February 2026 gives hospitals their first long planning window, and the approved list now runs to hundreds of hospitals. But many approved hospitals treat few patients at home, or none.
We took CMS's approved list as published on QualityNet, its quality reporting website, and counted the entries by state, health system, and approval year. We set that count beside earlier CMS totals, the Medicare Payment Advisory Commission's (MedPAC) analysis of 2022 program data, CMS's 2024 study of the program, and a JAMA Network Open study published May 5, 2026, that matched 4,174 hospital at home patients with 11,697 similar inpatients. We traced the waiver's end dates through the text of each extension law.
In the following sections, we break down approved hospitals by state, compare approvals by year and by health system, look at how many patients the programs treat and how concentrated that volume is, compare outcomes and Medicare spending with inpatient care, and trace the waiver's extensions through 2030.
Which States Have the Most Approved Hospital at Home Programs
A national total says little to a patient in a state where no hospital offers this kind of care, or to a company deciding where to sell home monitoring equipment. CMS lists each approved hospital with its health system, and most entries carry a state label, so we tallied hospitals and health systems for every state on the list.
| State | Approved hospitals | Health systems | Share of listed hospitals |
|---|---|---|---|
| Florida | 32 | 11 | 8.9% |
| North Carolina | 31 | 7 | 8.6% |
| Pennsylvania | 25 | 6 | 6.9% |
| South Carolina | 20 | 3 | 5.5% |
| California | 19 | 11 | 5.3% |
| Massachusetts | 19 | 6 | 5.3% |
| Ohio | 19 | 5 | 5.3% |
| Texas | 19 | 7 | 5.3% |
| New Jersey | 18 | 11 | 5.0% |
| New York | 17 | 9 | 4.7% |
| Tennessee | 15 | 7 | 4.2% |
| Illinois | 14 | 5 | 3.9% |
| Utah | 13 | 2 | 3.6% |
| Washington | 13 | 4 | 3.6% |
| Georgia | 10 | 3 | 2.8% |
| Indiana | 10 | 5 | 2.8% |
| Michigan | 9 | 4 | 2.5% |
| Wisconsin | 9 | 6 | 2.5% |
| Minnesota | 7 | 2 | 1.9% |
| Virginia | 7 | 4 | 1.9% |
| Arizona | 4 | 2 | 1.1% |
| Oklahoma | 4 | 3 | 1.1% |
| Idaho | 3 | 1 | 0.8% |
| Oregon | 3 | 2 | 0.8% |
| Rhode Island | 3 | 2 | 0.8% |
| Arkansas | 2 | 2 | 0.6% |
| Connecticut | 2 | 1 | 0.6% |
| Delaware | 2 | 2 | 0.6% |
| Iowa | 2 | 1 | 0.6% |
| Kentucky | 2 | 2 | 0.6% |
| North Dakota | 2 | 2 | 0.6% |
| Alabama | 1 | 1 | 0.3% |
| Louisiana | 1 | 1 | 0.3% |
| Maryland | 1 | 1 | 0.3% |
| Mississippi | 1 | 1 | 0.3% |
| New Mexico | 1 | 1 | 0.3% |
| South Dakota | 1 | 1 | 0.3% |
| All states | 361 | 134 | 100% |
Source: Centers for Medicare & Medicaid Services (CMS), QualityNet, Approved Facilities/Systems for Acute Hospital Care at Home, updated October 19, 2026. List entries counted by Healthcare Industry Reviews; systems that operate in more than one state are counted in each.
Source: Healthcare Industry Reviews analysis of the CMS Acute Hospital Care at Home approved list, October 19, 2026.
Key Findings
- Florida, North Carolina, Pennsylvania, and South Carolina together held 108 of the 361 listed hospitals, or 29.9%. South Carolina's 20 approved hospitals belong to just 3 health systems.
- Thirteen states had no approved hospital on the October 2026 list, among them Colorado, Missouri, and Nevada. The District of Columbia had none either.
- Utah's 13 approved hospitals come from 2 health systems, and 12 of them belong to Intermountain Health, so a single system's application can set a state's count. With the waiver now running to 2030, health systems in the 13 states without an approved hospital have more than four years to apply.
How Hospital at Home Approvals Have Grown Since 2020, and Which Systems Lead
The approved list also records the date CMS approved each hospital. Those dates show when health systems decided to start, and the system names show how much of the program depends on a handful of large organizations.
| Approval year | Hospitals approved | Cumulative total |
|---|---|---|
| 2020 | 54 | 54 |
| 2021 | 115 | 169 |
| 2022 | 55 | 224 |
| 2023 | 39 | 263 |
| 2024 | 52 | 315 |
| 2025 | 43 | 358 |
| 2026 (through October 19) | 3 | 361 |
Source: Centers for Medicare & Medicaid Services (CMS), QualityNet, Approved Facilities/Systems for Acute Hospital Care at Home, updated October 19, 2026. Approval years counted by Healthcare Industry Reviews. Hospitals that have left the list are not included.
| Health system | Approved hospitals | States |
|---|---|---|
| Atrium Health/Advocate Health | 13 | Georgia, Illinois, North Carolina, Wisconsin |
| Intermountain Health | 12 | Utah |
| Adventist Health | 10 | California, Oregon |
| Medical City Healthcare | 10 | Texas |
| Novant Health | 10 | North Carolina |
| Beth Israel Lahey Health | 10 | Massachusetts |
| BayCare Health System | 10 | Florida |
| Prisma Health | 9 | South Carolina |
| Cleveland Clinic (Ohio hospitals) | 9 | Ohio |
| Northwestern Medicine | 9 | Illinois |
| Wellstar Health System | 8 | Georgia |
Source: Centers for Medicare & Medicaid Services (CMS), QualityNet, Approved Facilities/Systems for Acute Hospital Care at Home, updated October 19, 2026. Health systems as CMS groups them on the list.
| Approved hospitals per system | Health systems | Hospitals | Share of listed hospitals |
|---|---|---|---|
| 1 hospital | 69 | 69 | 19.1% |
| 2 to 4 hospitals | 45 | 127 | 35.2% |
| 5 to 9 hospitals | 13 | 90 | 24.9% |
| 10 or more hospitals | 7 | 75 | 20.8% |
Source: Centers for Medicare & Medicaid Services (CMS), QualityNet, Approved Facilities/Systems for Acute Hospital Care at Home, updated October 19, 2026.
Source: Healthcare Industry Reviews analysis of the CMS Acute Hospital Care at Home approved list, October 19, 2026.
Key Findings
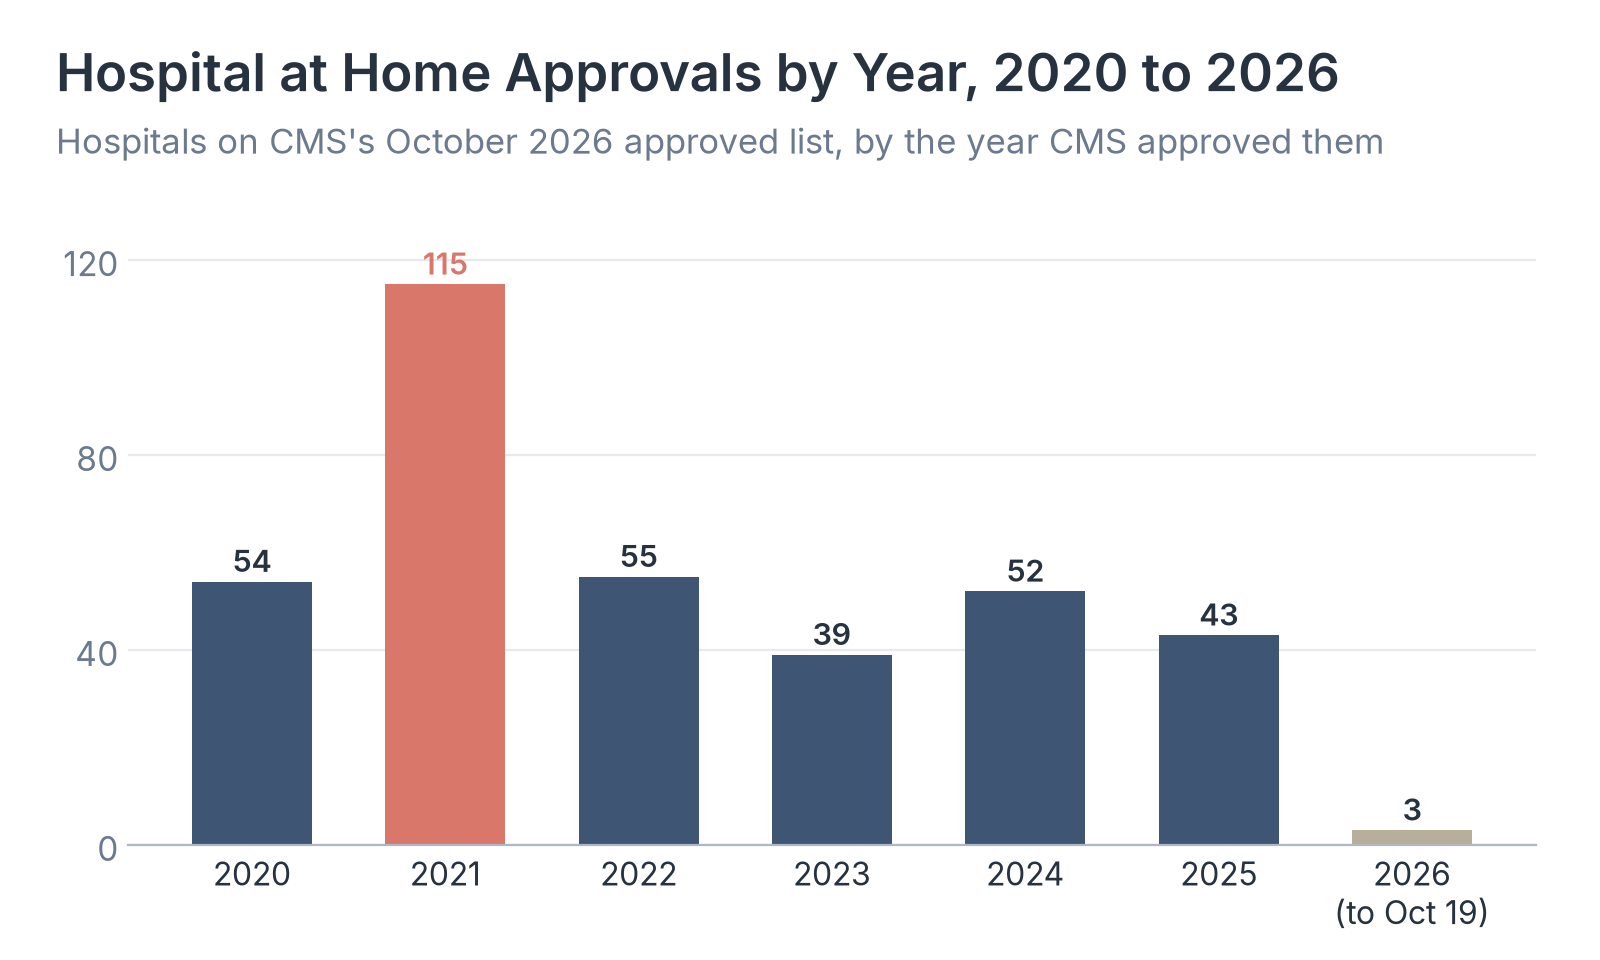
- 2021 brought the most approvals, 115 of the hospitals now on the list, as systems signed up during the pandemic. Approvals then ran between 39 and 55 a year from 2022 through 2025.
- Only 3 hospitals on the list carry 2026 approval dates, and none carries a date from October through December 2025, when the waiver lapsed and then returned on a short extension through January 30, 2026. The national count fell from 366 hospitals in February 2026 to 358 in October.
- The 7 systems with 10 or more approved hospitals account for 75 hospitals, 20.8% of the list, while 69 systems have a single approved hospital. Because large systems apply for many hospitals at once, the list can grow or shrink by a dozen hospitals on one system's decision.
How Many Patients Hospital at Home Programs Treat
Approval allows a hospital to treat inpatients at home, but it does not require it to. CMS, MedPAC (which advises Congress on Medicare), and the American Hospital Association (AHA) have published program totals at several points, and MedPAC broke down 2022 activity hospital by hospital, which shows how volume has grown and how unevenly it is spread.
| As of | Hospitals | Patients or discharges since launch | Reported by |
|---|---|---|---|
| March 20, 2023 | Not reported | 11,159 patients | MedPAC, citing CMS |
| April 2024 | 328 approved | More than 23,000 discharges | MedPAC, citing CMS |
| October 2024 | 366 participated | More than 31,000 patients | CMS |
| February 2026 | 366 approved, in 139 systems and 37 states | Not reported | AHA, citing CMS |
| October 19, 2026 | 358 approved, in 134 systems and 37 states | An estimated 60,000 patients | CMS list; patient total estimated by Healthcare Industry Reviews |
Source: Medicare Payment Advisory Commission (MedPAC), Report to the Congress, Chapter 6: Medicare's Acute Hospital Care at Home Program, June 2024; CMS, Lessons from CMS' Acute Hospital Care at Home Initiative, December 17, 2024; AHA, 4 Providers Turning Hospital-at-Home into a Care Delivery Transformation Juggernaut, March 10, 2026; Centers for Medicare & Medicaid Services (CMS), QualityNet, Approved Facilities/Systems for Acute Hospital Care at Home, updated October 19, 2026. The October 2026 patient total is a Healthcare Industry Reviews estimate.
| Yearly discharges per hospital | Active hospitals | Discharges | Share of discharges | Average discharges per hospital |
|---|---|---|---|---|
| 6 or fewer | 27 | 70 | 1% | 2.6 |
| 7 to 25 | 24 | 337 | 6% | 14.0 |
| 26 to 74 | 28 | 1,162 | 21% | 41.5 |
| 75 to 170 | 15 | 1,181 | 21% | 78.7 |
| 171 to 223 | 6 | 1,134 | 20% | 189.0 |
| 224 or more | 5 | 1,675 | 30% | 335.0 |
| Total | 105 | 6,189 | 100% | 58.9 |
Source: Medicare Payment Advisory Commission (MedPAC), Report to the Congress, Chapter 6: Medicare's Acute Hospital Care at Home Program, June 2024 (Table 6-2). Includes Medicare and Medicaid discharges.
Source: Healthcare Industry Reviews analysis of MedPAC, June 2024 (Table 6-2).
Key Findings
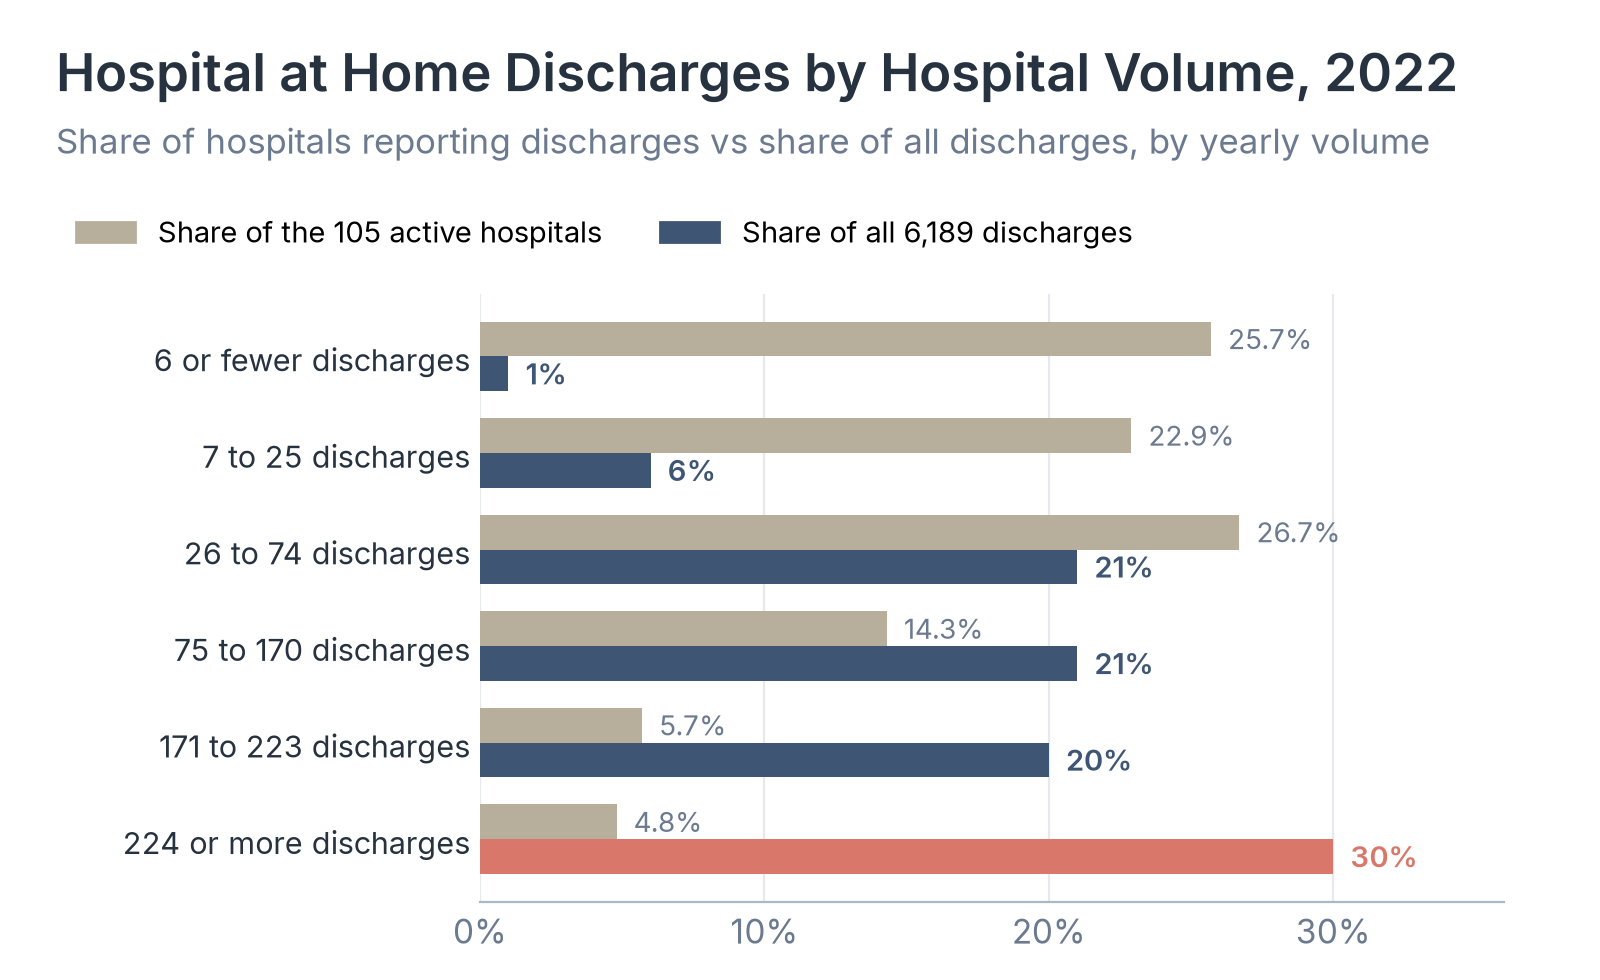
- In 2022, 105 of the 284 hospitals reporting to CMS, or 37%, treated at least one patient at home. Together they reported 6,189 discharges, less than 0.1% of all discharges from hospitals paid under Medicare's inpatient prospective payment system (IPPS).
- The 11 busiest programs, about 1 in 10 active hospitals, handled 50% of 2022 discharges. The JAMA Network Open study found the same pattern: of 68 hospitals with 12 or more hospital at home admissions in 2021 and 2022, 11 accounted for about half of all admissions.
- CMS counted more than 31,000 patients by October 2024, and at the pace reported that year the total reached an estimated 60,000 by October 2026. Even at that size, hospital at home treats a very small fraction of Medicare inpatients, and a few large programs produce most of the national results.
Hospital at Home Outcomes Compared With Inpatient Care
Hospitals choose which patients they send home, so a fair comparison needs patients who looked alike before admission. The JAMA Network Open study matched Medicare patients aged 65 and older on age and other demographics, health history, prior hospital and emergency department use, and diagnosis group, and CMS's own study compared readmission rates within its most common diagnosis groups.
| Outcome | Hospital at home (4,174 patients) | Hospital inpatient (11,697 patients) | Difference |
|---|---|---|---|
| In-hospital death | 0.4% | 3.6% | -3.2 points |
| Readmission within 30 days | 11.7% | 11.0% | +0.7 points |
| Emergency department visit within 30 days | 8.8% | 10.0% | -1.2 points |
| Escalation to intensive care | 3.5% | 7.9% | -4.4 points |
| Hospital-associated complication | 3.6% | 5.1% | -1.5 points |
| Discharged home | 94.9% | 72.7% | +22.2 points |
| Discharged to rehabilitation | 2.1% | 20.2% | -18.1 points |
| Discharged to hospice | 1.3% | 3.7% | -2.4 points |
| Average length of stay | 7.36 days | 6.24 days | +1.12 days |
Source: Vakkalanka and others, Outcomes Associated With Hospital at Home vs Traditional Inpatient Stay, JAMA Network Open, May 5, 2026 (Table 3). Fee-for-service Medicare patients admitted January 1, 2021, through December 1, 2022.
| MS-DRG | Diagnosis group | Hospital at home | Inpatient comparison group |
|---|---|---|---|
| 177 | Respiratory infections and inflammations with MCC | 16% | 13% |
| 194 | Simple pneumonia and pleurisy with CC | 11% | 15% |
| 191 | Chronic obstructive pulmonary disease with CC | 14% | 20% |
| 195 | Simple pneumonia and pleurisy without CC or MCC | 6% | 13% |
| 871 | Septicemia or severe sepsis without MV over 96 hours, with MCC | 14% | 12% |
Source: CMS, Lessons from CMS' Acute Hospital Care at Home Initiative, December 17, 2024 (Table 1). MCC means major complication or comorbidity, CC means complication or comorbidity, and MV means mechanical ventilation.
Source: Healthcare Industry Reviews analysis of Vakkalanka and others, JAMA Network Open, May 5, 2026 (Table 3).
Key Findings
- Escalation to intensive care was 3.5% for hospital at home patients and 7.9% for matched inpatients, and hospital-associated complications, such as falls, severe pressure ulcers, and catheter infections, were 3.6% and 5.1%.
- 94.9% of hospital at home patients went home at discharge, compared with 72.7% of inpatients, and 2.1% went to rehabilitation, compared with 20.2%. Their stays were longer, averaging 7.36 days against 6.24 days.
- Readmissions were the one primary outcome with no significant difference, 11.7% against 11.0%. CMS found lower readmission rates at home for simple pneumonia and chronic obstructive pulmonary disease, and higher rates for respiratory infections and sepsis with major complications. Both studies describe patients that hospitals selected for home care, so the results show association and do not prove that home care causes better outcomes.
Conditions Treated at Home and Medicare Spending After Discharge
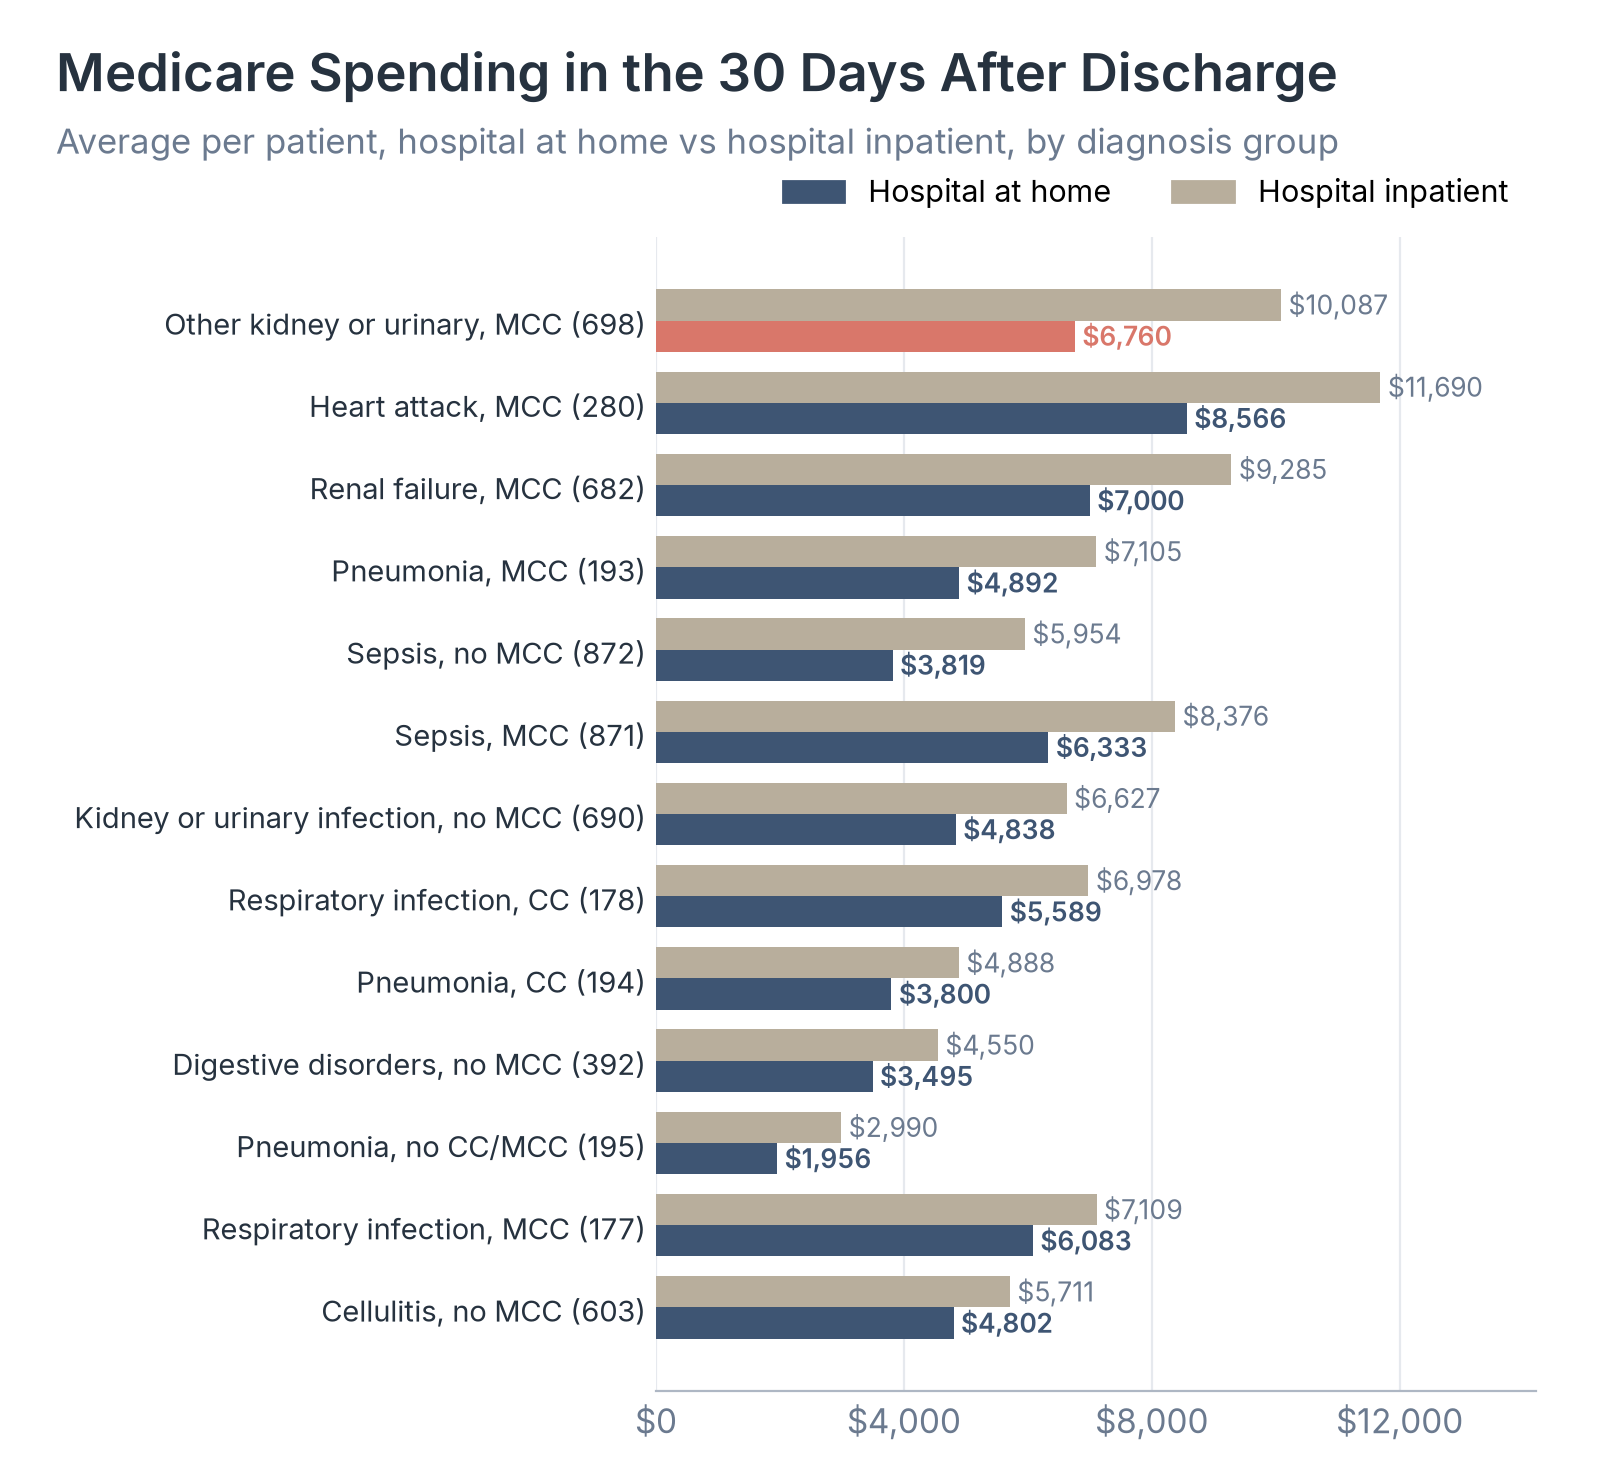
Medicare pays the same amount for a hospital at home stay as for a stay in a hospital bed, so any difference in spending shows up after the patient is discharged. We gathered the conditions hospitals treat at home from CMS and MedPAC, then compared CMS's figures on spending in the 30 days after discharge with the costs in the JAMA Network Open study.
| Major diagnostic category | Share of hospital at home patients |
|---|---|
| Respiratory | 36% |
| Circulatory | 16% |
| Renal | 16% |
| Infectious diseases | 12% |
Source: CMS, Lessons from CMS' Acute Hospital Care at Home Initiative, December 17, 2024. Patients treated from November 2020 through July 2024.
| MS-DRG | Condition | Share of hospital at home cases |
|---|---|---|
| 177 | Respiratory infection, such as COVID-19, with MCC | 16% |
| 291 | Heart failure with MCC | 11% |
| 871 | Septicemia with MCC | 7% |
| 193 | Pneumonia with MCC | 5% |
| 603 | Cellulitis without MCC | 5% |
| 229 | Urinary tract infection without MCC | 4% |
| 228 | Chronic obstructive pulmonary disease with CC | 4% |
| 872 | Septicemia without MCC | 4% |
| 178 | Respiratory infection, such as COVID-19, with CC | 3% |
| 194 | Pneumonia with CC | 3% |
| All other | 38% |
Source: Medicare Payment Advisory Commission (MedPAC), Report to the Congress, Chapter 6: Medicare's Acute Hospital Care at Home Program, June 2024 (Table 6-4). Based on a sample of 2,962 discharges.
| MS-DRG | Diagnosis group | Hospital at home | Inpatient comparison group | Difference | Difference, percent |
|---|---|---|---|---|---|
| 177 | Respiratory infections and inflammations with MCC | $6,083 | $7,109 | -$1,025 | -14.4% |
| 178 | Respiratory infections and inflammations with CC | $5,589 | $6,978 | -$1,388 | -19.9% |
| 193 | Simple pneumonia and pleurisy with MCC | $4,892 | $7,105 | -$2,213 | -31.1% |
| 194 | Simple pneumonia and pleurisy with CC | $3,800 | $4,888 | -$1,087 | -22.3% |
| 195 | Simple pneumonia and pleurisy without CC/MCC | $1,956 | $2,990 | -$1,034 | -34.6% |
| 280 | Acute myocardial infarction, discharged alive, with MCC | $8,566 | $11,690 | -$3,123 | -26.7% |
| 392 | Esophagitis, gastroenteritis, and miscellaneous digestive disorders without MCC | $3,495 | $4,550 | -$1,055 | -23.2% |
| 603 | Cellulitis without MCC | $4,802 | $5,711 | -$909 | -15.9% |
| 682 | Renal failure with MCC | $7,000 | $9,285 | -$2,285 | -24.6% |
| 690 | Kidney and urinary tract infections without MCC | $4,838 | $6,627 | -$1,789 | -27.0% |
| 698 | Other kidney and urinary tract diagnoses with MCC | $6,760 | $10,087 | -$3,326 | -33.0% |
| 871 | Septicemia or severe sepsis without MV over 96 hours, with MCC | $6,333 | $8,376 | -$2,043 | -24.4% |
| 872 | Septicemia or severe sepsis without MV over 96 hours, without MCC | $3,819 | $5,954 | -$2,135 | -35.9% |
Source: CMS, Lessons from CMS' Acute Hospital Care at Home Initiative, December 17, 2024 (Table 2). Every difference shown is statistically significant.
| Cost | Hospital at home, mean | Inpatient, mean | Hospital at home, median | Inpatient, median |
|---|---|---|---|---|
| Total health care costs | $20,114 | $22,399 | $16,262 | $17,424 |
| Index hospital stay | $14,643 | $14,437 | $12,561 | $11,972 |
| 30 days after discharge | $3,538 | $6,414 | $2,293 | $3,199 |
| Readmissions within 30 days (readmitted patients only) | $17,788 | $20,359 | $13,672 | $14,298 |
Source: Vakkalanka and others, Outcomes Associated With Hospital at Home vs Traditional Inpatient Stay, JAMA Network Open, May 5, 2026 (Table 3). Medicare, primary payer, and patient payments in 2022 US dollars.
Source: Healthcare Industry Reviews analysis of CMS, December 17, 2024 (Table 2).
Key Findings
- Medicare spent less in the 30 days after discharge on hospital at home patients in all 13 diagnosis groups CMS reported, by $909 to $3,326 per patient, or 14.4% to 35.9%. The largest dollar gap was for other kidney and urinary tract diagnoses with major complications.
- In the JAMA Network Open study, the hospital stay itself cost slightly more at home, a mean of $14,643 against $14,437, but lower costs after discharge brought average total costs to $20,114, against $22,399 for inpatients.
- The JAMA authors credit the lower totals to spending after discharge, including emergency department visits and post-acute care. CMS cautions that differences in clinical complexity between its two groups make it difficult to conclude that the program lowered Medicare spending overall.
Hospital at Home Waiver Extensions and Deadlines Through 2030
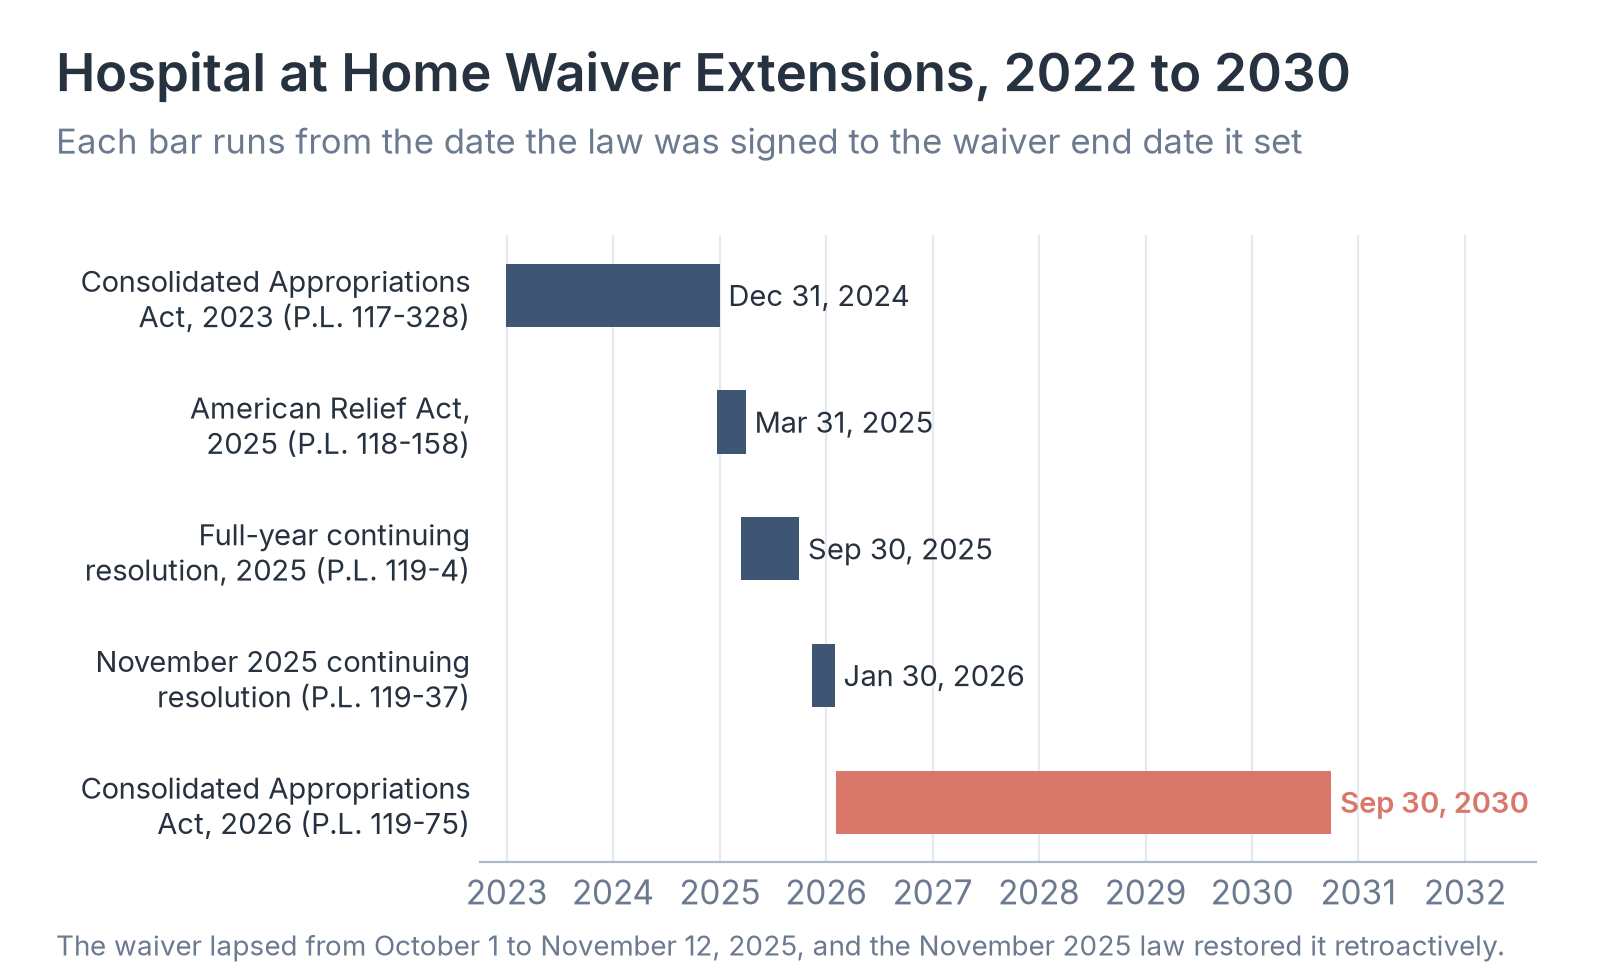
The waiver has never been permanent, and each short extension left hospitals planning around a new deadline. We traced every end date that Congress has written into federal law since it first extended the program beyond the pandemic emergency.
| Law | Signed | Previous end date | New end date | Time added |
|---|---|---|---|---|
| Consolidated Appropriations Act, 2023 (P.L. 117-328, sec. 4140) | December 29, 2022 | End of the COVID-19 public health emergency | December 31, 2024 | Not applicable |
| American Relief Act, 2025 (P.L. 118-158, sec. 3208) | December 21, 2024 | December 31, 2024 | March 31, 2025 | 3 months |
| Full-Year Continuing Appropriations and Extensions Act, 2025 (P.L. 119-4, sec. 2208) | March 15, 2025 | March 31, 2025 | September 30, 2025 | 6 months |
| Continuing Appropriations, Agriculture, Legislative Branch, Military Construction and Veterans Affairs, and Extensions Act, 2026 (P.L. 119-37, sec. 6204) | November 12, 2025 | September 30, 2025 (lapsed October 1, 2025) | January 30, 2026 | 4 months |
| Consolidated Appropriations Act, 2026 (P.L. 119-75, sec. 6210) | February 3, 2026 | January 30, 2026 | September 30, 2030 | 56 months |
Source: Public Laws 117-328, 118-158, 119-4, and 119-37 (US Government Publishing Office) and 119-75 (Congress.gov); CMS, Acute Hospital Care at Home Data Release Fact Sheet, March 17, 2026.
Source: Healthcare Industry Reviews analysis of the five public laws; lapse dates from CHAP, Federal Government Re-Opens, and HIMSS, U.S. Government Reopens Following Bipartisan Deal, November 2025.
Key Findings
- The 2026 law added 56 months, more than four times the 13 months added by the three extensions before it combined.
- The waiver lapsed on October 1, 2025, during the federal government shutdown, and stayed lapsed until the November 12, 2025, law restored it retroactively and allowed hospitals to be paid for care during the gap.
- The 2026 law also requires CMS to complete a second study by September 30, 2029, covering readmissions beyond 30 days, staffing, hospital costs, and transfers between home and hospital. CMS will stop accepting new waiver requests after September 1, 2030, so those results are due a year before the current end date.
What Hospital at Home Statistics Mean for Patients and Hospitals in 2026
For Medicare patients, hospital at home is now offered by an estimated 11% of the US hospitals paid under Medicare's IPPS, in 37 states. A patient with pneumonia, heart failure, or a kidney infection who lives near one of those hospitals may be offered a hospital stay in their own bed, and the matched federal and peer-reviewed data so far show those patients doing as well or better on most short-term measures, with readmissions about the same.
For hospitals, the extension to 2030 brings more than four years without a deadline, after three extensions of 3 to 6 months each. The volume data show that many approved hospitals treat few or no patients at home, and that a small group of programs treats most of them.
So if you are comparing hospital at home programs, look at each hospital's patient volume and the conditions it treats, because a place on CMS's approved list does not show how many patients a hospital cares for at home.
Data Collection and Methodology
We opened CMS's Acute Hospital Care at Home resources page on QualityNet on October 29, 2026, and copied its approved hospital table, marked as updated October 19, 2026. CMS states that the list covers 358 approved CMS Certification Numbers (CCNs) across 134 health systems in 37 states, and we use those totals for national counts. The table itself has 361 hospital entries, because a few entries are system-level rows or share a CCN, and we use the 361 entries for breakdowns by state, system, and year. Our count of health systems (134) and states (37) matches CMS's totals.
We assigned each entry to a state from the state label on the hospital or its system. For 19 entries with no label, we used the hospital's location. CMS labels Beth Israel Deaconess and Lahey Health "(NY)", but its 10 listed hospitals are in Massachusetts, and we counted them there. We kept health systems as CMS groups them, so Cleveland Clinic's Florida and Ohio hospitals appear as two systems, and systems with hospitals in more than one state count once in each state. Approval years come from the approval date on each entry. Hospitals that have left the list are not in the year counts, so earlier years may be undercounted.
Program totals come from different measures: CMS and MedPAC report patients served in some years and discharges, including Medicaid discharges, in others. MedPAC's 2022 figures come from monthly reports hospitals submit to CMS, which MedPAC notes are not validated against claims. The JAMA Network Open study by Vakkalanka and colleagues used fee-for-service Medicare claims for patients aged 65 and older admitted from January 1, 2021, through December 1, 2022, at waivered hospitals with 12 or more hospital at home admissions, and matched each hospital at home patient with up to 3 inpatients. Its costs include Medicare, primary payer, and patient payments in 2022 US dollars. CMS's 2024 study compared hospital at home and inpatient patients at 332 participating hospitals in 38 states from November 2020 through July 2024. Both studies are observational.
Two figures are estimates. We estimated about 60,000 patients treated through October 2026 from CMS's reported growth from more than 23,000 discharges in April 2024 to more than 31,000 patients in October 2024, about 1,330 a month, carried forward 24 months less the six-week lapse in late 2025. We estimated that 11% of IPPS hospitals hold approval by dividing CMS's 358 approved hospitals by the 3,293 IPPS hospitals in MedPAC's 2022 comparison. All money figures are in US dollars, and no currency conversion was needed. We calculated products, differences, and ratios from the published values.
Sources
- Healthcare Industry Reviews, Hospital at Home Study: analysis of the CMS Acute Hospital Care at Home approved hospital list (updated October 19, 2026) by state, health system, and approval year, with published federal and peer-reviewed data on program volume, outcomes, and Medicare spending, conducted October 2026.
- Centers for Medicare & Medicaid Services. Approved Facilities/Systems for Acute Hospital Care at Home. QualityNet, updated October 19, 2026.
- Centers for Medicare & Medicaid Services. Acute Hospital Care at Home. QualityNet program overview.
- Vakkalanka JP, Young TL, Bianchi G, Ullrich F, Carter KD, Mohr NM, Gutierrez J. Outcomes Associated With Hospital at Home vs Traditional Inpatient Stay. JAMA Network Open, May 5, 2026.
- Adams DN, Wolfe AJ, Warren JM, Hughes DL. Lessons from CMS' Acute Hospital Care at Home Initiative. CMS blog, December 17, 2024.
- Medicare Payment Advisory Commission. Chapter 6: Medicare's Acute Hospital Care at Home Program. Report to the Congress: Medicare and the Health Care Delivery System, June 2024.
- American Hospital Association. 4 Providers Turning Hospital-at-Home into a Care Delivery Transformation Juggernaut. AHA Center for Health Innovation Market Scan, March 10, 2026.
- Centers for Medicare & Medicaid Services. Acute Hospital Care at Home Data Release Fact Sheet. March 17, 2026.
- Consolidated Appropriations Act, 2023. Public Law 117-328, section 4140, December 29, 2022.
- American Relief Act, 2025. Public Law 118-158, section 3208, December 21, 2024.
- Full-Year Continuing Appropriations and Extensions Act, 2025. Public Law 119-4, section 2208, March 15, 2025.
- Continuing Appropriations, Agriculture, Legislative Branch, Military Construction and Veterans Affairs, and Extensions Act, 2026. Public Law 119-37, section 6204, November 12, 2025.
- Consolidated Appropriations Act, 2026. Public Law 119-75, section 6210, February 3, 2026.
- Community Health Accreditation Partner (CHAP). Federal Government Re-Opens. November 2025.
- HIMSS. U.S. Government Reopens Following Bipartisan Deal; Key Health and Technology Provisions Extended. November 2025.