Report · Oct 2026
No Surprises Act Arbitration Statistics: 2026 Report
Published
We analyzed No Surprises Act arbitration statistics for 2025, the most recent full year of federal data, with 2024 for comparison. The No Surprises Act sends out-of-network payment disputes between providers and health plans to a certified independent dispute resolution (IDR) entity, which picks either the provider's offer or the plan's offer as the payment amount.
Figures come from two CMS data sets published as of October 8, 2026. The first is the Federal IDR supplemental tables for each quarter of 2024 and 2025, which give official counts of disputes initiated, payment determinations, prevailing parties and the top initiating and non-initiating parties. The second is the Federal IDR public use file (PUF) for each quarter of 2025, which lists every line item in disputes closed with a payment determination, 5,728,139 line items across 2,180,938 disputes. We used the PUF to calculate win rates and median offers by specialty, initiating party type, practice size, provider email domain, state and service code.
Offers in the PUF are stated as a share of the qualifying payment amount (QPA), the plan's median in-network rate for the service, and we summarize them as medians. Provider win rate is the share of decided line items where the certified IDR entity chose the provider's or facility's offer. Specialty groups follow the CPT ranges CMS uses in its supplemental tables.
No Surprises Act Arbitration Volume, 2024 and 2025
Annual figures are the sum of the four quarterly CMS supplemental tables and include air ambulance disputes.
| Measure | 2024 | 2025 | Change |
|---|---|---|---|
| Disputes initiated | 1,463,872 | 2,559,375 | +74.8% |
| Initiated by providers | 1,271,496 | 2,007,097 | +57.9% |
| Initiated by facilities | 191,916 | 551,970 | +187.6% |
| Initiated by health plans or issuers | 460 | 308 | -33.0% |
| Payment determinations | 1,047,575 | 2,227,286 | +112.6% |
| Provider, facility or air ambulance prevailed | 888,794 (84.8%) | 1,928,831 (86.6%) | +1.8 points |
| Health plan or issuer prevailed | 158,107 (15.1%) | 296,180 (13.3%) | -1.8 points |
| Only one party submitted an offer | 210,908 (20.1%) | 432,790 (19.4%) | -0.7 points |
| Prevailing offer above the QPA | 885,849 (84.6%) | 1,942,440 (87.2%) | +2.6 points |
- Disputes initiated rose 74.8% to 2,559,375 in 2025. Payment determinations more than doubled to 2,227,286.
- Facilities initiated 21.6% of 2025 disputes, up from 13.1% in 2024.
- Health plans initiated 308 of the 2,559,375 disputes filed in 2025.
- A CMS readout of an October 1, 2026 meeting with certified IDR entities says the process has received and closed more than 7 million disputes since April 2022.
Federal IDR Prevailing Party Rates by Quarter, 2025
Quarterly figures come from Table 1 and Table 12 of each CMS supplemental release.
| Quarter | Disputes Initiated | Payment Determinations | Provider Side Prevailed | Plan Prevailed | One Party Only | Prevailing Offer Above QPA |
|---|---|---|---|---|---|---|
| 2025 Q1 | 545,422 | 466,227 | 87.4% | 12.5% | 23.0% | 87.5% |
| 2025 Q2 | 641,390 | 616,020 | 88.2% | 11.7% | 22.1% | 87.5% |
| 2025 Q3 | 653,445 | 602,901 | 86.8% | 13.1% | 19.6% | 86.8% |
| 2025 Q4 | 719,118 | 542,138 | 83.8% | 16.1% | 13.2% | 87.1% |
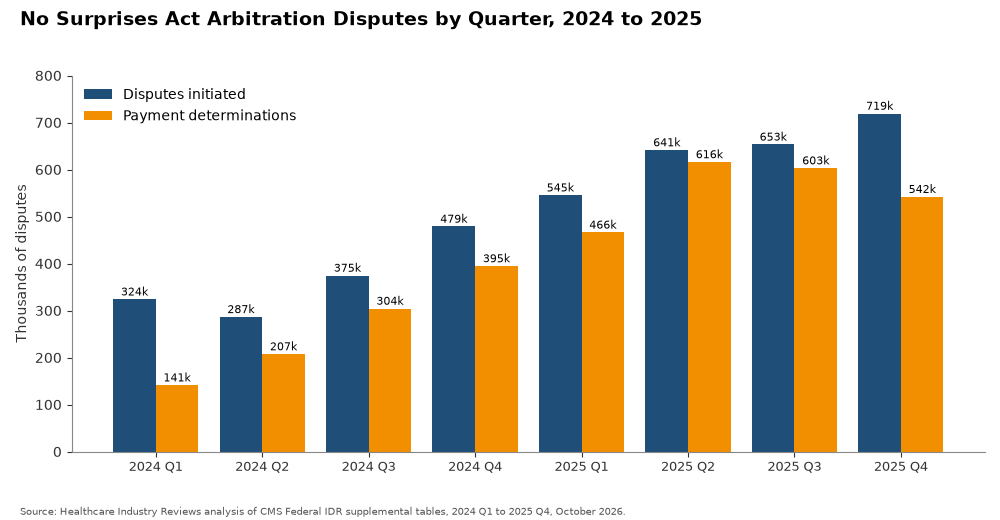
- Plans prevailed in 16.1% of payment determinations in 2025 Q4, the highest rate of any 2025 quarter.
- Determinations where only one party submitted an offer fell from 23.0% in Q1 to 13.2% in Q4.
- Initiations rose every quarter of 2025, from 545,422 in Q1 to 719,118 in Q4.
Top Initiating Parties in No Surprises Act Arbitration
CMS lists the ten parties or representatives that initiated the most disputes each quarter, excluding air ambulance. Eight appeared in the top ten in all four quarters of 2025. Shares below use the 2,516,173 non-air-ambulance disputes initiated in 2025.
| Initiating Party or Representative | 2025 Q1 | 2025 Q2 | 2025 Q3 | 2025 Q4 | 2025 Total | Share of 2025 Disputes | 2024 Total | Change |
|---|---|---|---|---|---|---|---|---|
| HaloMD | 89,777 | 140,520 | 121,155 | 134,467 | 485,919 | 19.3% | 189,865 | +155.9% |
| Team Health | 79,892 | 80,572 | 73,501 | 75,762 | 309,727 | 12.3% | 168,498 | +83.8% |
| SCP Health | 58,917 | 69,643 | 62,099 | 50,451 | 241,110 | 9.6% | 163,621 | +47.4% |
| Radiology Partners | 63,025 | 47,993 | 33,194 | 36,312 | 180,524 | 7.2% | 246,649 | -26.8% |
| F&A Management | 22,025 | 31,012 | 41,975 | 39,683 | 134,695 | 5.4% | Not in top 10 | Not available |
| QMACS | 17,735 | 21,434 | 25,285 | 32,493 | 96,947 | 3.9% | Not in top 10 | Not available |
| M&D Capital Advisors | 13,590 | 17,876 | 27,771 | 35,718 | 94,955 | 3.8% | 7,396 (top 10 in 2024 Q3 only) | Not available |
| US Anesthesia Partners | 13,667 | 15,788 | 16,974 | 17,174 | 63,603 | 2.5% | Not in top 10 | Not available |
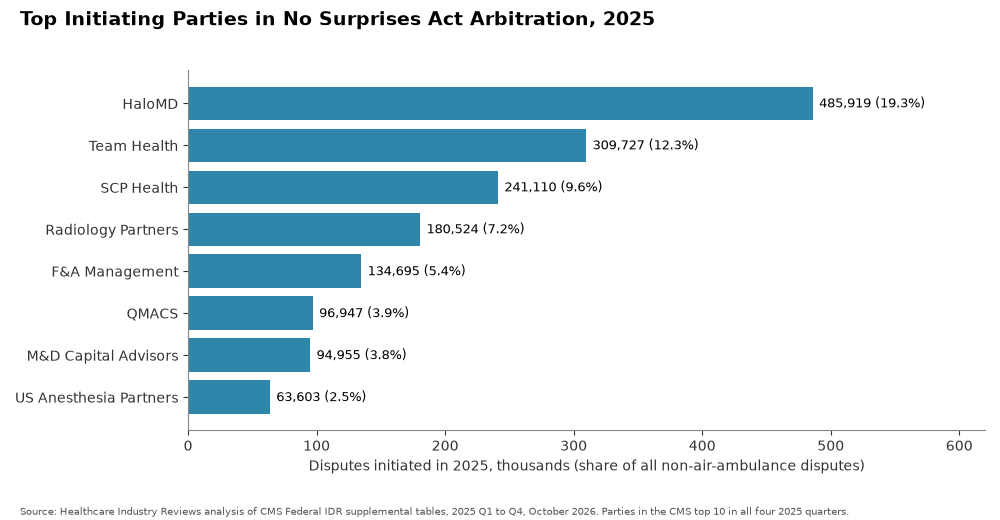
- HaloMD, Team Health and SCP Health initiated 1,036,756 disputes in 2025, or 41.2% of the non-air-ambulance total. CMS's background report for the second half of 2025 puts their share at about 38% for those six months and says the three represent thousands of clinicians across multiple states.
- Radiology Partners was the largest initiator in 2024 Q1 through Q3 and fell to fourth in 2025, with 26.8% fewer disputes.
- Radix entered the top ten in 2025 Q3 and initiated 32,329 disputes in Q4. Envision, Prime Healthcare and RPMG were in the top ten in all four quarters of 2024 and in only one or two quarters of 2025.
Top Non-Initiating Parties in Federal IDR
Non-initiating parties are mostly health plans and the vendors that respond to disputes for them. CMS lists the ten non-initiating parties with the most disputes each quarter. The table shows the parties in that top ten in all four quarters of 2025; BCBS Florida, in the top ten for three quarters with 27,009 disputes, is not shown.
| Non-Initiating Party or Representative | 2025 Disputes | Share of 2025 Disputes |
|---|---|---|
| UnitedHealthcare | 673,110 | 26.8% |
| BCBS Texas | 419,326 | 16.7% |
| Aetna | 328,993 | 13.1% |
| Claritev (formerly MultiPlan) | 279,351 | 11.1% |
| Anthem | 206,169 | 8.2% |
| ClearHealth Strategies | 178,317 | 7.1% |
| Cigna | 79,852 | 3.2% |
| BCBS Arizona | 44,018 | 1.7% |
- UnitedHealthcare was the non-initiating party in 26.8% of 2025 disputes, the largest share in every quarter.
- Disputes naming BCBS Texas rose from 75,181 in Q1 to 129,662 in Q4.
No Surprises Act Arbitration Results by Specialty
Determination counts and quarterly medians come from CMS supplemental Table 14. The provider win rate and the median offers come from our analysis of the 2025 PUF line items in the same CPT ranges.
| Specialty | 2025 Determinations (CMS) | Share of All Determinations Involving the Group | Median Prevailing % of QPA, Q1 / Q2 / Q3 / Q4 (CMS) | Provider Win Rate (PUF) | Median Provider Offer % of QPA (PUF) | Median Plan Offer % of QPA (PUF) | Median Prevailing % of QPA (PUF) |
|---|---|---|---|---|---|---|---|
| Emergency department services | 1,080,884 | 48.5% | 314 / 312 / 324 / 334 | 85.0% | 368% | 100% | 320% |
| Radiology | 377,236 | 16.9% | 469 / 512 / 473 / 398 | 91.0% | 500% | 100% | 471% |
| Anesthesia | 217,142 | 9.7% | 309 / 312 / 326 / 361 | 81.8% | 439% | 117% | 326% |
| Surgery | 194,595 | 8.7% | 1,330 / 1,319 / 1,449 / 1,503 | 86.8% | 1,974% | 100% | 1,394% |
| Neurology and neuromuscular procedures | 144,985 | 6.5% | 2,036 / 2,862 / 2,394 / 2,585 | 86.9% | 3,227% | 100% | 2,427% |
| Pathology and laboratory | 111,500 | 5.0% | 470 / 450 / 452 / 440 | 82.7% | 543% | 100% | 450% |
| Injections and infusions | 66,528 | 3.0% | 368 / 400 / 428 / 424 | 84.6% | 487% | 100% | 410% |
| Critical care | 48,368 | 2.2% | 340 / 338 / 321 / 347 | 87.0% | 365% | 112% | 337% |
| Cardiovascular | 46,131 | 2.1% | 440 / 445 / 474 / 474 | 86.1% | 540% | 100% | 461% |
| Hospital inpatient and observation | 44,899 | 2.0% | 380 / 357 / 358 / 370 | 85.2% | 418% | 100% | 367% |
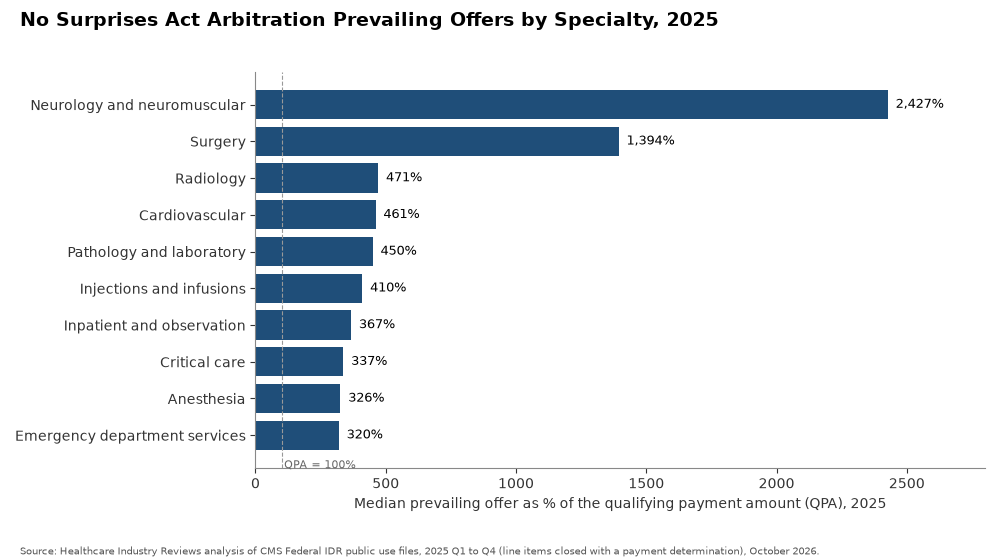
- Emergency department services were involved in 48.5% of 2025 payment determinations, more than any other group. A determination can cover services in more than one group, so the shares add to more than 100%. The median prevailing offer in that group rose from 314% of the QPA in Q1 to 334% in Q4.
- Neurology and neuromuscular procedures had the highest median prevailing offer in the PUF, 2,427% of the QPA. This range includes intraoperative neuromonitoring codes.
- Radiology had the highest provider win rate, 91.0% of decided line items. Its median prevailing offer fell from 512% of the QPA in Q2 to 398% in Q4.
- The median plan offer was exactly 100% of the QPA in eight of the ten groups.
Federal IDR Payment Amounts for Common Service Codes
The PUF also reports dollar amounts for the QPA and each offer. Medians for high-volume service codes are taken over the 2025 line items where that amount is reported.
| Service Code | Description | Line Items | Median QPA | Median Provider Offer | Median Plan Offer | Median Prevailing Offer | Provider Win Rate |
|---|---|---|---|---|---|---|---|
| 99284 | Emergency department visit, moderate | 1,007,416 | $216.05 | $718.48 | $282.65 | $664.02 | 85.3% |
| 99285 | Emergency department visit, high | 586,547 | $292.14 | $921.59 | $365.45 | $870.91 | 84.8% |
| 99283 | Emergency department visit, low | 269,655 | $187.17 | $1,813.84 | $207.80 | $1,250.00 | 83.9% |
| 71045 | Chest X-ray, single view | 112,965 | $11.68 | $99.45 | $16.00 | $99.45 | 91.4% |
| 85025 | Complete blood count with automated differential | 95,633 | $47.30 | $267.87 | $48.92 | $267.87 | 86.0% |
| 74177 | CT abdomen and pelvis with contrast | 95,274 | $146.02 | $1,099.80 | $160.00 | $1,029.70 | 90.0% |
| 77067 | Screening mammography, both breasts | 79,914 | $65.22 | $191.75 | $71.64 | $191.75 | 94.6% |
| 99291 | Critical care, first 30 to 74 minutes | 76,681 | $315.23 | $1,077.00 | $461.16 | $1,041.28 | 87.1% |
| 70450 | CT head without contrast | 67,819 | $69.03 | $414.05 | $83.00 | $387.80 | 90.8% |
| 95938 | Somatosensory evoked potentials | 58,772 | $57.74 | $3,924.12 | $72.10 | $2,560.00 | 86.9% |
| 00812 | Anesthesia for screening colonoscopy | 50,979 | $247.22 | $1,530.00 | $349.68 | $1,130.00 | 77.9% |
| 95941 | Remote neuromonitoring, per hour | 39,461 | $370.68 | $5,382.00 | $406.18 | $4,962.99 | 88.1% |
- For 99284, the most disputed code, the median prevailing offer was $664.02 against a median QPA of $216.05.
- The median prevailing offer for 95938 was $2,560.00 on a median QPA of $57.74.
- Anesthesia for screening colonoscopy, 00812, had the lowest provider win rate in the table, 77.9%.
Federal IDR Outcomes by Initiating Party Type and Practice Size
These figures come from the 2025 PUF line items.
| Group | Line Items | Disputes | Provider Win Rate | Median Provider Offer % of QPA | Median Prevailing % of QPA |
|---|---|---|---|---|---|
| Initiated by health care provider | 3,660,913 | 1,744,090 | 87.6% | 471% | 404% |
| Initiated by health care facility | 2,066,849 | 436,751 | 82.1% | 461% | 377% |
| Fewer than 20 employees | 333,891 | 222,232 | 88.0% | 1,018% | 658% |
| 20 to 50 employees | 2,229,786 | 844,228 | 84.5% | 607% | 507% |
| 51 to 100 employees | 587,141 | 299,955 | 85.5% | 425% | 371% |
| 101 to 500 employees | 1,667,348 | 527,979 | 89.1% | 433% | 394% |
| Over 500 employees | 844,987 | 269,164 | 87.5% | 293% | 270% |
- Practices with fewer than 20 employees had a median prevailing offer of 658% of the QPA. For practices with more than 500 employees it was 270%.
- Facility-initiated line items had a provider win rate of 82.1%, against 87.6% for provider-initiated line items.
Federal IDR Results by Provider Email Domain
The PUF records the email domain of the provider or its representative.
| Provider Email Domain | Line Items | Disputes | Provider Win Rate | Median Provider Offer % of QPA | Median Prevailing % of QPA |
|---|---|---|---|---|---|
| halomd.com | 950,029 | 407,381 | 89.0% | 691% | 613% |
| fam-llc.com | 572,577 | 112,757 | 79.9% | 877% | 671% |
| teamhealth.com | 508,794 | 292,536 | 93.3% | 273% | 263% |
| saparm.com | 428,041 | 117,793 | 95.0% | 637% | 574% |
| primehealthcare.com | 295,208 | 32,064 | 91.2% | 301% | 277% |
| envisionhealth.com | 225,158 | 44,641 | 85.4% | 252% | 227% |
| totalcare.us | 186,198 | 26,005 | 78.7% | 1,249% | 828% |
| agshealth.com | 146,797 | 98,276 | 87.9% | 358% | 343% |
| scp-health.com | 138,261 | 93,861 | 89.5% | 359% | 344% |
| bmhcc.org | 137,536 | 15,005 | 86.0% | 320% | 282% |
- Line items from halomd.com addresses made up 16.6% of all 2025 PUF line items, with a median prevailing offer of 613% of the QPA.
- teamhealth.com line items had a 93.3% provider win rate and a median prevailing offer of 263% of the QPA.
Federal IDR Disputes by State
Texas was the location of service for 2,537,793 line items, 44.3% of the 2025 PUF, and 869,943 disputes.
| State | Line Items | Disputes | Provider Win Rate | Median Prevailing % of QPA |
|---|---|---|---|---|
| Texas | 2,537,793 | 869,943 | 85.8% | 480% |
| Arizona | 440,310 | 160,511 | 83.3% | 479% |
| Florida | 383,413 | 143,284 | 87.6% | 259% |
| Tennessee | 231,473 | 72,486 | 83.8% | 284% |
| California | 210,004 | 69,665 | 88.5% | 263% |
| New York | 172,813 | 79,676 | 86.5% | 538% |
| Georgia | 169,555 | 71,620 | 85.8% | 298% |
| New Jersey | 158,239 | 105,243 | 86.0% | 1,347% |
| Indiana | 135,954 | 70,413 | 87.3% | 359% |
| Oklahoma | 121,061 | 49,638 | 92.4% | 523% |
- New Jersey had the highest median prevailing offer among the ten states, 1,347% of the QPA.
Data Limits for No Surprises Act Arbitration Statistics
The supplemental tables count disputes, and the PUF counts line items, so a bundled dispute with many services appears once in the first and many times in the second. The PUF covers disputes closed with a payment determination in each quarter, so its 2025 totals do not match the supplemental table counts of determinations made. Q1 and Q2 PUF files were generated August 7, 2025, and Q3 and Q4 files January 26, 2026.
Some service codes, such as 99283, appear in both facility and professional claims, which puts very different QPAs in one median. Median offers are calculated over line items with a reported value. Email domains can belong to a provider group, a billing company or a dispute vendor, and one organization can use more than one domain. Plan names in the PUF are free text with many spellings, so plan rankings use the CMS supplemental tables. No 2026 quarter had been published as of October 8, 2026.
Sources
- Healthcare Industry Reviews, No Surprises Act Arbitration Study: analysis of CMS Federal IDR public use files for 2025 and supplemental tables for 2024 and 2025, conducted October 2026.
- Federal IDR process reports and data. Centers for Medicare & Medicaid Services, accessed October 8, 2026.
- Federal IDR public use file, 2025 Q1. CMS, generated August 7, 2025.
- Federal IDR public use file, 2025 Q2. CMS, generated August 7, 2025.
- Federal IDR public use file, 2025 Q3. CMS, generated January 26, 2026.
- Federal IDR public use file, 2025 Q4. CMS, generated January 26, 2026.
- Federal IDR PUF general information. CMS.
- Federal IDR supplemental tables, 2025 Q1 and 2025 Q2. CMS.
- Federal IDR supplemental tables, 2025 Q3 and 2025 Q4. CMS.
- Federal IDR supplemental tables, 2024 Q1, Q2, Q3 and Q4. CMS.
- Supplemental background on Federal IDR PUF, July 1 to December 31, 2025. CMS.
- CMS convenes certified independent dispute resolution entity leaders. CMS readout, October 1, 2026.