Report · Oct 2026
Remote Patient Monitoring Statistics: 2026 Report
Published
Our analysts tallied 20,625,579 remote patient monitoring (RPM) services billed to Original Medicare from 2019 through 2024, matched the 2024 claims to Medicare enrollment in every state, and combined them with two federal inspector general reviews and CMS payment files for 2025 through 2027. Together they show how fast Medicare spending on RPM has grown, where patients use it, which billing patterns regulators question, and what Medicare pays for it as of Q4 2026.
Key Findings
- Medicare paid $536 million for remote patient monitoring in 2024, including Medicare Advantage, up 31% from $408 million in 2023.
- Nearly 1 million Medicare enrollees received RPM in 2024, compared with about 55,000 in 2019.
- Original Medicare RPM services rose 33.8% in 2024, to 7,393,511, and the allowed amount rose 30.7%, to $331.0 million.
- Connecticut had 85.6 Original Medicare patients billed for an RPM device per 1,000 Part B enrollees in 2024, more than six times the US rate of 13.9.
- CMS's 2027 proposal would cut the national rate for the main RPM device code, 99454, from $52.11 in 2026 to $41.38, a 20.6% drop.
With remote patient monitoring, a patient with high blood pressure, diabetes, or heart failure takes readings at home on a connected device, such as a blood pressure cuff or a scale, and the device sends them to the clinician's office. Medicare began widely paying for the service in 2019. A practice bills it in parts: one code for setting up the device and teaching the patient to use it, one for supplying the device each month, and others for the minutes staff spend reviewing the readings and talking with the patient. Use grew quickly during the COVID-19 pandemic and kept growing afterward, and CMS has proposed lower payments for 2027. But the growth has not been even across states, and the Department of Health and Human Services Office of Inspector General (OIG) has questioned some of the billing behind it in two reviews.
We counted RPM services, patients, and allowed amounts for five billing codes from CMS's Medicare Physician & Other Practitioners by Geography and Service files for 2019 through 2024, which cover Original Medicare claims from physicians and other clinicians. We set 2024 state totals against CMS counts of Original Medicare Part B enrollees. We took totals that include Medicare Advantage, along with condition, patient group, and billing pattern findings, from OIG reports published in September 2024 and August 2025, and clinician-type results from a 2025 study in Health Affairs Scholar. Payment rates come from CMS physician fee schedule files for 2025, 2026, and the 2027 proposed rule.
In the following sections, we compare Medicare RPM spending by year, break down Original Medicare billing by code and by state, show which conditions and patients RPM covers and which clinicians provide it, list the billing patterns OIG flagged, and set out Medicare payment rates from 2025 through the 2027 proposal.
How Much Medicare Spends on Remote Patient Monitoring Each Year
Two federal sources track the money from different angles. OIG counts payments across all of Medicare, including private Medicare Advantage plans, while CMS's public claims files cover Original Medicare only but give exact service counts. Setting them side by side shows how much of the spending goes through each part of Medicare.
| Year | All Medicare payments, incl. Medicare Advantage | Change in all-Medicare payments | Medicare enrollees receiving RPM | Original Medicare allowed amount | Original Medicare RPM services |
|---|---|---|---|---|---|
| 2019 | $15 million | Not applicable | About 55,000 | $8.6 million | 162,206 |
| 2020 | $82 million | +447% | Not reported | $55.2 million | 1,040,773 |
| 2021 | $202 million | +146% | Not reported | $133.5 million | 2,487,749 |
| 2022 | $311 million | +54% | More than 570,000 | $196.7 million | 4,013,905 |
| 2023 | $408 million | +31% | An estimated 780,000 | $253.2 million | 5,527,435 |
| 2024 | $536 million | +31% | Nearly 1 million | $331.0 million | 7,393,511 |
Source: Office of Inspector General (OIG), Billing for Remote Patient Monitoring in Medicare, OEI-02-23-00261, August 2025, and Additional Oversight of Remote Patient Monitoring in Medicare Is Needed, OEI-02-23-00260, September 2024 (all-Medicare payments and enrollees); Healthcare Industry Reviews analysis of CMS Medicare Physician & Other Practitioners by Geography and Service files, 2019 to 2024 (Original Medicare columns). The 2023 enrollee figure is our estimate from OIG's reported 27% growth in 2024.
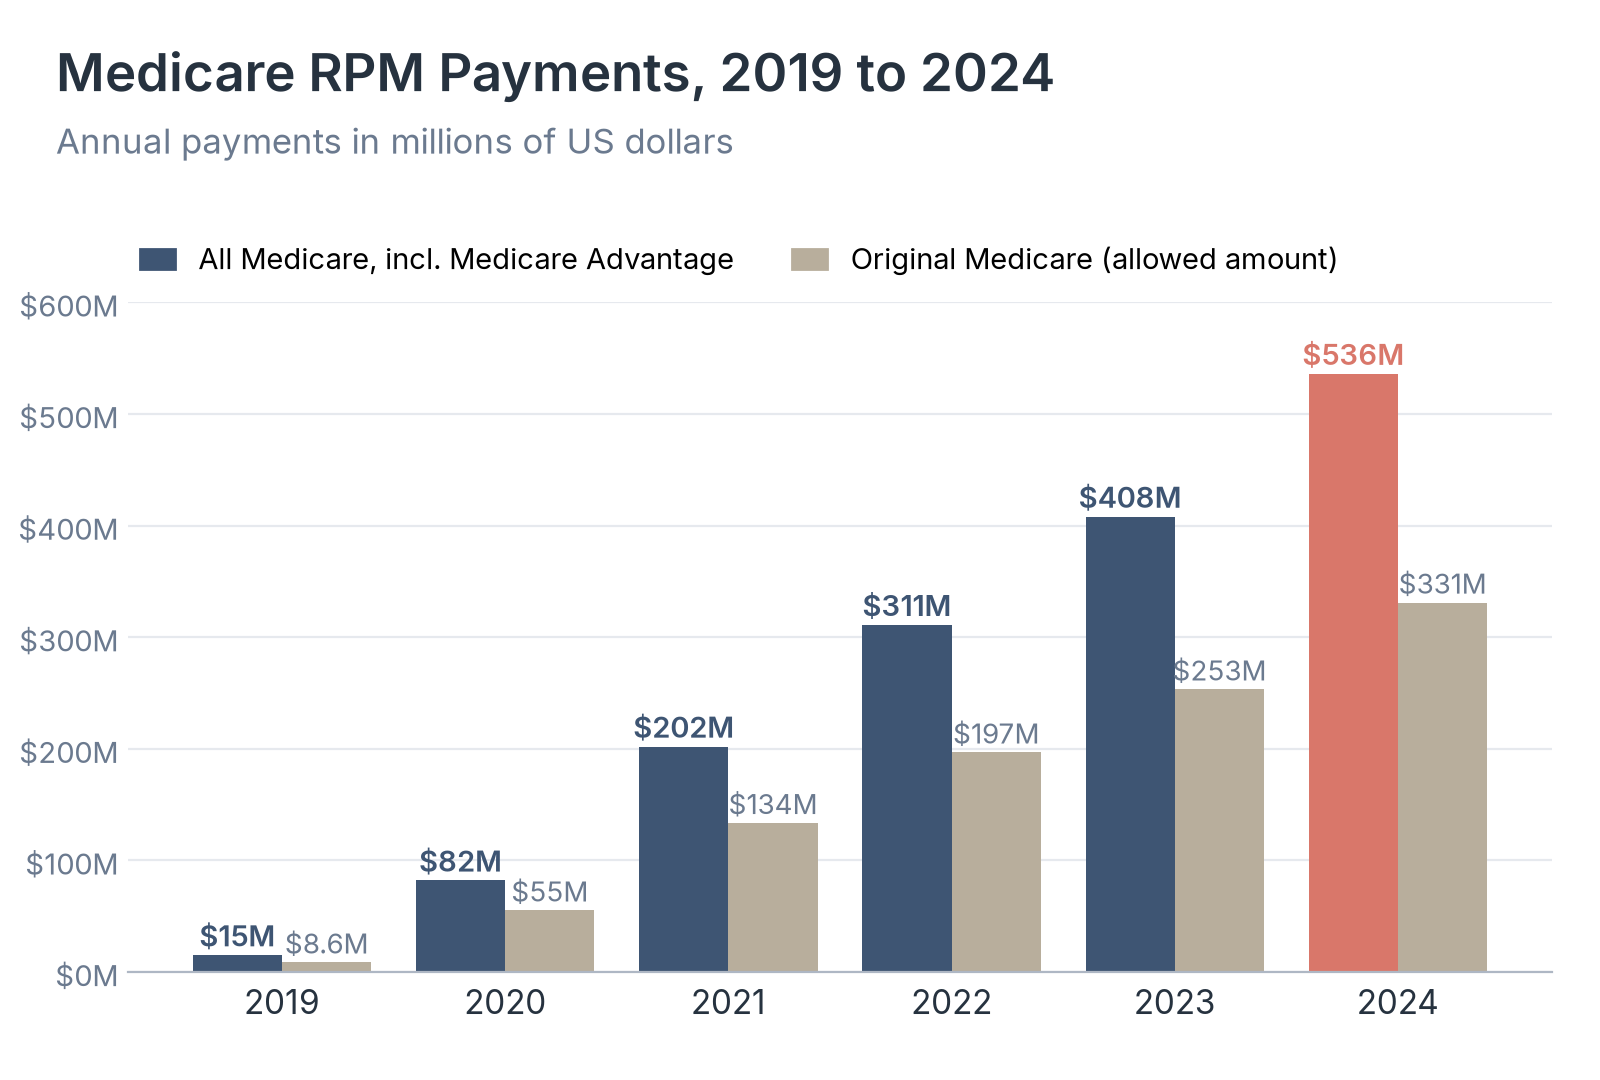
Source: Healthcare Industry Reviews analysis of OIG data snapshot OEI-02-23-00261 and CMS Geography and Service files, 2019 to 2024.
Key Findings
- Growth slowed from 146% in 2021 to 31% in both 2023 and 2024, but the dollar increase in 2024, $128 million, was the largest of any year since 2019.
- Original Medicare accounted for 61.8% of all Medicare RPM payments in 2024 by our comparison, which leaves an estimated $205 million paid through Medicare Advantage plans. For 2022, OIG counted $201 million in traditional Medicare and $110 million in Medicare Advantage.
- Average payments per enrollee doubled from $266 in 2019 to $545 in 2022, partly because patients stayed on monitoring longer, more than 5 months on average in 2022. OIG notes that Medicare sets no limit on how long a patient can be monitored, and that more than 60% of Medicare enrollees have hypertension while only a small fraction receive RPM.
Which Billing Codes Drive Original Medicare RPM Spending
Each RPM code pays for a different part of the work, so the mix of codes shows where the money goes: to the device, to setup, or to the time clinical staff spend with the readings. CMS reports each code separately, along with the number of patients billed for it.
| Code and what it pays for | Services | Patients | Allowed amount | Average allowed per service | Change in services from 2023 |
|---|---|---|---|---|---|
| 99457: First 20 minutes of treatment management in a month | 2,639,411 | 476,230 | $127.9 million | $48.48 | +30.0% |
| 99458: Each additional 20 minutes of treatment management | 2,191,295 | 297,929 | $85.4 million | $38.99 | +46.9% |
| 99454: Device supply with readings on 16 to 30 days | 2,172,131 | 389,342 | $103.8 million | $47.80 | +23.6% |
| 99453: Device setup and patient education | 214,713 | 199,233 | $4.3 million | $20.24 | +20.9% |
| 99091: 30 minutes or more of data review by a clinician, per 30 days | 175,961 | 42,521 | $9.5 million | $53.93 | +149.8% |
| All five codes | 7,393,511 | Not additive | $331.0 million | $44.77 | +33.8% |
Source: Healthcare Industry Reviews analysis of CMS Medicare Physician & Other Practitioners by Geography and Service, 2023 and 2024 national rows. Patient counts are per code and cannot be added across codes.
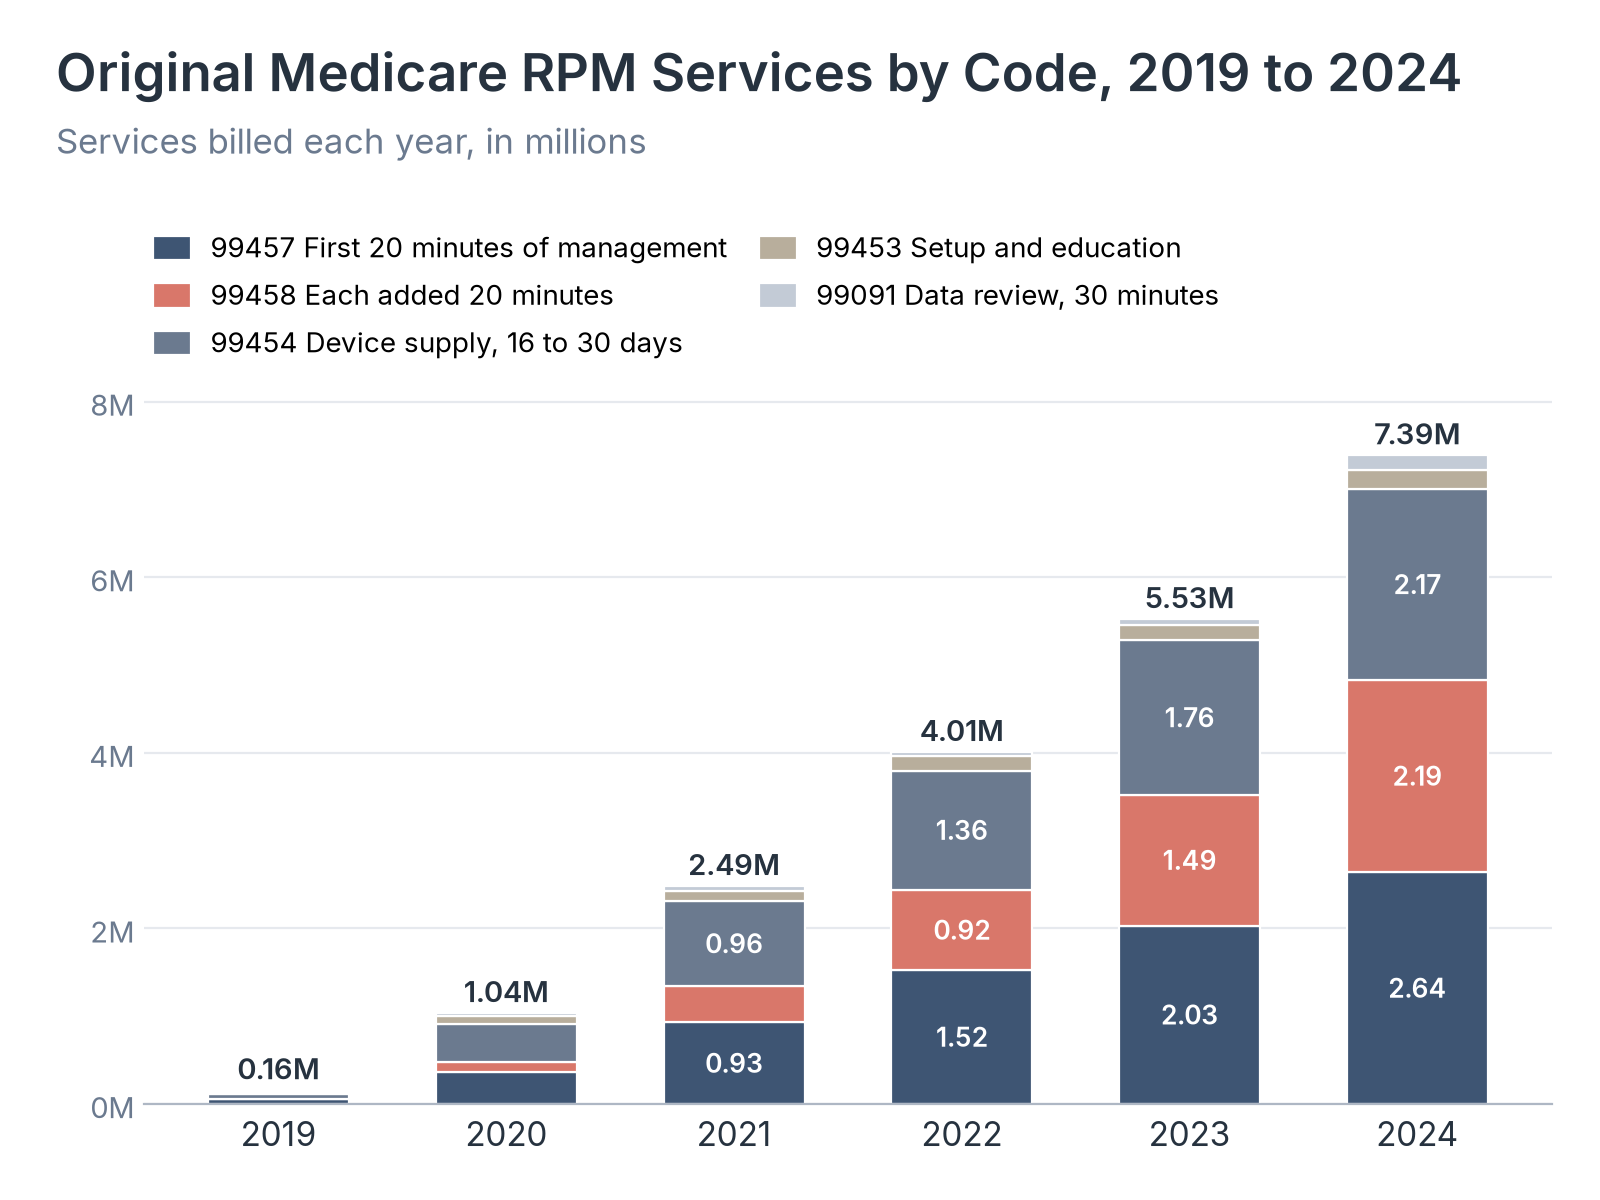
Source: Healthcare Industry Reviews analysis of CMS Geography and Service files, 2019 to 2024.
Key Findings
- The two treatment management codes, 99457 and 99458, accounted for 64.5% of Original Medicare RPM allowed dollars in 2024, up from 32.8% in 2019, when 99458 did not yet appear in the claims data.
- More patients had the first 20 minutes of management billed (476,230) than had a device billed (389,342). Patients billed for a device averaged 5.6 months of device billing in 2024, up from 3.4 months in 2019.
- Billing for 99091, which pays a physician or other qualified professional for 30 minutes or more of reviewing a patient's data, rose 149.8% in 2024, and 99458 rose 46.9%. As time-based codes grow, more of each patient's RPM bill depends on staff minutes, and CMS's 2027 proposal would pay for RPM work only when the practice's own employed clinical staff do it.
Which States Use Remote Patient Monitoring Most
A national total says little about whether RPM is common where a reader lives or practices. We divided each state's Original Medicare patients billed for an RPM device in 2024 by its Original Medicare Part B enrollees, which adjusts for the size of each state's Medicare population.
| State | Rank | Part B enrollees | Patients billed for an RPM device | Device patients per 1,000 enrollees | RPM services | RPM allowed amount |
|---|---|---|---|---|---|---|
| Connecticut | 1 | 256,436 | 21,952 | 85.6 | 239,513 | $10.7 million |
| District of Columbia | 2 | 49,401 | 1,517 | 30.7 | 15,087 | $0.7 million |
| California | 3 | 2,823,811 | 71,965 | 25.5 | 1,474,939 | $72.3 million |
| Arizona | 4 | 631,179 | 15,981 | 25.3 | 284,811 | $12.1 million |
| Georgia | 5 | 734,878 | 16,281 | 22.2 | 351,511 | $14.5 million |
| New York | 6 | 1,534,407 | 33,835 | 22.1 | 531,081 | $25.7 million |
| Texas | 7 | 1,800,124 | 39,322 | 21.8 | 837,023 | $36.6 million |
| Nevada | 8 | 238,972 | 4,822 | 20.2 | 73,136 | $3.2 million |
| Florida | 9 | 1,920,544 | 36,072 | 18.8 | 756,010 | $33.1 million |
| New Jersey | 10 | 866,802 | 14,843 | 17.1 | 280,087 | $13.9 million |
| Virginia | 11 | 876,700 | 14,947 | 17.0 | 263,884 | $11.9 million |
| Maryland | 12 | 713,236 | 11,833 | 16.6 | 192,646 | $9.5 million |
| Tennessee | 13 | 600,705 | 9,720 | 16.2 | 185,858 | $7.4 million |
| Missouri | 14 | 528,911 | 8,328 | 15.7 | 108,842 | $4.5 million |
| Alabama | 15 | 374,505 | 5,486 | 14.6 | 84,537 | $3.4 million |
| Utah | 16 | 183,494 | 2,479 | 13.5 | 53,025 | $2.1 million |
| Iowa | 17 | 385,977 | 4,904 | 12.7 | 71,544 | $2.9 million |
| Louisiana | 18 | 348,999 | 4,422 | 12.7 | 70,597 | $2.8 million |
| Delaware | 19 | 148,296 | 1,853 | 12.5 | 35,430 | $1.5 million |
| Michigan | 20 | 725,592 | 8,808 | 12.1 | 153,240 | $6.6 million |
| South Carolina | 21 | 596,287 | 6,357 | 10.7 | 111,559 | $4.7 million |
| Illinois | 22 | 1,165,852 | 12,212 | 10.5 | 215,501 | $9.5 million |
| Arkansas | 23 | 325,489 | 3,393 | 10.4 | 50,912 | $1.9 million |
| Mississippi | 24 | 325,668 | 3,366 | 10.3 | 57,078 | $2.2 million |
| Hawaii | 25 | 101,899 | 928 | 9.1 | 19,260 | $0.9 million |
| New Mexico | 26 | 196,375 | 1,712 | 8.7 | 26,363 | $1.1 million |
| Oklahoma | 27 | 409,204 | 3,520 | 8.6 | 67,768 | $2.7 million |
| Kansas | 28 | 346,960 | 2,467 | 7.1 | 56,262 | $2.3 million |
| North Carolina | 29 | 855,652 | 5,667 | 6.6 | 114,973 | $4.7 million |
| Idaho | 30 | 175,635 | 1,155 | 6.6 | 18,241 | $0.7 million |
| Nebraska | 31 | 223,273 | 1,409 | 6.3 | 32,118 | $1.3 million |
| Indiana | 32 | 604,352 | 3,301 | 5.5 | 64,381 | $2.6 million |
| Colorado | 33 | 412,725 | 2,248 | 5.4 | 49,931 | $2.2 million |
| Alaska | 34 | 101,089 | 549 | 5.4 | 6,765 | $0.3 million |
| Washington | 35 | 645,061 | 3,126 | 4.8 | 59,759 | $2.6 million |
| Oregon | 36 | 357,403 | 1,635 | 4.6 | 44,795 | $2.0 million |
| Pennsylvania | 37 | 1,155,774 | 5,147 | 4.5 | 83,260 | $3.7 million |
| Kentucky | 38 | 395,270 | 1,760 | 4.5 | 40,588 | $1.6 million |
| South Dakota | 39 | 111,005 | 490 | 4.4 | 7,338 | $0.3 million |
| Massachusetts | 40 | 792,734 | 3,478 | 4.4 | 65,202 | $2.9 million |
| New Hampshire | 41 | 188,973 | 764 | 4.0 | 11,883 | $0.5 million |
| Ohio | 42 | 941,249 | 3,105 | 3.3 | 71,875 | $2.8 million |
| Minnesota | 43 | 384,792 | 1,110 | 2.9 | 14,798 | $0.6 million |
| Wyoming | 44 | 94,911 | 248 | 2.6 | 4,634 | $0.2 million |
| West Virginia | 45 | 179,712 | 372 | 2.1 | 6,941 | $0.3 million |
| Maine | 46 | 135,007 | 268 | 2.0 | 4,755 | $0.2 million |
| Wisconsin | 47 | 486,625 | 871 | 1.8 | 12,164 | $0.5 million |
| Montana | 48 | 165,346 | 232 | 1.4 | 6,148 | $0.3 million |
| North Dakota | 49 | 85,177 | 56 | 0.7 | 1,104 | $0.0 million |
| Rhode Island | 50 | 74,980 | 43 | 0.6 | 1,096 | $0.1 million |
| Vermont | 51 | 98,264 | 22 | 0.2 | 233 | $0.0 million |
| United States | Not ranked | 27,982,142 | 389,342 | 13.9 | 7,393,511 | $331.0 million |
Source: Healthcare Industry Reviews analysis of CMS Medicare Physician & Other Practitioners by Geography and Service, 2024 state rows, and CMS Medicare Monthly Enrollment, 2024 annual Original Medicare Part B enrollees. States are assigned by where the clinician who furnished the service practices.
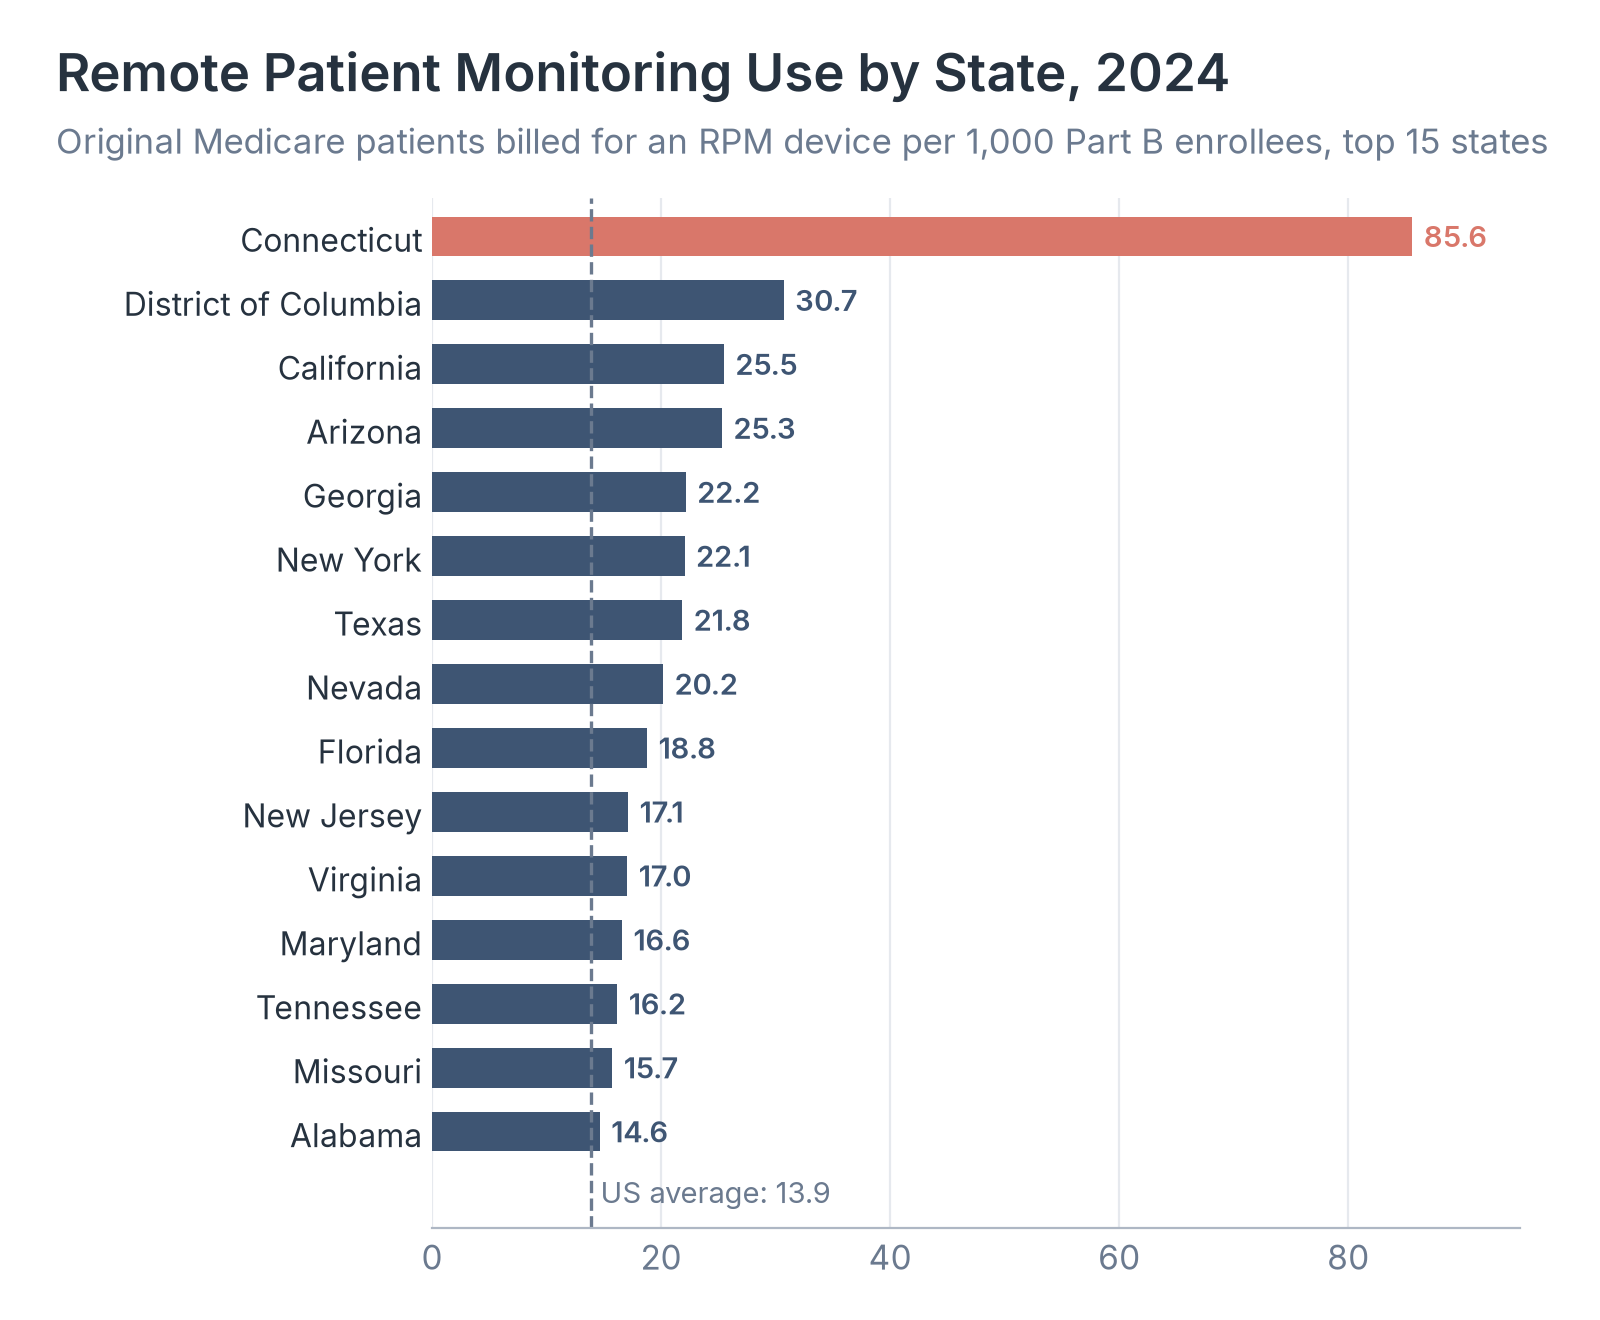
Source: Healthcare Industry Reviews analysis of CMS Geography and Service and Medicare Monthly Enrollment files, 2024.
Key Findings
- Fourteen states and the District of Columbia had rates above the US figure, and the median among the 50 states and DC was 8.7 device patients per 1,000 enrollees. Seventeen states were below 5.0, with Vermont lowest at 0.2, followed by Rhode Island at 0.6 and North Dakota at 0.7.
- California had the largest RPM allowed amount, $72.3 million, or 21.9% of the state-level total, followed by Texas at $36.6 million and Florida at $33.1 million.
- CMS assigns services to the state where the clinician who furnished them practices, so a few large practices can move a state's rate. OIG found one practice that billed RPM for nearly 3,400 new enrollees in a single month of 2024.
Who Receives and Who Provides Remote Patient Monitoring
Medicare covers RPM for any chronic or acute condition, so it helps to know what patients use it for and who provides it. OIG broke down 2022 use by condition and by patient group, and the Health Affairs Scholar study sorted 2019 to 2023 services by clinician specialty.
| Condition | Enrollees | Share of enrollees receiving RPM |
|---|---|---|
| Essential hypertension | 313,328 | 55% |
| Diabetes with complication | 53,227 | 9% |
| Diabetes without complication | 39,474 | 7% |
| Sleep-wake disorders | 30,971 | 5% |
| Disorders of lipid metabolism | 23,681 | 4% |
| Heart failure | 21,838 | 4% |
| Chronic kidney disease | 20,190 | 4% |
| COPD and bronchiectasis | 14,902 | 3% |
| Hypertension with complications | 13,203 | 2% |
| Coronary atherosclerosis and other heart disease | 11,344 | 2% |
Source: OIG, Additional Oversight of Remote Patient Monitoring in Medicare Is Needed, OEI-02-23-00260, September 2024 (Appendix A). Enrollees may have more than one condition.
| Patient group | Enrollees receiving RPM per 1,000 |
|---|---|
| All Medicare enrollees | 8 |
| Black | 15 |
| Hispanic | 11 |
| Asian/Pacific Islander | 11 |
| White | 7 |
| Dually eligible for Medicare and Medicaid | 14 |
| Medicare only | 7 |
| Female | 9 |
| Male | 8 |
| Over 84 | 11 |
| 75 to 84 | 10 |
| Under 65 | 8 |
| 65 to 74 | 7 |
| Urban | 9 |
| Rural | 6 |
| Traditional Medicare | 9 |
| Medicare Advantage | 8 |
Source: OIG, Additional Oversight of Remote Patient Monitoring in Medicare Is Needed, OEI-02-23-00260, September 2024 (Appendix C).
| Clinician type | Services, 2019 | Services, 2023 | Payments, 2019 | Payments, 2023 | Share of services, 2019 to 2023 |
|---|---|---|---|---|---|
| Primary care | 79,797 | 2,501,631 | $4,348,826 | $118,137,766 | 48% |
| Medical subspecialty | 46,199 | 2,272,412 | $2,504,771 | $106,928,383 | 38% |
| Other specialty | 34,409 | 741,311 | $1,684,756 | $30,309,765 | 14% |
| All clinicians | 160,595 | 5,515,442 | $8,548,950 | $255,379,855 | 100% |
Source: Joo, Lieu, Tang, Browne, Agusala, and Liao, Trends in Utilization of Remote Monitoring in the United States, Health Affairs Scholar, June 6, 2025.
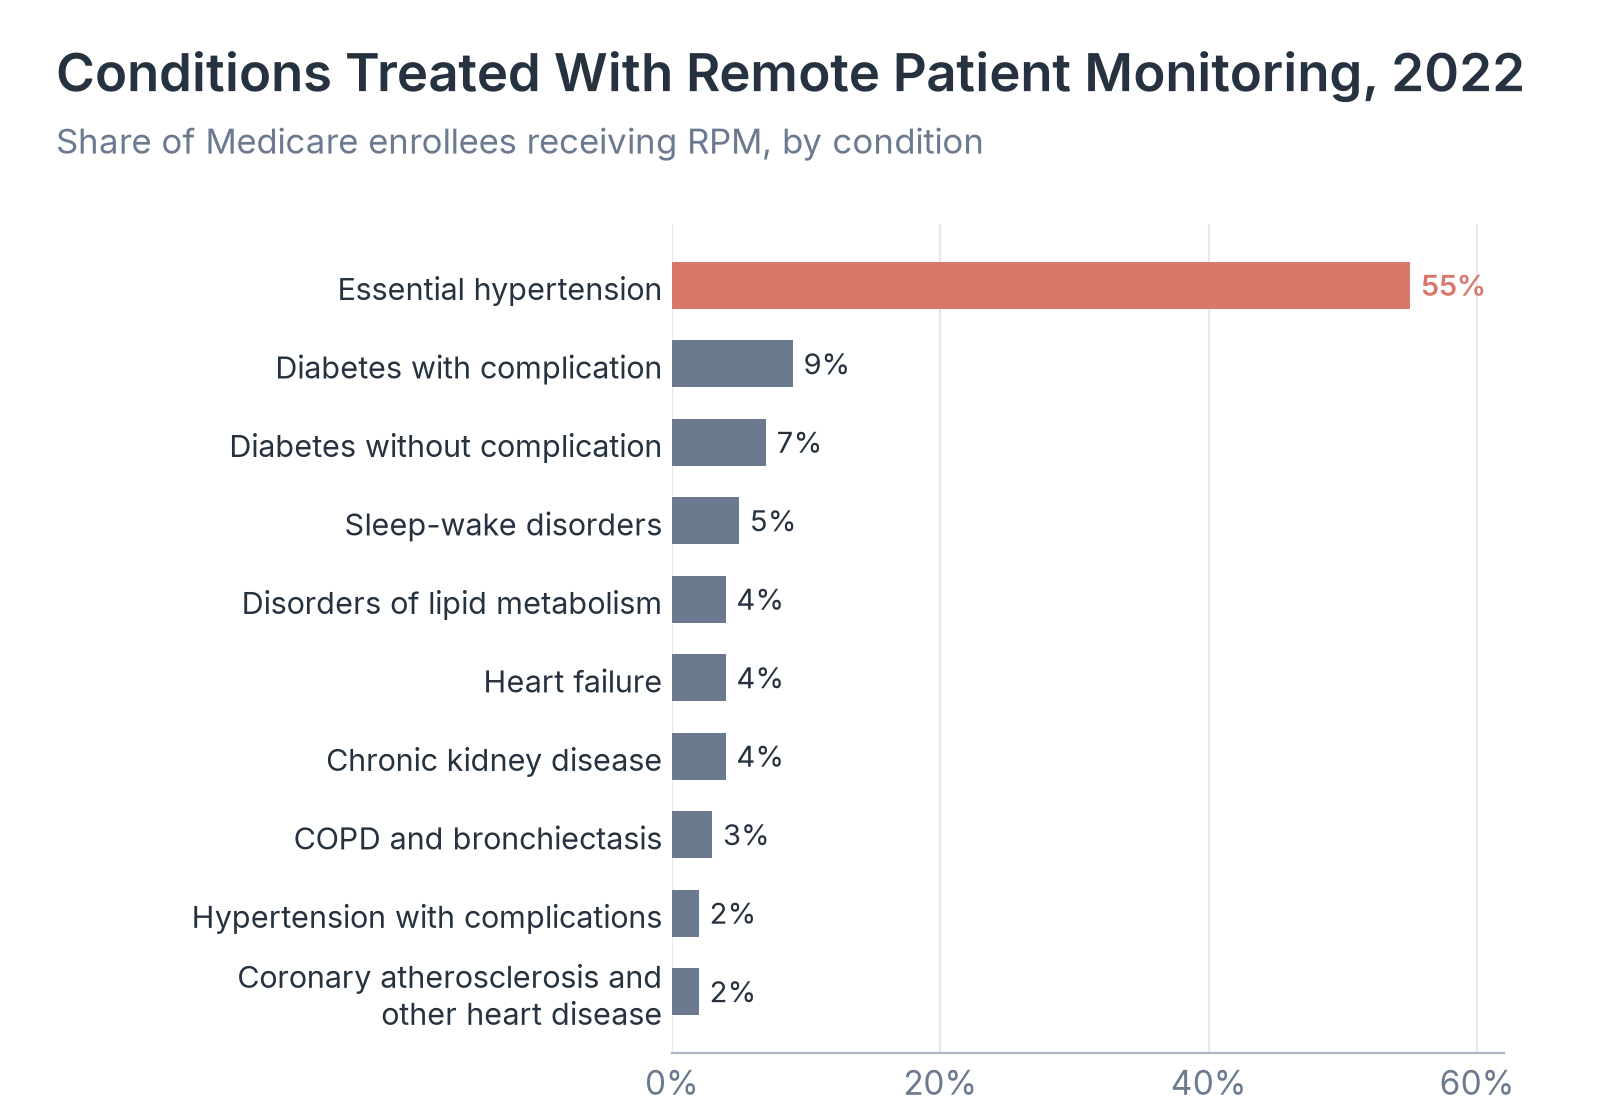
Source: Healthcare Industry Reviews analysis of OIG report OEI-02-23-00260 (Appendix A).
Key Findings
- More than half of enrollees receiving RPM in 2022 used it for hypertension, and diabetes with or without complications accounted for 15%. OIG found 94% received RPM for chronic conditions and about 7% for an acute condition.
- Black enrollees received RPM at 15 per 1,000, about twice the rate of White enrollees, and dually eligible enrollees at 14 per 1,000, twice the rate of those with Medicare only. Rural enrollees trailed urban enrollees, 6 per 1,000 against 9.
- Primary care clinicians delivered 48% of RPM services from 2019 to 2023, but medical subspecialists such as cardiologists grew faster, by 4,819%. The same study found that 92% of RPM services from 2019 to 2023 took place in physician offices and only 4% at home.
Where Federal Inspectors See Risk in RPM Billing
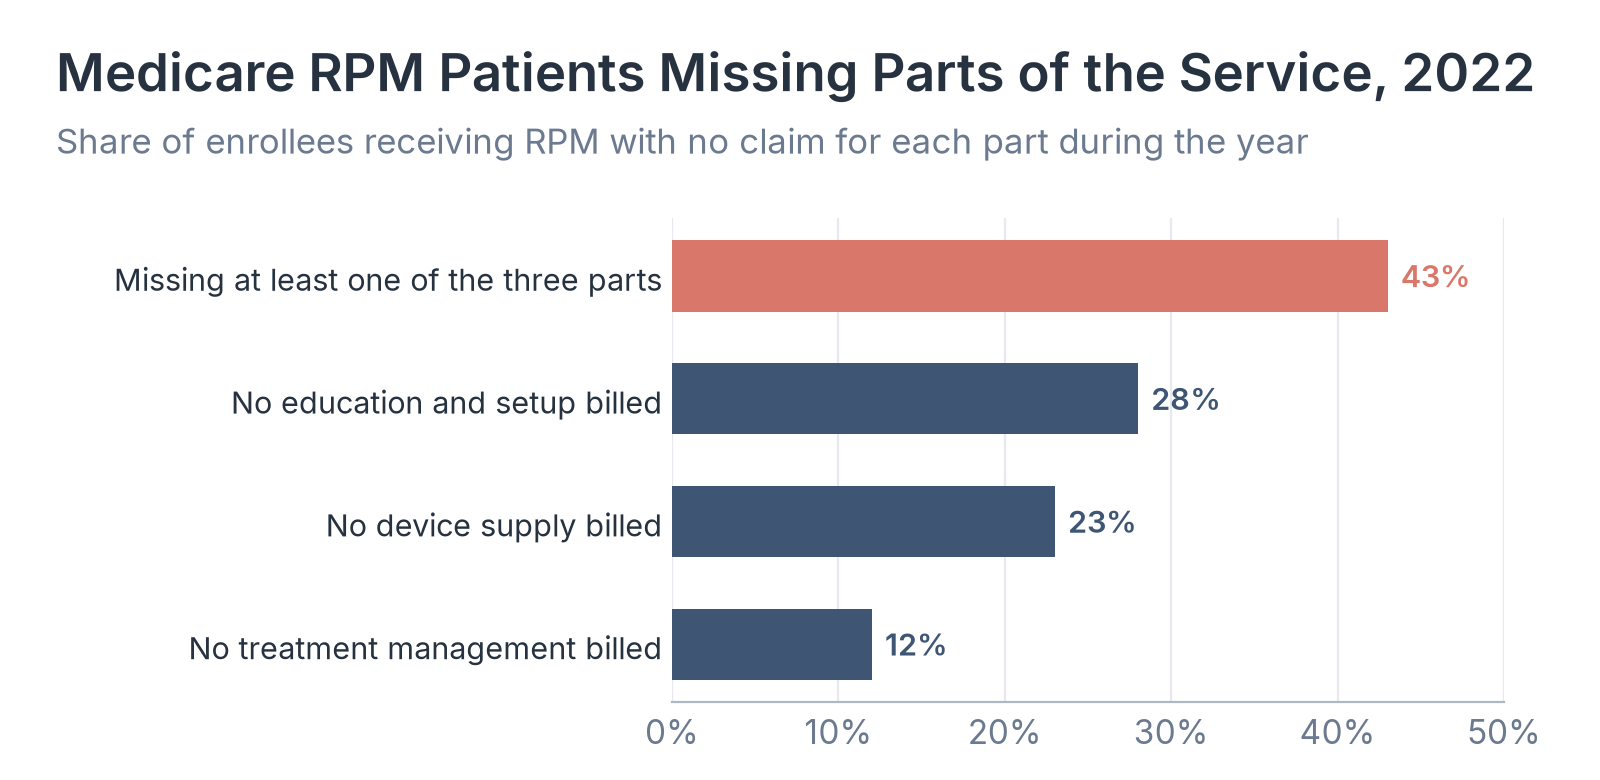
Fast growth in a Medicare service draws attention from the agency that investigates fraud and waste. OIG looked at whether patients received every part of RPM in 2022 and, in its 2024 data, which practices billed far outside the normal range. Its counts give a sense of how widespread each pattern is.
| Billing pattern | Count or share | Year |
|---|---|---|
| Enrollees missing at least one of the three parts of RPM | 43% (about 244,000 enrollees) | 2022 |
| Enrollees missing two of the three parts | About 113,000 enrollees | 2022 |
| Enrollees with no education and setup billed | 28% | 2022 |
| Enrollees with no device supply billed | 23% | 2022 |
| Enrollees with no treatment management billed by any provider | 12% | 2022 |
| Medical practices that billed any RPM | 10,388 | 2024 |
| Practices that routinely billed RPM (10 or more enrollees and more than 100 services) | 4,639 | 2024 |
| Practices with a one-month jump of at least 150% and 100 new enrollees | 32 | 2024 |
| Practices with no prior visit for more than 80% of their RPM patients | 45 | 2024 |
| Practices where more than 75% of enrollees never had treatment management billed | 52 | 2024 |
| Practices billing for more than 25% of enrollees also billed by two or more other practices | 34 | 2024 |
| Practices billing two or more devices per enrollee in a month more than 100 times | About 20 | 2024 |
Source: OIG, Additional Oversight of Remote Patient Monitoring in Medicare Is Needed, OEI-02-23-00260, September 2024 (2022 rows), and Billing for Remote Patient Monitoring in Medicare, OEI-02-23-00261, August 2025 (2024 rows). Data include Original Medicare and Medicare Advantage.
Source: Healthcare Industry Reviews analysis of OIG report OEI-02-23-00260.
Key Findings
- Most commonly, patients had no claim for setup and education (28%) or for a device (23%). Without the device claim, a patient either did not get a connected device from the practice or did not send readings on at least 16 days in any month.
- The typical practice that billed RPM routinely in 2024 billed for about 70 enrollees and added about 5 new enrollees a month. The outliers were far larger: one practice had no prior visit with more than 30,000 of its RPM patients, and another billed for multiple devices for the same enrollee in a month about 1,700 times.
- OIG recommended that CMS add safeguards and require the ordering clinician on RPM claims. CMS says the bundled G-codes it is considering for 2027 would address recommendations from recent OIG reports, and OIG notes that its measures flag practices for review without proving fraud.
What Medicare Pays for RPM, 2025 to the 2027 Proposal
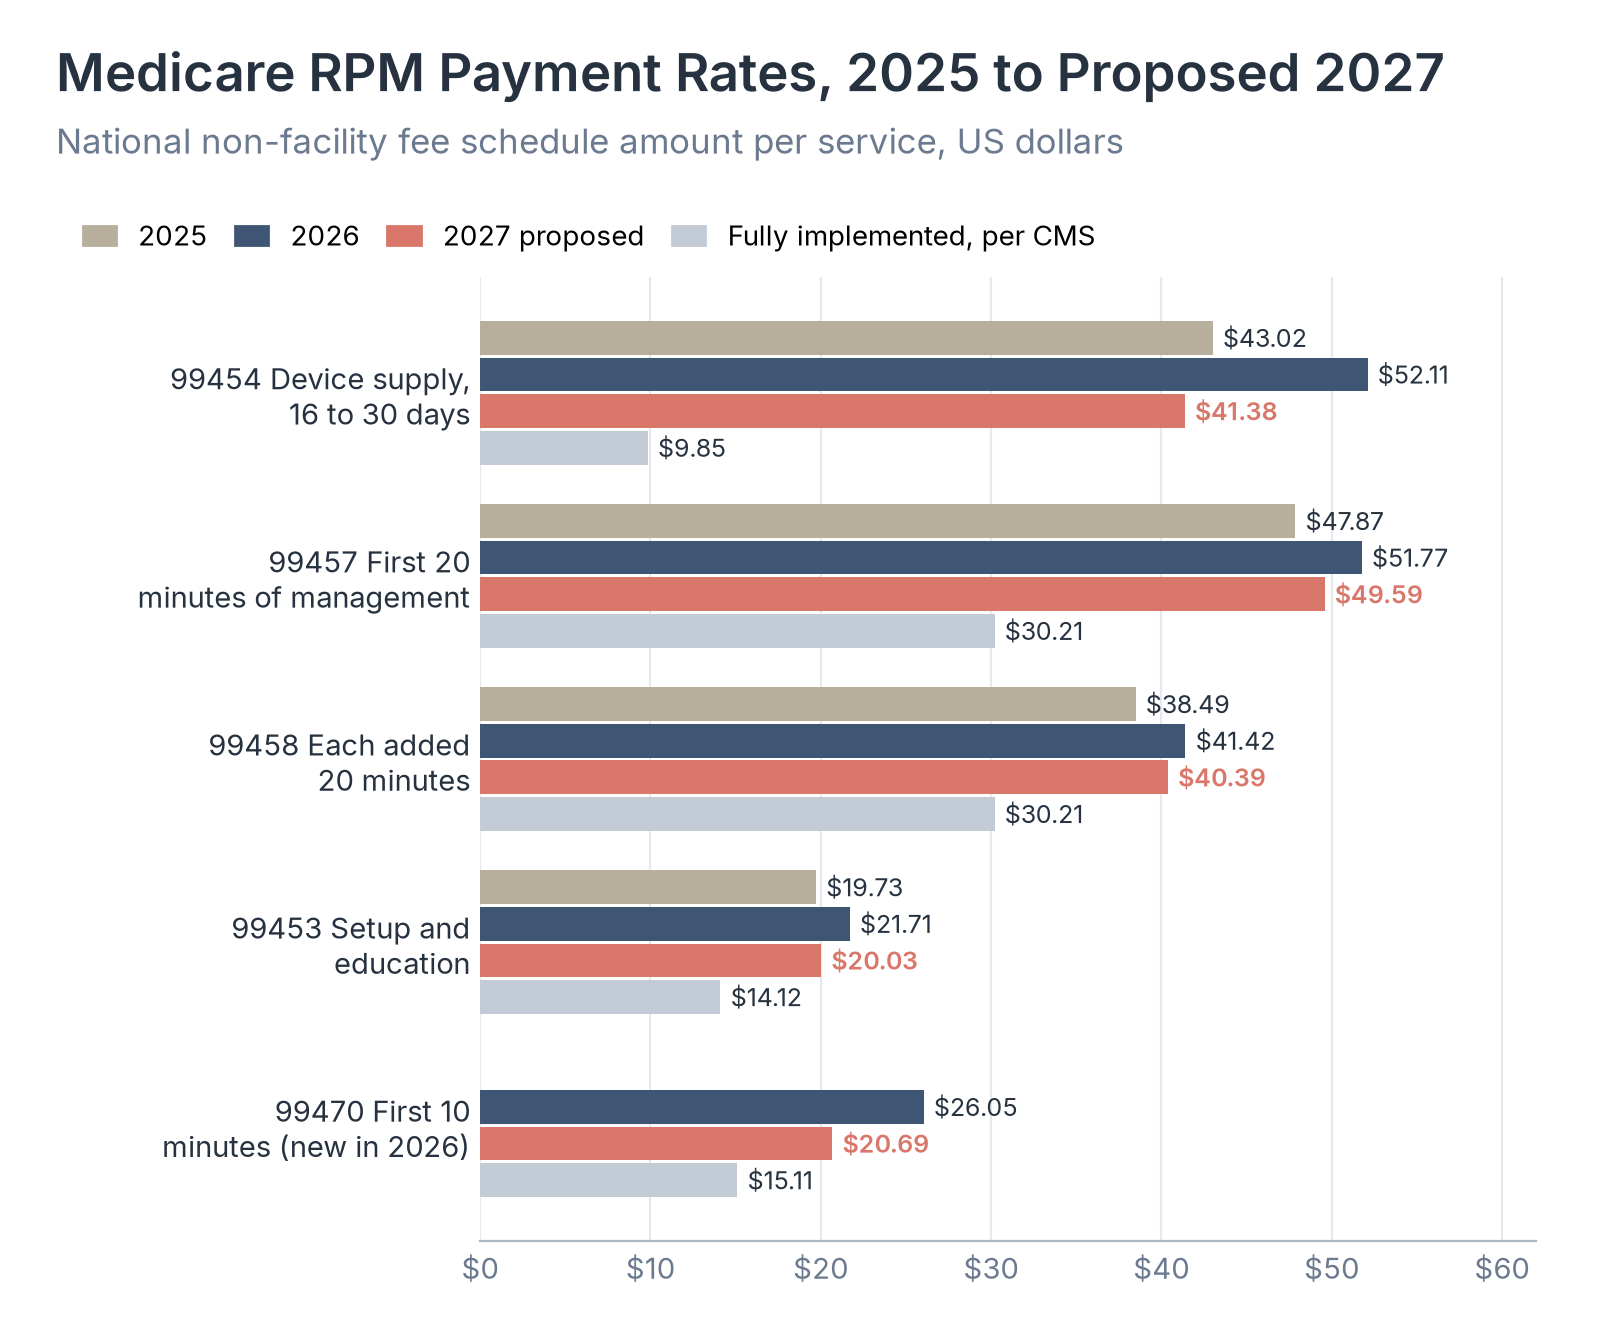
For practices and the companies that supply them, the rate for each code sets what Medicare pays for each month of a patient's monitoring. We converted CMS's relative value units into national dollar amounts for each year and added the rule changes that took effect in 2026 or are proposed for 2027.
| Code and service | 2025 | 2026 | 2027 proposed | Change, 2026 to 2027 proposed | Fully implemented 2027 values |
|---|---|---|---|---|---|
| 99454: Device supply, 16 to 30 days | $43.02 | $52.11 | $41.38 | -20.6% | $9.85 |
| 99445: Device supply, 2 to 15 days (new in 2026) | Not billable | $52.11 | $41.38 | -20.6% | $9.85 |
| 99457: First 20 minutes of management | $47.87 | $51.77 | $49.59 | -4.2% | $30.21 |
| 99470: First 10 minutes of management (new in 2026) | Not billable | $26.05 | $20.69 | -20.6% | $15.11 |
| 99458: Each added 20 minutes of management | $38.49 | $41.42 | $40.39 | -2.5% | $30.21 |
| 99453: Setup and education | $19.73 | $21.71 | $20.03 | -7.7% | $14.12 |
| 99091: 30 minutes of data review | $51.75 | $55.45 | $54.51 | -1.7% | $54.51 |
Source: Healthcare Industry Reviews analysis of CMS PFS Relative Value Files (RVU25D and RVU26D, non-qualifying APM conversion factors of $32.3465 and $33.4009) and CY 2027 PFS Proposed Rule (CMS-1848-P) addenda (Addendum B and Fully Implemented PE RVUs, with the proposed $32.84 conversion factor from the CY 2027 Medicare Physician Fee Schedule Proposed Rule fact sheet). National non-facility amounts before geographic adjustment.
| Change | What it does | Status |
|---|---|---|
| New short-duration device code, 99445 | Pays for device supply when a patient sends readings on 2 to 15 days in a 30-day period. Before 2026, practices could bill device supply only for 16 days or more. | In effect since January 1, 2026 |
| New 10-minute management code, 99470 | Pays for 10 to 19 minutes of treatment management in a month. Before 2026, the shortest billable block was 20 minutes. | In effect since January 1, 2026 |
| Hospital outpatient data in rate setting | CMS uses hospital outpatient cost data to set relative rates for some remote monitoring services. | Finalized for 2026 |
| Initiating visit | Practices would have to furnish a separately billable visit when RPM or remote therapeutic monitoring starts. | Proposed for 2027 |
| Employed staff only | Medicare would pay for RPM work only when clinical staff employed by the practice do it, not contractors. | Proposed for 2027 |
| Lower device valuation | CMS proposes to revalue RPM codes because devices may cost less than its original estimates. | Proposed for 2027 |
| Four new G-codes | CMS is seeking comments on bundling the RPM and remote therapeutic monitoring codes into four new HCPCS G-codes. | Under consideration for 2027 |
Source: Robin Tripp, Understanding 2026 Code Updates for Remote Monitoring, Journal of AHIMA, February 3, 2026; CMS, CY 2026 Medicare Physician Fee Schedule Final Rule fact sheet; CMS, CY 2027 Medicare Physician Fee Schedule Proposed Rule fact sheet.
Source: Healthcare Industry Reviews analysis of CMS RVU25D, RVU26D, and CY 2027 proposed rule addenda.
Key Findings
- The 2026 fee schedule raised the device supply rate 21.1%, from $43.02 to $52.11, and the new 2-to-15-day device code, 99445, pays the same $52.11 as the 16-to-30-day code.
- A typical month for one patient, billed as device supply plus the first 20 minutes of management, pays $103.88 in 2026 and would pay $90.97 under the 2027 proposal, about the same as the $90.89 it paid in 2025.
- CMS's file of fully implemented values puts the device code at $9.85 and the same typical month at $40.06, which shows how far rates could fall once the statutory phase-in of large cuts runs its course. Practices that use outside companies' staff for monitoring calls would also have to move that work in-house to keep billing for it if the employed-staff proposal is finalized.
What Remote Patient Monitoring Statistics Mean for 2027
For a Medicare patient with high blood pressure, these figures mean the chance of being sent home with a cuff that reports readings to the doctor depends heavily on where the patient is treated. A patient whose clinician practices in Connecticut or California is far more likely to have a monitoring device billed than one in Wisconsin or Vermont.
For practices and the companies that sell devices and monitoring services, the question for 2027 and later years is whether a program still covers its costs at lower device rates, with more of its revenue coming from staff time.
The broader trend is closer federal checking of whether each part of the service, from the device to the readings to the follow-up call, is delivered. So if you run or sell an RPM program, compare your billing against the code mix, state rates, and OIG measures in these tables before CMS finalizes its 2027 payment rules.
Data Collection and Methodology
We downloaded the national and state rows for five RPM codes (99091, 99453, 99454, 99457, and 99458) from the CMS Medicare Physician & Other Practitioners by Geography and Service files for 2019 through 2024 through the data.cms.gov API in October 2026. These files cover Original Medicare Part B claims from physicians and other clinicians and exclude Medicare Advantage. We summed services across facility and non-facility rows and calculated allowed amounts as services times the average allowed amount for each row. The allowed amount is the Medicare payment plus the patient's share of the cost. Medicare's own payments were $256.2 million of the $331.0 million allowed in 2024. The new 2026 codes 99445 and 99470 do not appear in claims through 2024. These are the same five codes OIG and the Health Affairs Scholar study used, and our national service totals came within 1.0% of the study's published totals for 2019 and 2023.
Patient counts are reported per code and setting, so we added facility and non-facility counts, which may count a patient twice if billed in both. State rows assign services to the state where the clinician who furnished them practices, not where the patient lives. Because some patients are billed by clinicians in more than one state, the state counts add up to 400,381 device patients against a national count of 389,342. State rates divide device patients (code 99454) by each state's 2024 annual Original Medicare Part B enrollees from the CMS Medicare Monthly Enrollment file. The state table covers the 50 states and the District of Columbia.
All-Medicare payment and enrollee figures come from OIG, which counts Original Medicare claims (including patient cost sharing) and Medicare Advantage encounter data (which may exclude cost sharing and is incomplete in some cases). OIG's 2024 figures use data as of June 5, 2025. Because the OIG and CMS series cover different scopes, we show them in separate columns and do not combine them. Our Original Medicare total for 2022 ($196.7 million) is about 2% below OIG's traditional Medicare figure for that year ($201 million). The 2023 enrollee figure is an estimate: OIG reports nearly 1 million enrollees in 2024 and 27% growth from 2023, which implies about 780,000. The 2024 Medicare Advantage figure is an estimate equal to OIG's $536 million total minus our $331.0 million Original Medicare allowed amount.
Payment rates are national non-facility amounts: total relative value units for each code times the conversion factor for clinicians who are not qualifying alternative payment model participants ($32.3465 for 2025, $33.4009 for 2026, and the proposed $32.84 for 2027). They do not include geographic adjustment. The fully implemented values use CMS's published practice expense units without the statutory phase-in of large decreases, plus the proposed work and malpractice units. We calculated products, differences, and ratios from the published values.
Sources
- Healthcare Industry Reviews, Remote Patient Monitoring Study: analysis of Original Medicare RPM claims from the CMS Geography and Service files for 2019 to 2024, 2024 Medicare enrollment by state, and CMS physician fee schedule files for 2025 to 2027, conducted October 2026.
- Office of Inspector General, US Department of Health and Human Services. Billing for Remote Patient Monitoring in Medicare. Data snapshot OEI-02-23-00261, August 2025.
- Office of Inspector General, US Department of Health and Human Services. Additional Oversight of Remote Patient Monitoring in Medicare Is Needed. Report OEI-02-23-00260, September 19, 2024.
- Joo JH, Lieu N, Tang Y, Browne DS, Agusala B, Liao JM. Trends in Utilization of Remote Monitoring in the United States. Health Affairs Scholar, June 6, 2025.
- Centers for Medicare & Medicaid Services. Medicare Physician & Other Practitioners by Geography and Service, data years 2019 to 2024.
- Centers for Medicare & Medicaid Services. Medicare Monthly Enrollment, 2024 annual data.
- Centers for Medicare & Medicaid Services. PFS Relative Value Files: RVU25D and RVU26D (October releases).
- Centers for Medicare & Medicaid Services. CY 2027 PFS Proposed Rule (CMS-1848-P) addenda: Addendum B and Fully Implemented PE RVUs.
- Centers for Medicare & Medicaid Services. CY 2027 Medicare Physician Fee Schedule Proposed Rule fact sheet.
- Centers for Medicare & Medicaid Services. CY 2026 Medicare Physician Fee Schedule Final Rule fact sheet.
- Tripp R. Understanding 2026 Code Updates for Remote Monitoring. Journal of AHIMA, February 3, 2026.