RN Turnover Statistics: 2026 Report
Published
Our analysts compiled RN turnover data from NSI Nursing Solutions' 2026 survey of 527 hospitals and 262,405 RNs, 10 years of federal JOLTS quits data for health care workers, and the National Council of State Boards of Nursing's 2024 workforce survey to show how often registered nurses leave hospital jobs as of Q4 2026, where turnover runs highest, and what it costs.
Key Findings
- Staff RN turnover at US hospitals averaged 17.6% in 2025, up from 16.4% in 2024 after three straight annual declines from a peak of 27.1% in 2021.
- Behavioral health nurses had the highest turnover of any hospital specialty in 2025, 22.5%, and pediatric nurses the lowest, 13.4%.
- 22.7% of RNs hired by hospitals left within their first year in 2025.
- Each RN who leaves costs a hospital an average of $60,090 to replace, which adds up to $5.19 million a year at the average hospital.
- 39.9% of employed RNs said in 2024 that they plan to retire or leave nursing within five years, up from 28.7% in 2022.
Every hospital nurse who resigns leaves a shift to cover and a position to fill. Until a replacement is hired, hospitals fill the gap with overtime, staffing incentive pay, or travel nurses, and the new hire then needs time to learn the unit. RN turnover rose sharply during the COVID-19 pandemic and then fell for three straight years. The 2025 data shows that it has started rising again.
Our analysts compiled the RN turnover, vacancy, and cost figures in NSI Nursing Solutions' 2026 National Health Care Retention & RN Staffing Report, which surveyed 527 hospitals in 40 states covering 262,405 RNs for calendar year 2025, and arranged them by year, specialty, region, tenure, and cost. We then added 10 years of quits, separations, and hires rates for health care workers from the federal Job Openings and Labor Turnover Survey (JOLTS), and the intent-to-leave findings from the National Council of State Boards of Nursing's 2024 National Nursing Workforce Survey.
In the following sections, we break down hospital RN turnover by year, specialty, region, and length of service, compare health care quit rates with the rest of the economy, look at why nurses say they plan to leave, and measure what turnover and vacancies cost hospitals.
How Hospital RN Turnover Has Changed Since 2021
A five-year view shows how hospital RN turnover has moved since the pandemic. NSI measures turnover as the number of RNs who left a hospital during the year divided by the average number it employed. It reports two versions: one that counts every staff RN, including per diem nurses, and one that counts only full-time and part-time nurses. The table also shows turnover for all hospital employees, so the RN rate can be compared with the rest of the workforce.
| Year | All staff RNs | Staff RNs, full-time and part-time only | All hospital employees | All hospital employees, full-time and part-time only |
|---|---|---|---|---|
| 2021 | 27.1% | 22.5% | 25.9% | 22.0% |
| 2022 | 22.5% | 18.2% | 22.7% | 19.9% |
| 2023 | 18.4% | 15.0% | 20.7% | 17.2% |
| 2024 | 16.4% | 13.5% | 18.3% | 15.4% |
| 2025 | 17.6% | 14.6% | 18.5% | 15.8% |
Source: NSI Nursing Solutions, 2026 NSI National Health Care Retention & RN Staffing Report, March 2026. Each year refers to the calendar year the data covers.
| Measure | Value |
|---|---|
| RNs who left hospital positions | 324,090 |
| RNs hired by hospitals | 377,650 |
| Net RNs added | More than 53,500 |
| RN workforce growth rate, 2025 | 2.9% |
| RN workforce growth rate, 2024 | 5.6% |
| Median hospital RN turnover rate | 18.6% |
| Range of hospital RN turnover rates | 5.6% to 40.0% |
Source: NSI Nursing Solutions, 2026 NSI National Health Care Retention & RN Staffing Report, March 2026. National totals are NSI projections from its hospital sample.
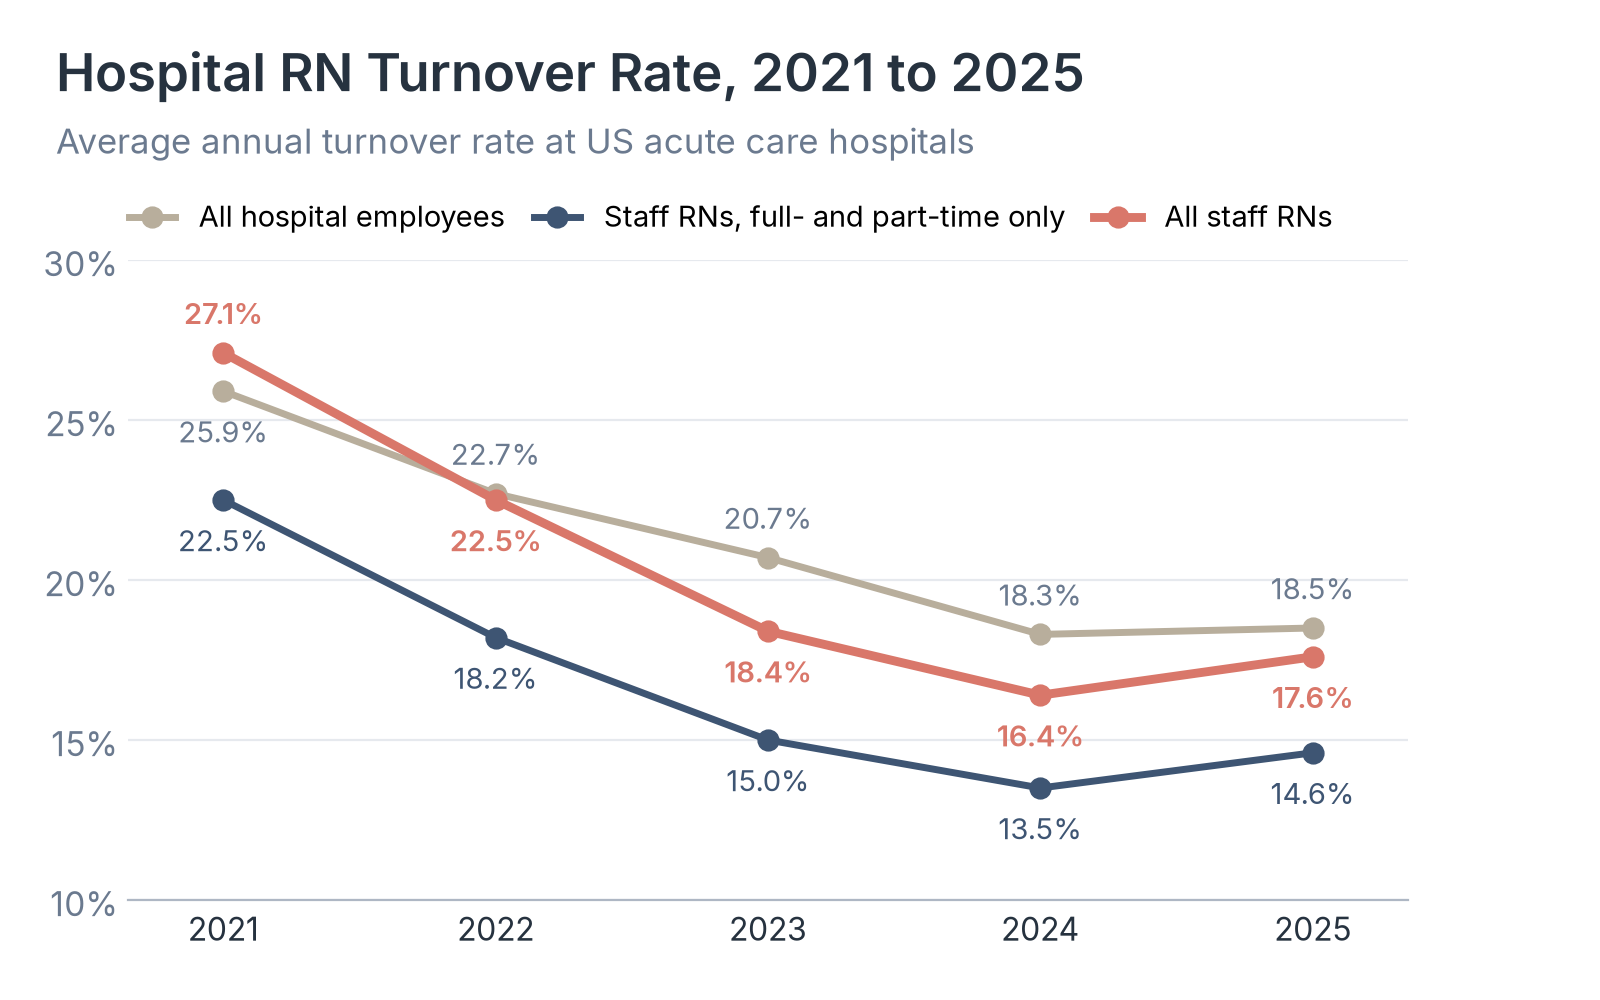
Source: Healthcare Industry Reviews analysis of NSI Nursing Solutions, 2026 NSI National Health Care Retention & RN Staffing Report, March 2026.
Key Findings
- RN turnover fell 10.7 points from 2021 to 2024, faster than turnover for all hospital employees, which fell 7.6 points. In 2025 the RN rate rose 1.2 points while the rate for all employees rose only 0.2 points.
- Over the five years from 2021 through 2025, the average hospital turned over 102% of its RN workforce, which equals replacing every staff nurse once.
- Hospitals still added more than 53,500 RNs in 2025, but the 2.9% add rate, NSI's measure of net workforce growth, was about half the 5.6% of the year before. When hiring slows while exits rise, each departure is harder to cover with new staff.
RN Turnover by Hospital Specialty
Turnover rates differ from one hospital unit to the next. NSI reports turnover for 10 nursing specialties, which shows which units lose nurses fastest and which saw the largest change in 2025.
| Specialty | 2024 | 2025 | Change |
|---|---|---|---|
| Behavioral health | 22.8% | 22.5% | -0.3 points |
| Emergency | 19.1% | 20.7% | +1.6 points |
| Telemetry | 17.4% | 19.5% | +2.1 points |
| Step down | 20.3% | 19.0% | -1.3 points |
| Medical/surgical | 18.0% | 18.1% | +0.1 points |
| Critical care | 18.3% | 17.6% | -0.7 points |
| Burn center | 17.0% | 17.5% | +0.5 points |
| Women's health | 13.3% | 15.0% | +1.7 points |
| Surgical services | 13.7% | 14.9% | +1.2 points |
| Pediatrics | 12.2% | 13.4% | +1.2 points |
Source: NSI Nursing Solutions, 2026 NSI National Health Care Retention & RN Staffing Report, March 2026.
| Specialty | Share of RN workforce replaced in five years |
|---|---|
| Telemetry | 117.8% |
| Step down | 115.4% |
| Emergency | 113.6% |
| All hospitals | 102% |
| Surgical services | 78.8% |
| Pediatrics | 75.6% |
Source: NSI Nursing Solutions, 2026 NSI National Health Care Retention & RN Staffing Report, March 2026. NSI reports cumulative figures for the specialties with the highest and lowest totals.
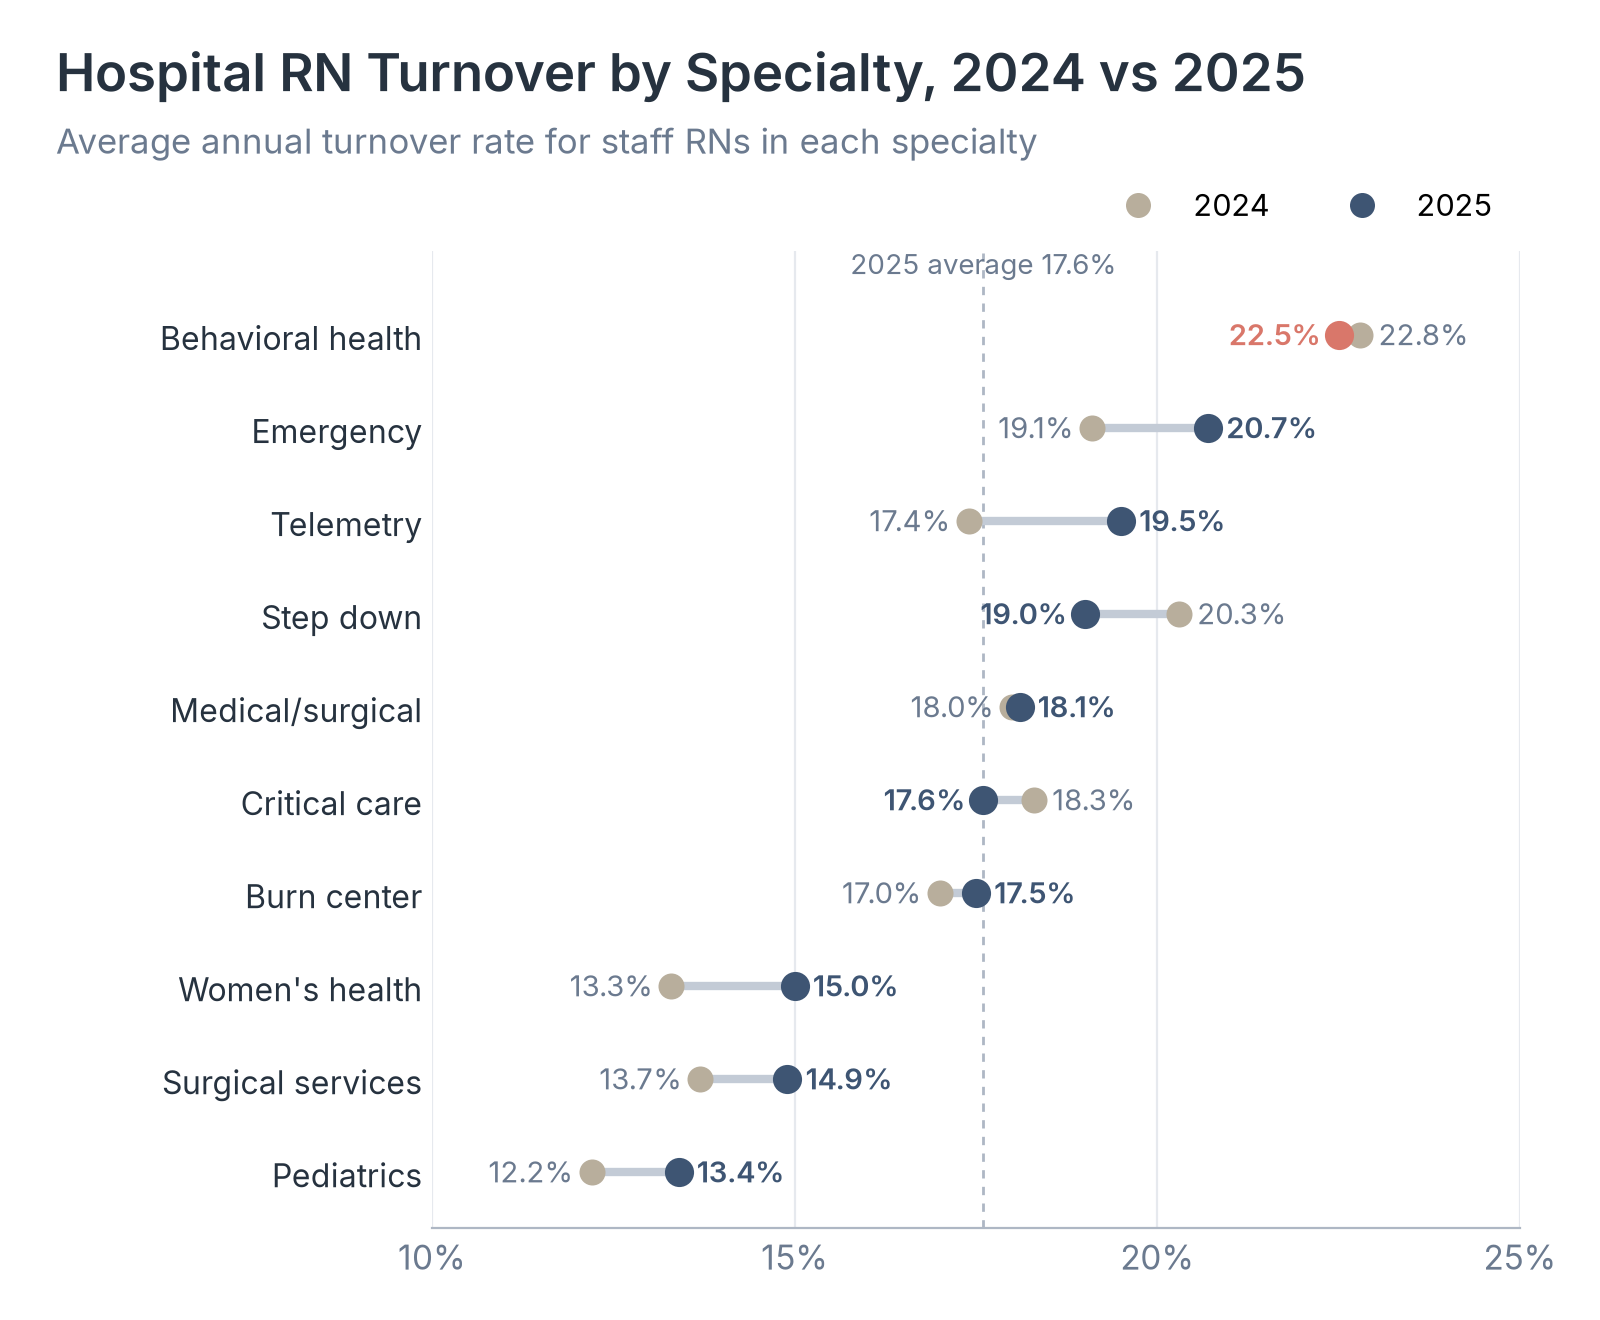
Source: Healthcare Industry Reviews analysis of NSI Nursing Solutions, 2026 NSI National Health Care Retention & RN Staffing Report, March 2026.
Key Findings
- Turnover rose in 7 of the 10 specialties in 2025. Telemetry had the largest increase, 2.1 points, followed by women's health at 1.7 points and emergency at 1.6 points.
- Step down, critical care, and behavioral health were the only specialties where turnover fell, by 1.3, 0.7, and 0.3 points.
- Telemetry, step down, and emergency units each replaced more than their entire RN staff over five years. Hospitals planning retention budgets can expect the most churn in these units and plan orientation capacity there first.
RN Turnover by Region and Hospital Benchmarks
NSI groups hospitals into five US regions and also publishes percentiles, which let a hospital see how its own turnover rate compares with peers. In NSI's percentile tables, the 90th percentile is the best performer, meaning the lowest turnover.
| Region | All staff RNs | Change from 2024 | Staff RNs, full-time and part-time only | Change from 2024 |
|---|---|---|---|---|
| South-East | 18.7% | +1.4 points | 16.3% | +1.7 points |
| West | 18.4% | +2.3 points | 15.0% | +1.6 points |
| North-East | 17.9% | +3.3 points | 14.8% | +2.9 points |
| South-Central | 17.1% | -0.9 points | 13.4% | -0.3 points |
| North-Central | 16.2% | +0.4 points | 13.5% | +0.2 points |
| United States | 17.6% | +1.2 points | 14.6% | +1.1 points |
Source: NSI Nursing Solutions, 2026 NSI National Health Care Retention & RN Staffing Report, March 2026. North-East: CT, DC, DE, MA, MD, ME, NH, NJ, NY, PA, RI, and VT. North-Central: IA, IL, IN, KS, MI, MN, MO, ND, NE, OH, SD, and WI. South-East: AL, FL, GA, KY, MS, NC, SC, TN, VA, and WV. South-Central: AR, LA, OK, and TX. West: AK, AZ, CA, CO, HI, ID, MT, NM, NV, OR, UT, WA, and WY.
| Percentile | All staff RNs | Staff RNs, full-time and part-time only |
|---|---|---|
| 90th (lowest turnover) | 11.5% | 9.2% |
| 75th | 13.8% | 11.1% |
| Median | 18.6% | 14.1% |
| 25th | 21.6% | 18.7% |
| 10th (highest turnover) | 25.7% | 22.6% |
Source: NSI Nursing Solutions, 2026 NSI National Health Care Retention & RN Staffing Report, March 2026.
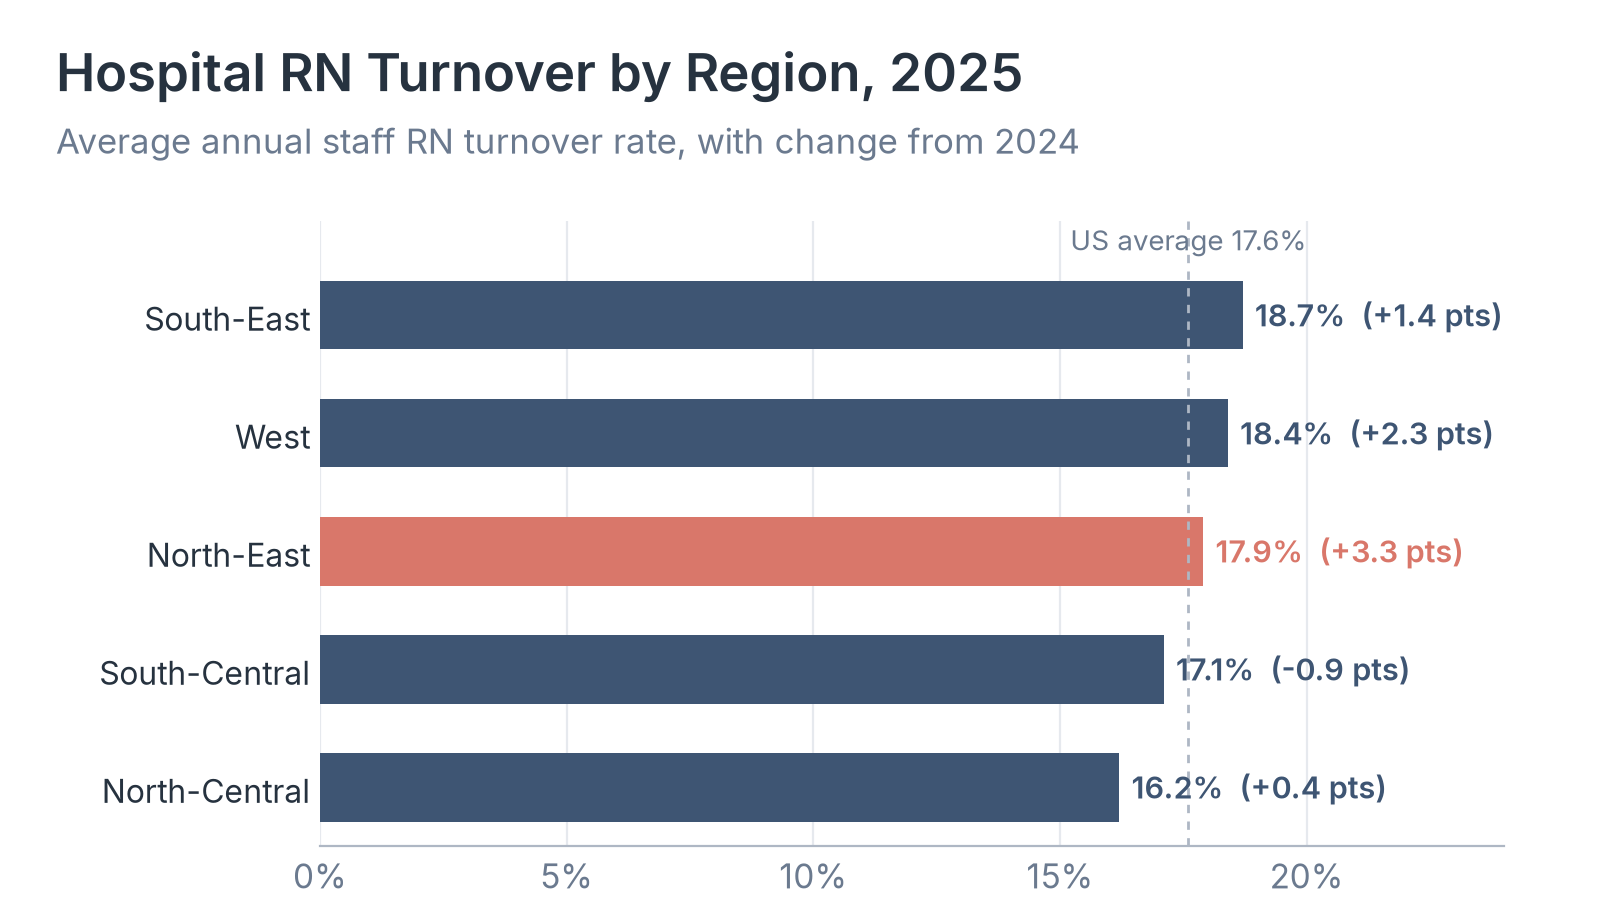
Source: Healthcare Industry Reviews analysis of NSI Nursing Solutions, 2026 NSI National Health Care Retention & RN Staffing Report, March 2026.
Key Findings
- Turnover rose in four of the five regions. The North-East had the largest increase, 3.3 points, and South-Central was the only region where it fell.
- The gap between regions was 2.5 points in 2025, from 16.2% in the North-Central region to 18.7% in the South-East, much smaller than the gap between specialties.
- The 14.2-point spread between hospitals at the 90th and 10th percentiles is more than five times the gap between the highest and lowest regions, so hospitals comparing themselves with peers will learn more from the percentile benchmarks than from regional averages.
When RNs Leave: Turnover by Length of Service
Length of service shows at what point in a nurse's time at a hospital turnover happens. NSI tracks how long each departing employee had worked at the hospital, for all employees and for RNs, which separates early departures from those of long-serving staff.
| Length of service | All hospital employees | Registered nurses |
|---|---|---|
| Under 1 year | 35.6% | 29.0% |
| 1 to 2 years | 21.2% | 21.9% |
| 2 to 5 years | 23.4% | 27.7% |
| 5 to 10 years | 9.4% | 10.5% |
| Over 10 years | 10.4% | 10.8% |
Source: NSI Nursing Solutions, 2026 NSI National Health Care Retention & RN Staffing Report, March 2026.
| Measure | All hospital employees | Registered nurses |
|---|---|---|
| Share of new hires who left within a year | 29.5% | 22.7% |
| Average tenure | 6.9 years | 6.8 years |
Source: NSI Nursing Solutions, 2026 NSI National Health Care Retention & RN Staffing Report, March 2026.
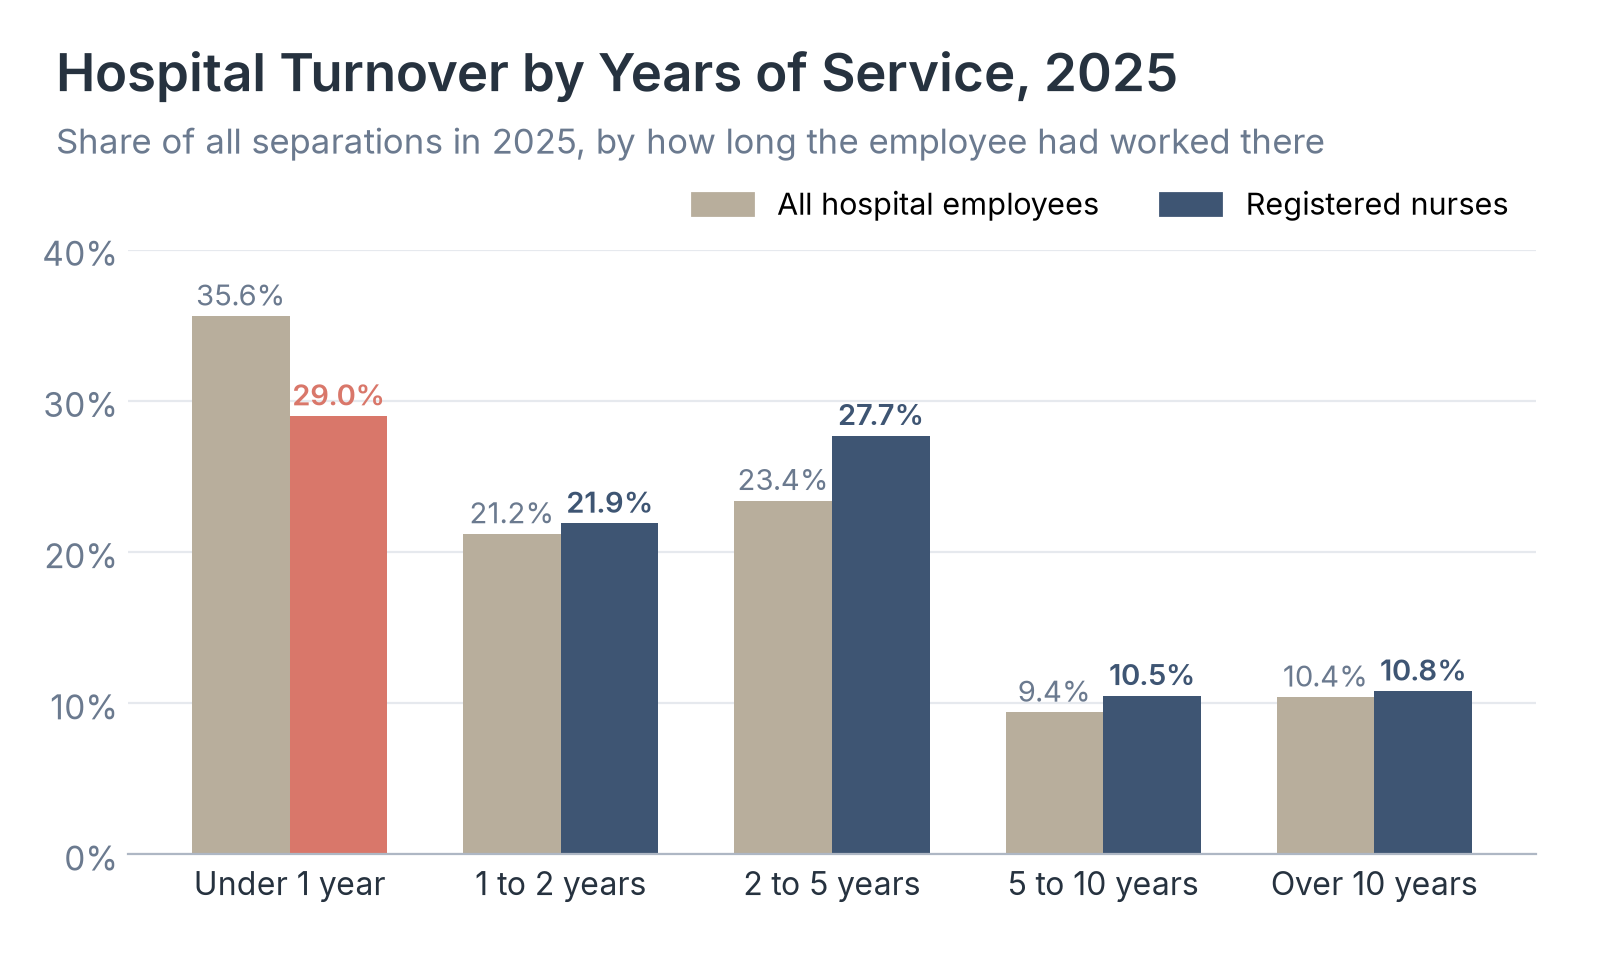
Source: Healthcare Industry Reviews analysis of NSI Nursing Solutions, 2026 NSI National Health Care Retention & RN Staffing Report, March 2026.
Key Findings
- Half of all RNs who left a hospital in 2025, 50.9%, had worked there less than two years.
- First-year departures made up a smaller share of RN separations than of all hospital separations, 29.0% against 35.6%, while departures in years two through five made up a larger share, 27.7% against 23.4%.
- Only 21.3% of departing RNs had more than five years of service, so retention efforts aimed at a nurse's first five years reach close to four in five of the RNs who leave.
Health Care Quit Rates Compared With Other Industries
NSI covers hospitals, but federal data shows the wider trend for health care workers. The Bureau of Labor Statistics' JOLTS survey reports how many workers quit each month as a share of employment. Its health care and social assistance industry includes hospitals, physician offices, nursing homes, and social service employers, so it covers more than RNs, but it is updated monthly and goes back years.
| Year | Health care quits rate, monthly average | All nonfarm quits rate, monthly average | Health care total separations rate, monthly average | Health care hires rate, monthly average | Health care quits, sum of monthly rates |
|---|---|---|---|---|---|
| 2016 | 1.8% | 2.1% | 2.7% | 2.9% | 21.4% |
| 2017 | 1.9% | 2.1% | 2.8% | 2.9% | 22.3% |
| 2018 | 2.0% | 2.3% | 2.9% | 3.1% | 24.0% |
| 2019 | 2.0% | 2.3% | 2.8% | 3.1% | 23.9% |
| 2020 | 2.1% | 2.1% | 3.8% | 3.5% | 24.6% |
| 2021 | 2.5% | 2.7% | 3.3% | 3.4% | 30.7% |
| 2022 | 2.6% | 2.8% | 3.4% | 3.7% | 31.1% |
| 2023 | 2.4% | 2.4% | 3.3% | 3.7% | 29.1% |
| 2024 | 2.2% | 2.1% | 3.0% | 3.4% | 26.5% |
| 2025 | 2.0% | 2.0% | 2.9% | 3.1% | 24.3% |
Source: US Bureau of Labor Statistics, Job Openings and Labor Turnover Survey, not seasonally adjusted annual averages, data retrieved October 30, 2026. Health care refers to the health care and social assistance industry (NAICS 62). The last column adds the 12 monthly quits rates for each year.
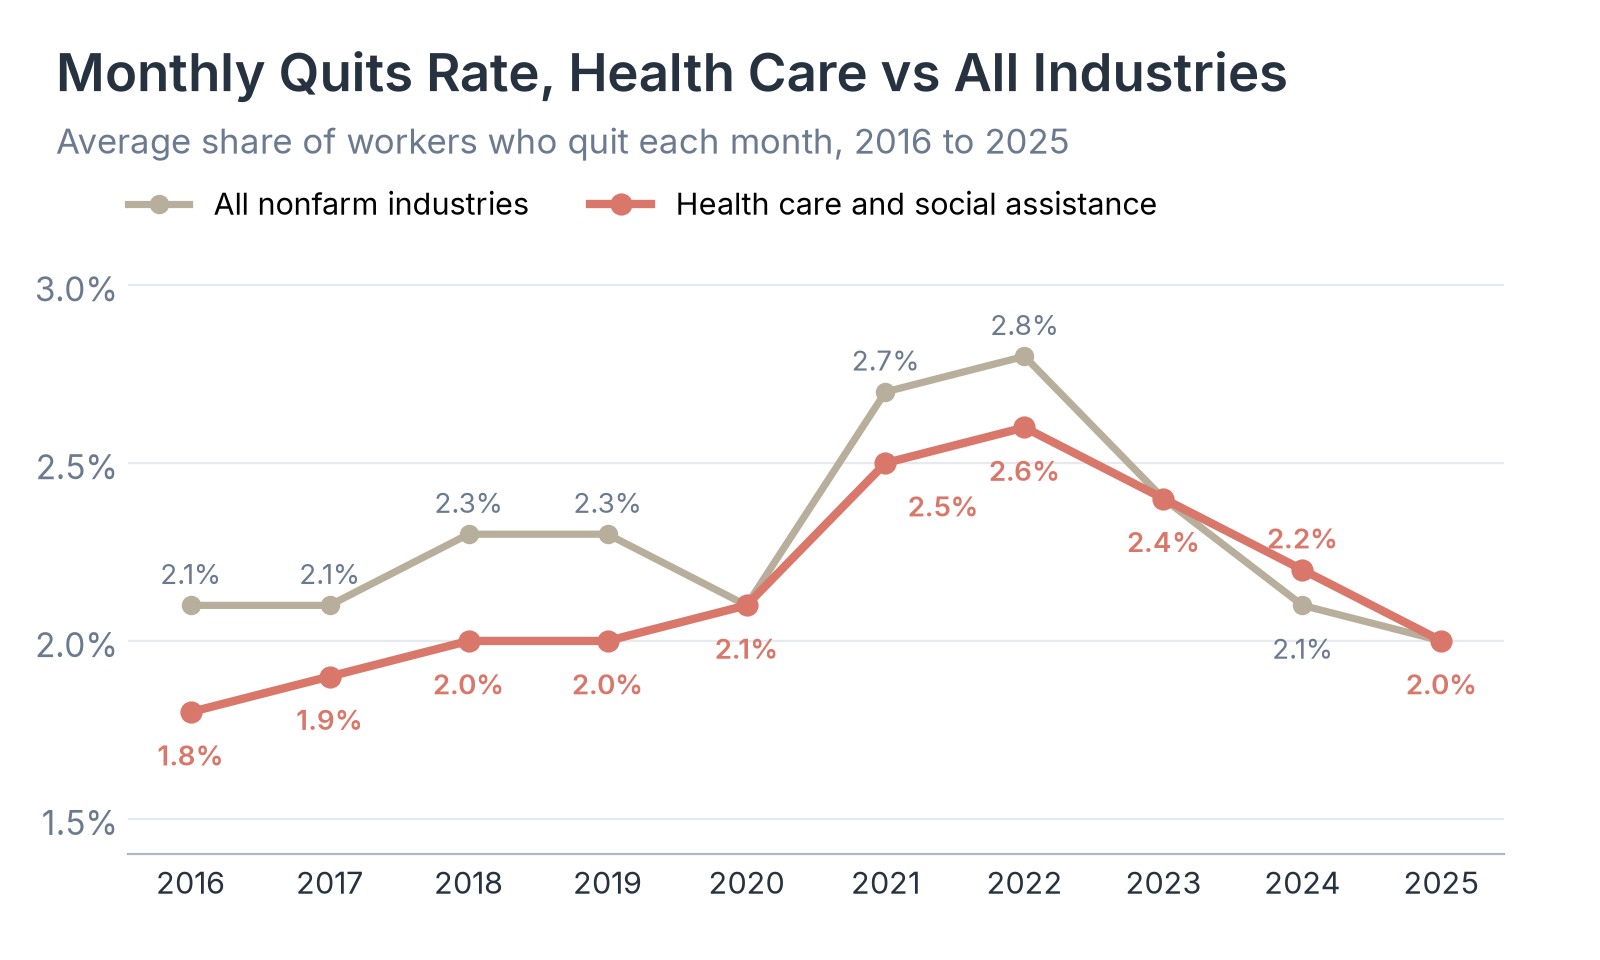
Source: Healthcare Industry Reviews analysis of US Bureau of Labor Statistics, Job Openings and Labor Turnover Survey, data retrieved October 30, 2026.
Key Findings
- The health care quits rate peaked at 2.6% a month in 2022 and fell to 2.0% in 2025, back to its 2018 and 2019 level.
- Health care workers quit less often than the average US worker in 6 of the 7 years from 2016 through 2022, and the two rates were equal in 2020. Since 2023 they have been within 0.1 point of each other.
- Adding the 12 monthly rates, health care employers lost the equivalent of 24.3% of their workforce to quits in 2025, down from 31.1% in 2022. From January through August 2026, the health care quits rate averaged 1.96% a month, against 2.09% in the same months of 2025, so federal data shows no new wave of health care quits this year.
Why Nurses Say They Plan to Leave
Turnover counts show who left, while surveys of working nurses show who is thinking about leaving. The National Council of State Boards of Nursing surveys a random sample of licensed nurses every two years, and in 2024 it asked nurses who plan to leave or retire within five years for their reasons for the first time.
| Survey year | Plan to leave or retire | Plan to retire | Plan to leave nursing |
|---|---|---|---|
| 2020 | 22.1% | Not reported | Not reported |
| 2022 | 28.7% | Not reported | Not reported |
| 2024 | 39.9% | 21.9% | 18.0% |
Source: National Council of State Boards of Nursing, The 2024 National Nursing Workforce Survey, Journal of Nursing Regulation, April 2025. Employed RNs only. The 2024 survey split the answer into retirement and leaving nursing for other reasons.
| Reason | Share of RNs planning to leave or retire |
|---|---|
| Retirement | 61.4% |
| Stress and burnout | 41.3% |
| Workload | 32.8% |
| Understaffing | 26.0% |
| Inadequate salary | 21.8% |
| Taking care of home and family | 12.6% |
| Workplace violence or bullying | 12.3% |
| School | 2.9% |
| Disability | 2.2% |
| Other | 7.9% |
Source: National Council of State Boards of Nursing, The 2024 National Nursing Workforce Survey, Journal of Nursing Regulation, April 2025. Respondents could select more than one reason.
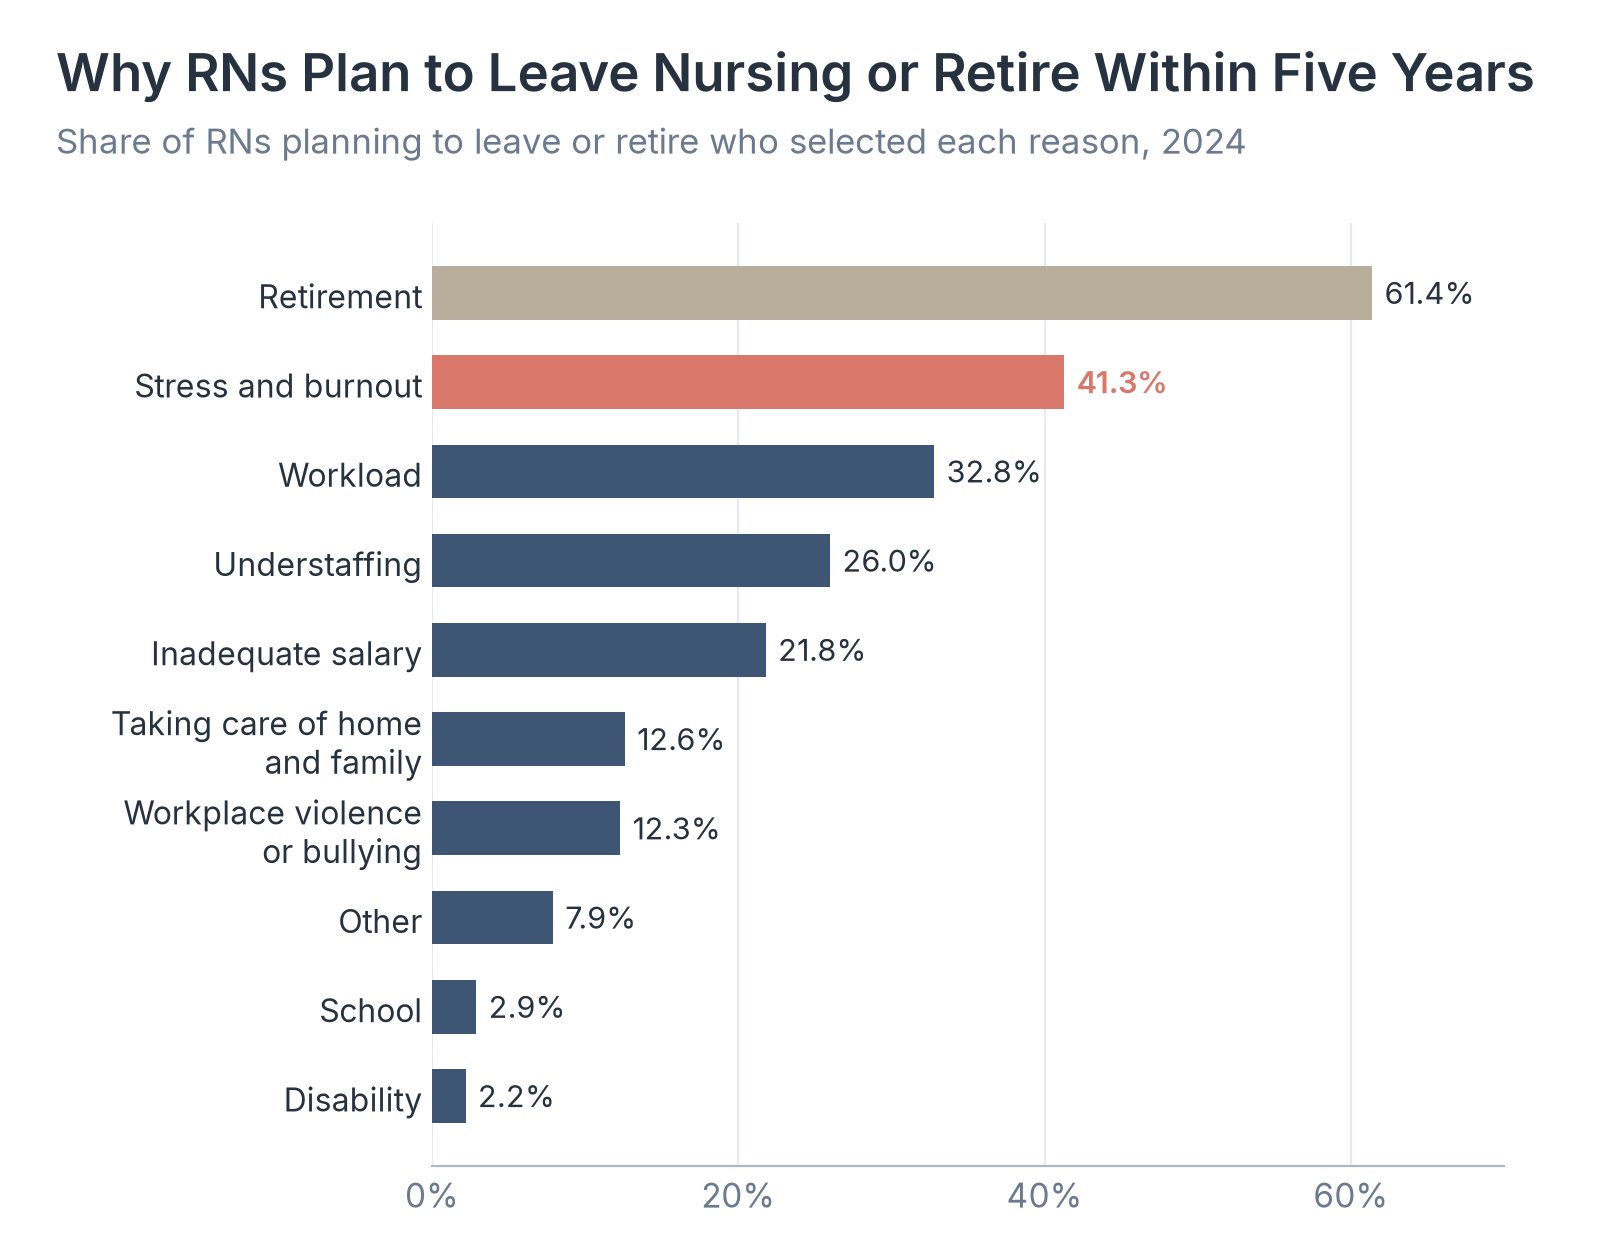
Source: Healthcare Industry Reviews analysis of National Council of State Boards of Nursing, The 2024 National Nursing Workforce Survey, April 2025.
Key Findings
- Stress and burnout was the most common reason after retirement, chosen by 41.3% of RNs who plan to leave or retire, and workload and understaffing followed.
- More than 138,000 nurses have left the workforce since 2022, according to NCSBN. Among staff RNs who resigned from hospitals in 2025, NSI found personal issues, relocation, and retirement were the three most common reasons.
- Workload, understaffing, and burnout are reasons a hospital can influence through staffing levels and scheduling, unlike retirement or relocation. Each was chosen by at least a quarter of RNs planning to leave.
What RN Turnover and Vacancies Cost Hospitals
Each departure brings recruiting, orientation, and temporary staffing costs, and positions that stay open add more. NSI estimates the cost of replacing a bedside RN and tracks how many budgeted RN positions are unfilled and how long they take to fill.
| Measure | Value |
|---|---|
| Average cost to replace one bedside RN | $60,090 |
| Average annual cost of RN turnover per hospital | $5.19 million |
| Range of annual cost per hospital | $4.2 million to $6.2 million |
| Cost of each 1-point change in RN turnover, average hospital | $294,976 |
| Added cost of the 2025 increase in RN turnover, average hospital | About $360,000 |
| National cost of hospital RN turnover in 2025 | An estimated $19.5 billion |
| Hospitals that track the cost of turnover | 46.1% |
Source: NSI Nursing Solutions, 2026 NSI National Health Care Retention & RN Staffing Report, March 2026. The national cost is a Healthcare Industry Reviews estimate.
| Measure | Value |
|---|---|
| Average RN vacancy rate | 8.6% |
| Hospitals with an RN vacancy rate of 10% or higher | 33.1% |
| Unfilled RN positions at the average hospital | 43 full-time equivalents |
| Average days to fill an experienced RN position | 78 days |
| Average travel nurse fee per hour | $91.23 |
| Average staff RN pay per hour, including benefits | $59.46 |
| Hospitals planning to reduce travel or agency use | 70.7% |
| Estimated national RN shortage | 158,600 RNs |
Source: NSI Nursing Solutions, 2026 NSI National Health Care Retention & RN Staffing Report, March 2026. NSI changed its vacancy formula in 2026 to unfilled RN full-time equivalents divided by budgeted full-time equivalents; earlier reports averaged survey ranges.
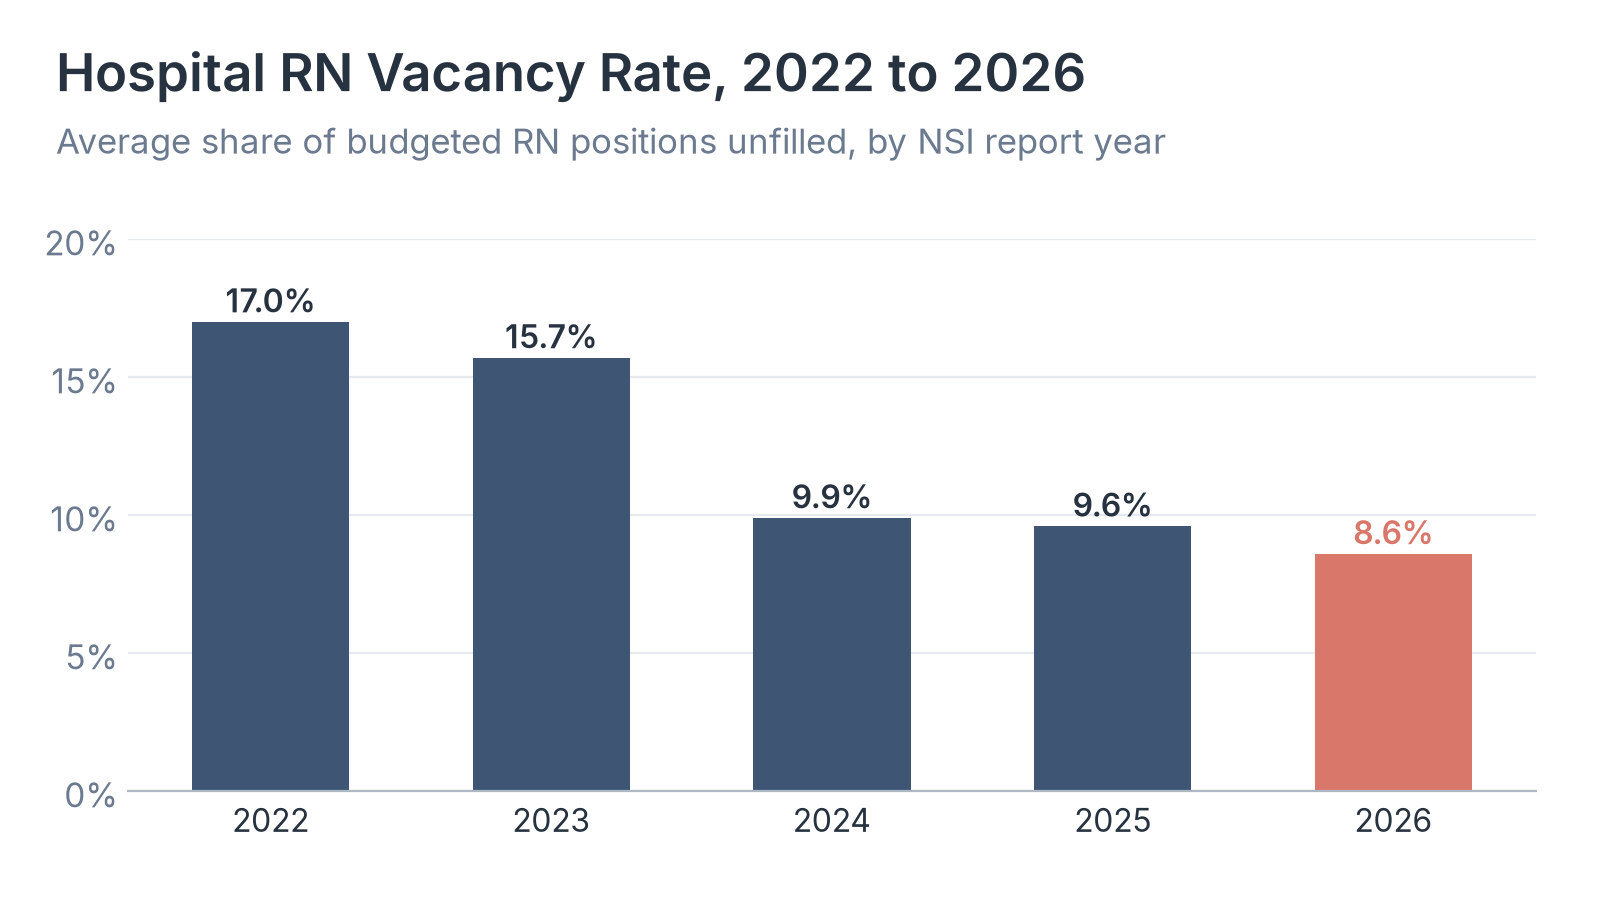
Source: Healthcare Industry Reviews analysis of NSI Nursing Solutions, National Health Care Retention & RN Staffing Reports, 2022 to 2026. The 2026 rate uses a new formula.
Key Findings
- Across the 324,090 RNs who left hospital jobs in 2025, replacement costs total an estimated $19.5 billion.
- A travel nurse cost $31.77 an hour more than a staff RN, or about $66,081 a year per position, which is more than the average cost of replacing a nurse.
- The RN vacancy rate fell from 17.0% in NSI's 2022 report to 8.6% in 2026, which NSI calculates with a new formula, but the average hospital still had 43 RN positions open and needed 78 days to fill each one. Lowering turnover by one point saves the average hospital about $295,000 a year.
What RN Turnover Statistics Mean for Hospitals in 2026
For hospital leaders, the 2025 increase ended three years of steady improvement, and it came while hiring slowed. Telemetry, which had the largest increase of any specialty, also took longer to fill than any other specialty NSI measured, 87 days, so each added departure there leaves a shift uncovered for close to three months.
Most nurses who leave do so in their first five years at a hospital, and the reasons nurses give for planning to leave point to workload and staffing more often than pay. The intent-to-leave figures from NCSBN measure plans, and 21.9% of employed RNs said they plan to retire within five years.
So if you are setting a retention budget for 2027, compare your RN turnover with NSI's percentile benchmarks and specialty averages, and price each point of turnover at your own replacement cost before choosing where to spend.
Data Collection and Methodology
We opened NSI Nursing Solutions' 2026 National Health Care Retention & RN Staffing Report on October 30, 2026. NSI collected data from 527 hospitals in 40 states for January through December 2025, covering 965,886 hospital employees and 262,405 RNs. It defines turnover as separations during the year divided by the average number of employees, and it excludes internal transfers and temporary, agency, and travel staff. National totals for RN exits, hires, cost, and shortage are NSI projections from its sample. NSI's regional groupings and percentile tables are reproduced as published.
We retrieved JOLTS series from the Bureau of Labor Statistics on October 30, 2026: quits rates for health care and social assistance (JTU620000000000000QUR) and total nonfarm (JTU000000000000000QUR), and total separations (JTU620000000000000TSR) and hires (JTU620000000000000HIR) rates for health care and social assistance. These are not seasonally adjusted, and we used the annual averages BLS publishes for 2016 through 2025. To show a yearly figure, we also added the 12 monthly quits rates for each year. 2026 figures cover January through August and are preliminary. JOLTS does not publish a hospital-only or RN-only series, so these rates describe all health care and social assistance workers.
Intent-to-leave and reasons data come from the 2024 National Nursing Workforce Survey by the National Council of State Boards of Nursing and the National Forum of State Nursing Workforce Centers, which surveyed a random sample of licensed nurses in all 50 states between March and December 2024 and weighted responses by state, age, and gender. Only employed nurses answered the intent questions. NCSBN's count of nurses who left since 2022 comes from its April 2025 announcement of the survey results.
One figure is an estimate. The national cost of hospital RN turnover in 2025, an estimated $19.5 billion, multiplies NSI's 324,090 RN exits by its $60,090 average replacement cost. It assumes every exit costs the national average and covers acute care hospitals only. All money figures are in US dollars, and no currency conversion was needed. We calculated products, differences, and ratios from the published values.
Sources
- Healthcare Industry Reviews, RN Turnover Study: aggregation of hospital RN turnover, tenure, vacancy, and cost data from NSI Nursing Solutions, Bureau of Labor Statistics JOLTS quits, separations, and hires rates for health care, 2016 to 2026, and National Council of State Boards of Nursing workforce survey data, conducted October 2026.
- NSI Nursing Solutions. 2026 NSI National Health Care Retention & RN Staffing Report. March 2026.
- US Bureau of Labor Statistics. Job Openings and Labor Turnover Survey. Series JTU620000000000000QUR, JTU000000000000000QUR, JTU620000000000000TSR, and JTU620000000000000HIR, retrieved October 30, 2026.
- Smiley, R. A., et al. The 2024 National Nursing Workforce Survey. Journal of Nursing Regulation. April 2025.
- National Council of State Boards of Nursing. NCSBN Research Highlights Small Steps Toward Nursing Workforce Recovery; Burnout and Staffing Challenges Persist. April 17, 2025.