Biosimilar Adoption Statistics: 2026 Report
Published
Our analysts counted all 90 FDA-approved biosimilars, compiled market share and price data for 13 molecules, and calculated Medicare payment limits from 2015 to 2026 to show how many biosimilars are approved, how widely they are used, and how much they have lowered prices, as of Q4 2026.
Key Findings
- The FDA list showed 90 approved biosimilars for 21 reference biologics as of October 28, 2026, and 36 of them (40%) were approved in 2024 and 2025.
- Biosimilars held an average of 55% of volume for molecules where they compete, from 10% for insulin glargine to 93% for bevacizumab.
- Average sales prices fell an average of 54% within five years of the first biosimilar launch, and rituximab prices were 82% below the reference price at launch.
- In October 2026, the median Medicare payment limit for rituximab biosimilars was $210.83 per 100 mg, 70.8% below Rituxan.
- Biosimilars saved the US health system $81.6 billion from 2016 to 2025, including $25.4 billion in 2025.
A biosimilar is a biologic medicine that the FDA has found to be highly similar to an existing biologic, called the reference product, with no meaningful difference in safety or effectiveness. Biosimilars can launch once the reference product's patents and exclusivity end, and they compete on price. Most biosimilars sold in the US so far treat cancer, low white blood cell counts, and autoimmune diseases, and many are given in clinics and billed to Medicare Part B.
Our analysts counted every product in the FDA's biosimilar list by approval year and reference molecule.2 We compiled Samsung Bioepis's Q4 2026 market share and average sales price figures by molecule, calculated Medicare Part B payment limits from CMS files for each October from 2015 to 2026, and added savings estimates prepared by IQVIA for the Association for Accessible Medicines.3,4,5
In the following sections, we cover how many biosimilars the FDA has approved, how much of each market they hold, how Medicare payment limits have changed, how prices have fallen after launch, and how much biosimilars have saved.
How Many Biosimilars the FDA Has Approved
The FDA approved the first US biosimilar, a version of filgrastim, in 2015. We counted each entry in the agency's biosimilar product list by approval date.
| Year | Biosimilars approved | Total approved to date |
|---|---|---|
| 2015 | 1 | 1 |
| 2016 | 3 | 4 |
| 2017 | 5 | 9 |
| 2018 | 7 | 16 |
| 2019 | 10 | 26 |
| 2020 | 3 | 29 |
| 2021 | 4 | 33 |
| 2022 | 7 | 40 |
| 2023 | 5 | 45 |
| 2024 | 18 | 63 |
| 2025 | 18 | 81 |
| 2026 | 9 | 90 |
Source: US Food and Drug Administration (FDA), Biosimilar Product Information, content current as of October 28, 2026. 2026 includes approvals through October 28.
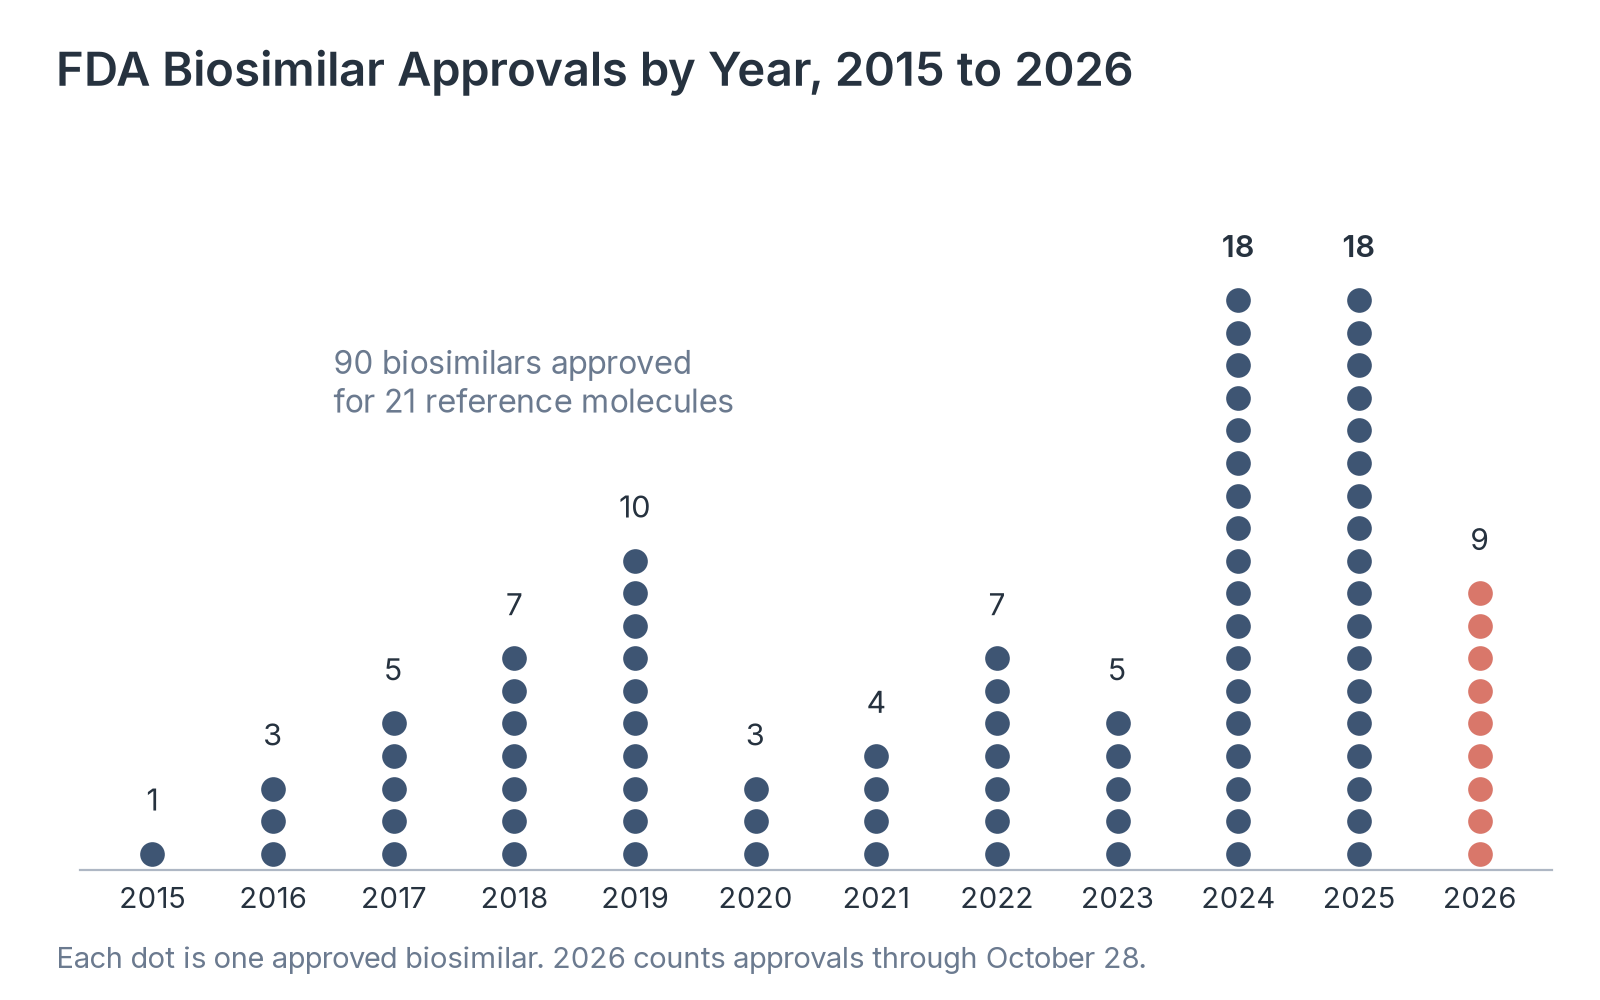
Source: Healthcare Industry Reviews analysis of FDA biosimilar product data, conducted November 2026.
Key Findings
- The FDA approved 45 biosimilars from 2015 to 2023 and 36 in 2024 and 2025 alone, 18 in each year. It approved 9 more in 2026 through October 28.
- Denosumab and adalimumab had the most biosimilars, 10 each, followed by pegfilgrastim and ustekinumab with 8 each. Five reference molecules had a single biosimilar.
- Samsung Bioepis, which counts approvals differently, reported 98 approvals as of September 2026, of which 75 (77%) had launched in the US. An approval does not always mean a product is on the market.
Biosimilar Market Share by Molecule
Samsung Bioepis tracks the biosimilar share of total volume for each molecule, combining all biosimilars and the reference product.
| Molecule | Reference product | Therapy area | FDA-approved biosimilars | First biosimilar approval | Biosimilar volume share |
|---|---|---|---|---|---|
| Bevacizumab | Avastin | Oncology | 6 | 2017 | 93% |
| Trastuzumab | Herceptin | Oncology | 6 | 2017 | 89% |
| Pegfilgrastim | Neulasta | Supportive care | 8 | 2018 | 86% |
| Filgrastim | Neupogen | Supportive care | 5 | 2015 | 78% |
| Rituximab | Rituxan | Oncology | 4 | 2018 | 76% |
| Adalimumab | Humira | Immunology | 10 | 2016 | 64% |
| Infliximab | Remicade | Immunology | 4 | 2016 | 52% |
| Ustekinumab | Stelara | Immunology | 8 | 2023 | 52% |
| Eculizumab | Soliris | Hematology | 2 | 2024 | 46% |
| Epoetin alfa | Epogen and Procrit | Supportive care | 1 | 2018 | 42% |
| Tocilizumab | Actemra | Immunology | 3 | 2023 | 31% |
| Ranibizumab | Lucentis | Ophthalmology | 5 | 2021 | 14% |
| Insulin glargine | Lantus | Endocrinology | 3 | 2021 | 10% |
Source: Samsung Bioepis, Biosimilar Market Report, Q4 2026 (volume shares, as of Q2 2026 for most molecules; epoetin alfa, adalimumab, and insulin glargine from the latest year in Figure 10); US Food and Drug Administration (FDA), Biosimilar Product Information, content current as of October 28, 2026 (approval counts and years).
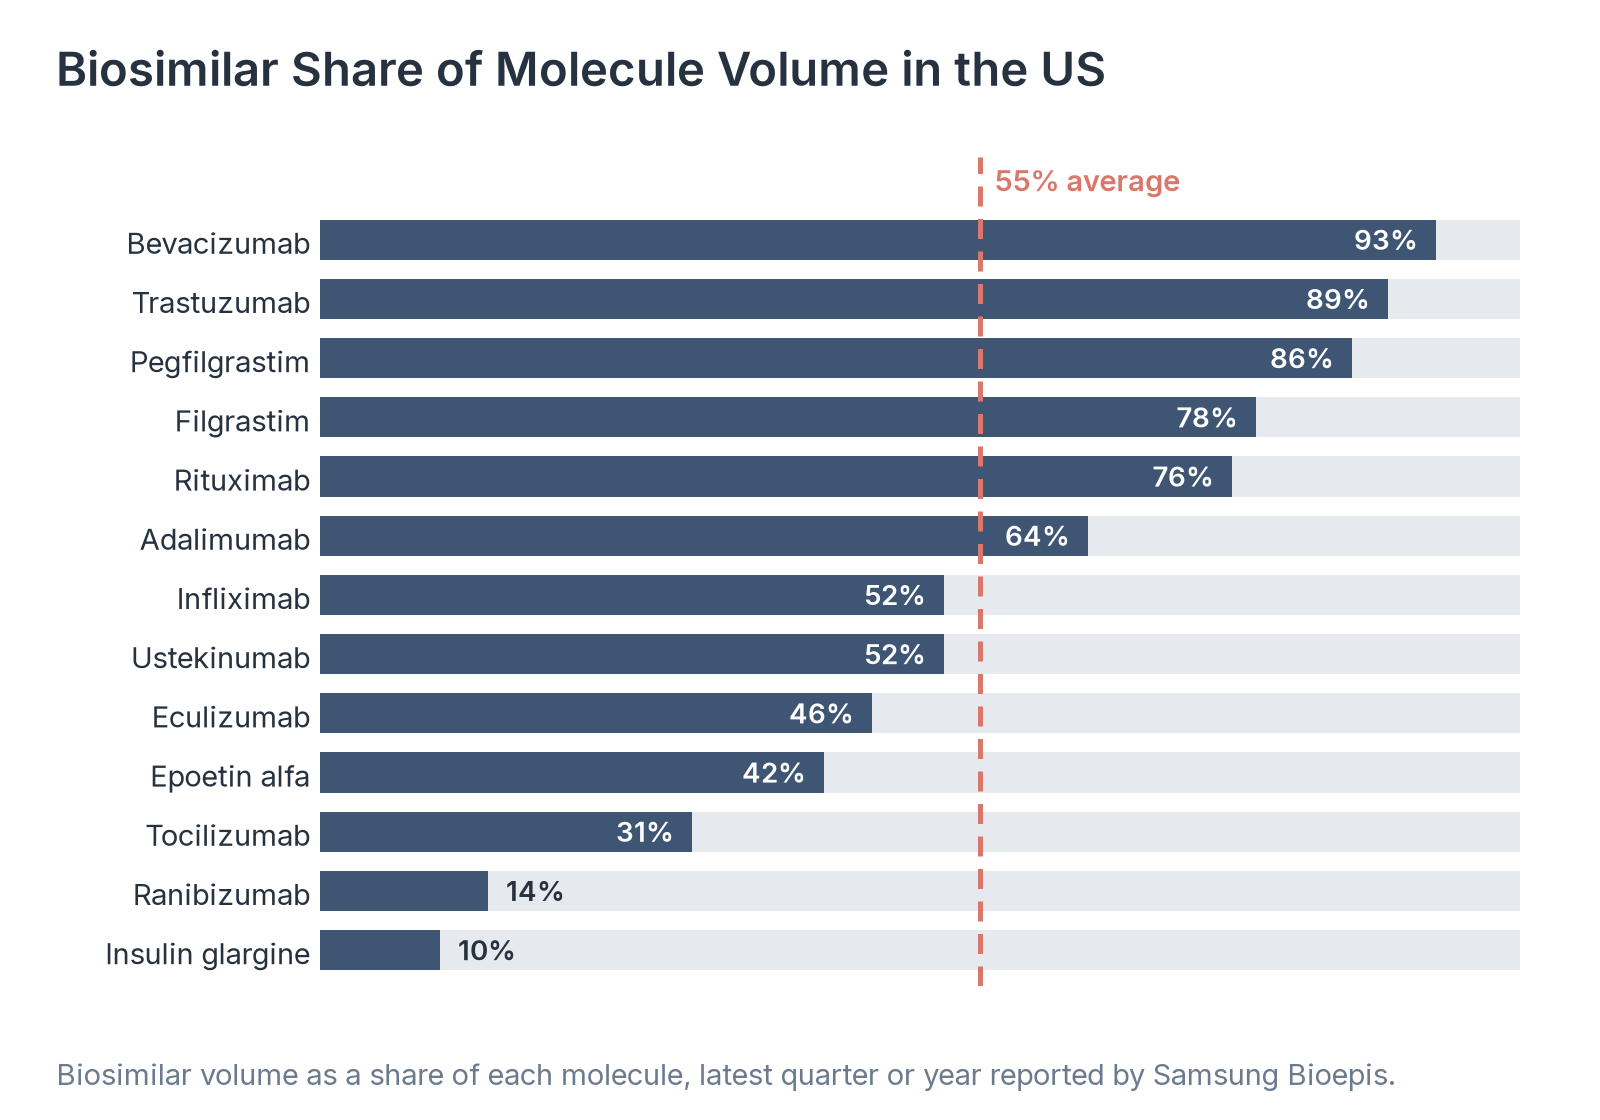
Source: Healthcare Industry Reviews analysis of Samsung Bioepis data, conducted November 2026.
Key Findings
- Biosimilars held more than three-quarters of volume for five molecules: bevacizumab (93%), trastuzumab (89%), pegfilgrastim (86%), filgrastim (78%), and rituximab (76%). All five are oncology or supportive care drugs in Samsung Bioepis's grouping.
- Biosimilars covered through the medical benefit reached average uptake of 48% 36 months after launch, compared with 28% for those covered through the pharmacy benefit. Three years after entry, biosimilars held 24% of days of therapy on average, from 8% for ranibizumab to 82% for bevacizumab.
- Adalimumab biosimilars held 3% of volume in their first year and 51% by the end of their third, after changes in contracting practices. Ustekinumab biosimilars reached 36% in their first year.
Medicare Payment Limits for Biosimilars and Reference Products
Medicare Part B pays for a biosimilar given in a doctor's office or hospital outpatient department at the biosimilar's average sales price plus 6% of the reference product's average sales price. Since October 2022, biosimilars priced at or below the reference product have temporarily received 8% instead.6 CMS publishes these payment limits every quarter.
| Molecule | Billing unit | Reference product, 2015 | Reference product, 2026 | Reference change | Median biosimilar, 2026 | Biosimilars with a payment limit, 2026 | Median biosimilar versus reference, 2026 |
|---|---|---|---|---|---|---|---|
| Infliximab | 100 mg | $787.58 | $298.56 | -62.1% | $284.56 | 3 | -4.7% |
| Trastuzumab | 100 mg | $873.59 | $688.71 | -21.2% | $315.23 | 6 | -54.2% |
| Bevacizumab | 100 mg | $696.03 | $754.92 | +8.5% | $282.94 | 5 | -62.5% |
| Rituximab | 100 mg | $748.70 | $720.94 | -3.7% | $210.83 | 3 | -70.8% |
| Filgrastim | 300 mcg | $299.70 | $298.20 | -0.5% | $100.05 | 4 | -66.4% |
Source: Centers for Medicare & Medicaid Services (CMS), ASP Pricing Files, October 2015 to October 2026. We converted each billing code to the unit shown.
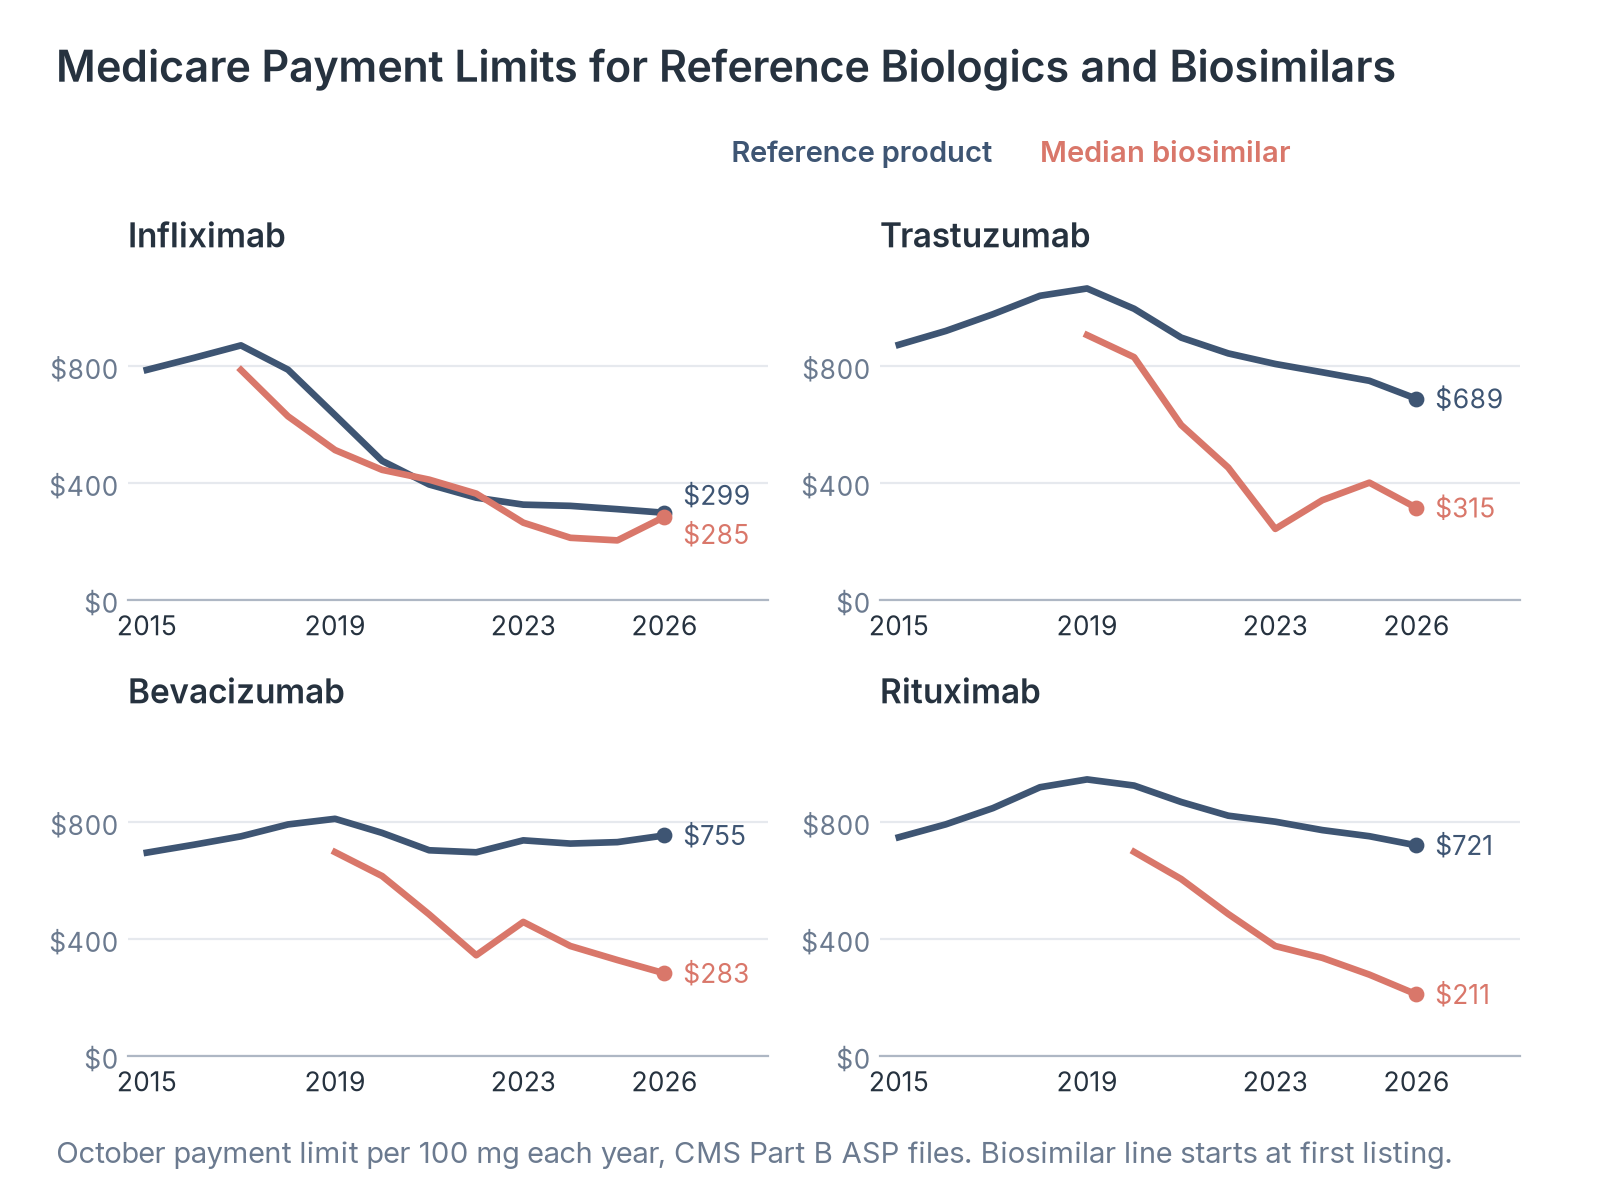
Source: Healthcare Industry Reviews analysis of CMS ASP pricing files, conducted November 2026.
Key Findings
- Remicade's payment limit fell 62.1%, from $787.58 per 100 mg in 2015 to $298.56 in 2026. The median infliximab biosimilar was only 4.7% below it in October 2026.
- For trastuzumab, bevacizumab, and rituximab, reference product payment limits peaked in 2019 and changed far less than biosimilar limits. Avastin's limit was 8.5% higher in 2026 than in 2015, while the median bevacizumab biosimilar was $282.94, 62.5% below Avastin.
- Filgrastim biosimilars, on the market since 2015, had a median payment limit of $100.05 per 300 mcg in October 2026, about a third of Neupogen's $298.20. Neupogen's own limit was almost unchanged from 2015.
How Biosimilar Competition Lowers Prices
Price change after launch shows how much competition lowers the cost of a molecule. Samsung Bioepis compares each molecule's latest average sales price with the reference product's price when the first biosimilar launched.
| Molecule | Reference product | Change versus reference price at first launch |
|---|---|---|
| Rituximab | Rituxan | -82% |
| Trastuzumab | Herceptin | -69% |
| Infliximab | Remicade | -69% |
| Pegfilgrastim | Neulasta | -62% |
| Filgrastim | Neupogen | -55% |
| Bevacizumab | Avastin | -53% |
| Ranibizumab | Lucentis | -51% |
| Epoetin alfa | Epogen and Procrit | -36% |
| Denosumab | Prolia and Xgeva | -28% |
| Tocilizumab | Actemra | -23% |
| Ustekinumab | Stelara | -20% |
| Eculizumab | Soliris | -20% |
| Aflibercept | Eylea | +4% |
Source: Samsung Bioepis, Biosimilar Market Report, Q4 2026, Figure 11, latest year shown for each molecule.
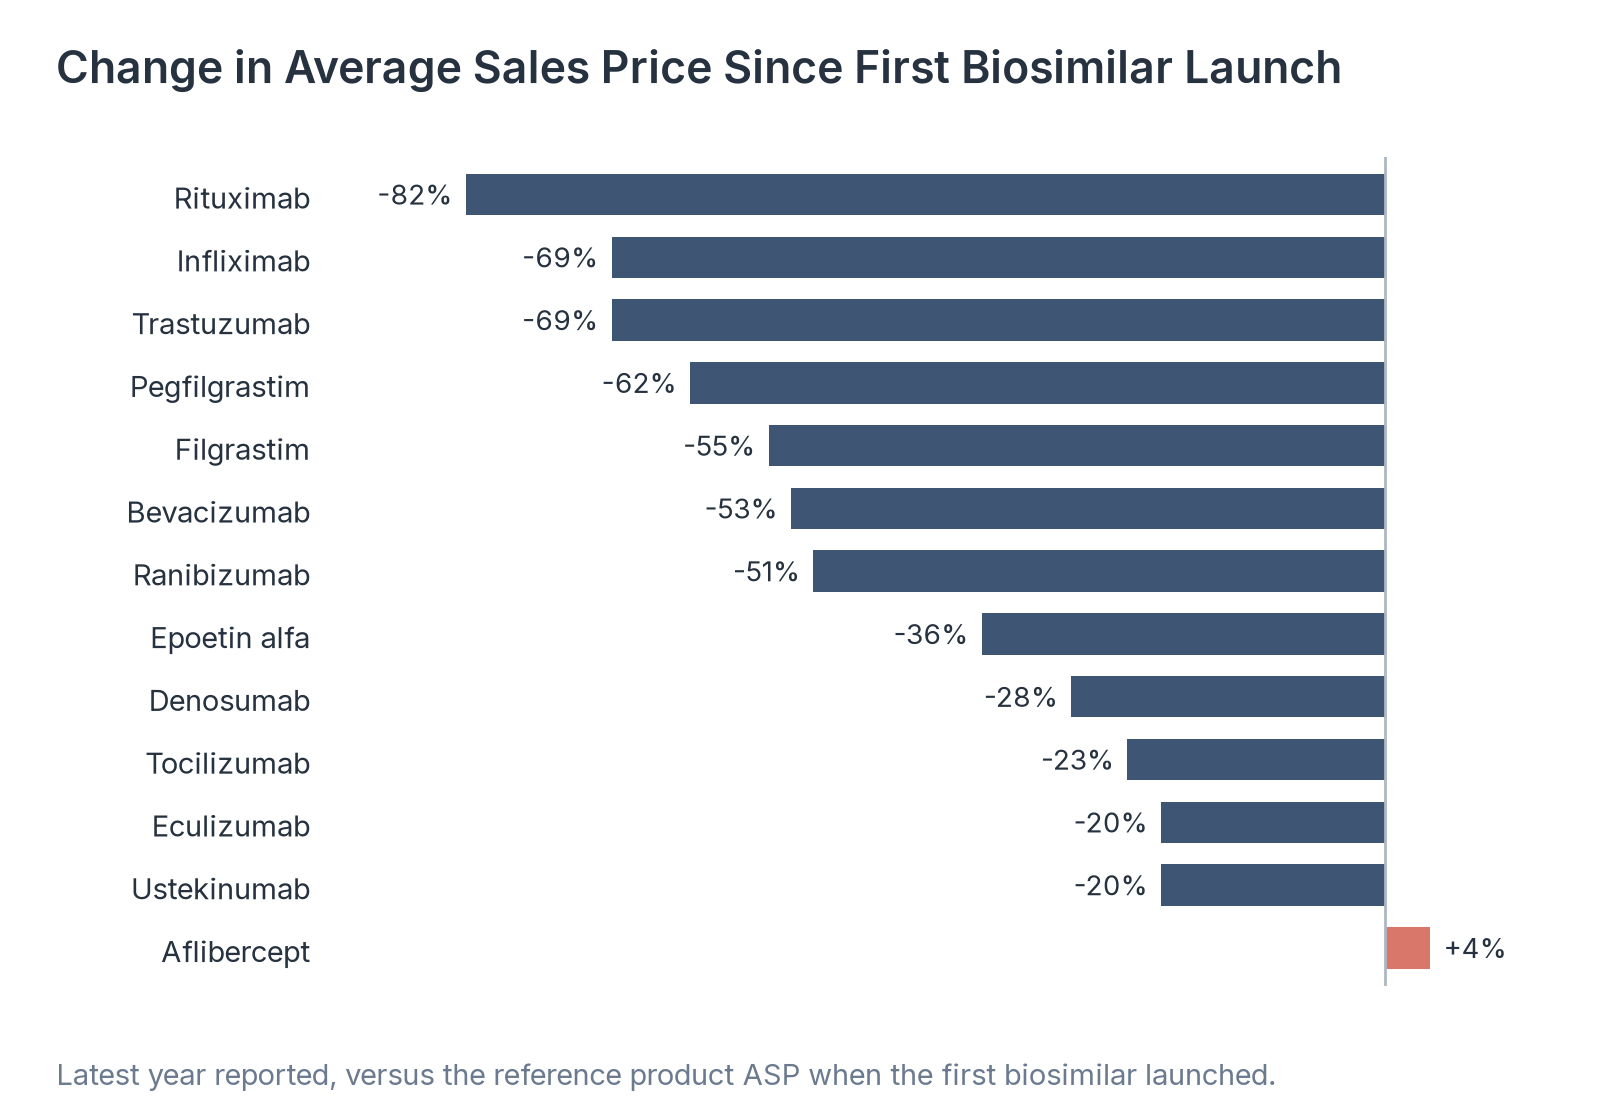
Source: Healthcare Industry Reviews analysis of Samsung Bioepis data, conducted November 2026.
Key Findings
- Prices fell more than half for seven of 13 molecules, led by rituximab (-82%), trastuzumab (-69%), and infliximab (-69%). Samsung Bioepis reported an average decline of 54% within five years of the first launch.
- Molecules with more recent biosimilar launches showed smaller declines so far: denosumab (-28%), tocilizumab (-23%), ustekinumab (-20%), and eculizumab (-20%).
- Aflibercept was the only molecule with a higher price than at first biosimilar launch, up 4%. Ranibizumab, the other eye drug in the list, fell 51% but had only 14% biosimilar share.
How Much Biosimilars Have Saved
The Association for Accessible Medicines publishes yearly estimates, prepared by IQVIA, of how much US patients and payers saved from biosimilar competition.
| Year | Savings | Savings since 2016 |
|---|---|---|
| 2016 | $0.1 billion | $0.1 billion |
| 2017 | $0.2 billion | $0.3 billion |
| 2018 | $0.5 billion | $0.8 billion |
| 2019 | $1.9 billion | $2.7 billion |
| 2020 | $4.2 billion | $6.9 billion |
| 2021 | $7.3 billion | $14.2 billion |
| 2022 | $9.4 billion | $23.6 billion |
| 2023 | $12.4 billion | $36.0 billion |
| 2024 | $20.2 billion | $56.2 billion |
| 2025 | $25.4 billion | $81.6 billion |
Source: Association for Accessible Medicines (AAM), 2026 US Generic and Biosimilar Medicines Savings Report, September 2026.
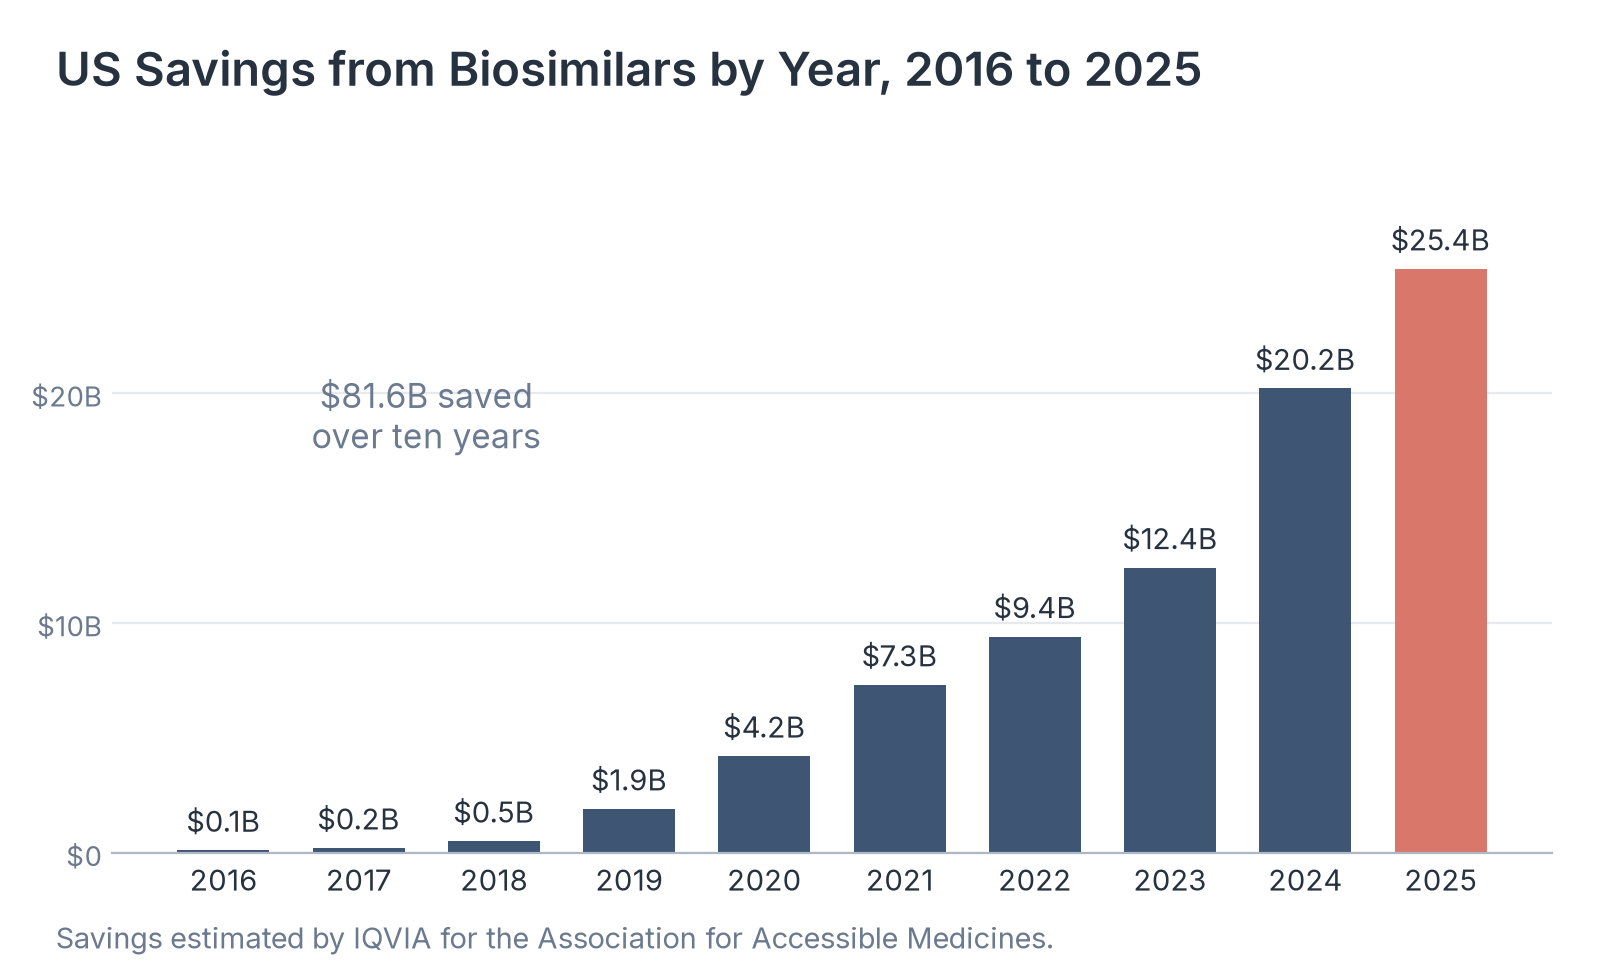
Source: Healthcare Industry Reviews analysis of AAM and IQVIA data, conducted November 2026.
Key Findings
- Savings rose from $20.2 billion in 2024 to $25.4 billion in 2025, and 2024 and 2025 together accounted for 56% of the $81.6 billion saved since 2016. Biosimilars added 571 million days of therapy in 2025 that AAM estimates would not have occurred without competition.
- The biosimilar efficiency rate, the rate at which biosimilars are dispensed when available, fell from nearly 40% in 2024 to 23% in 2025 because several new biosimilars, including insulin aspart and denosumab, had low early uptake.
- Only 10% of the 118 biologics losing patent protection from 2025 to 2034 have biosimilars in development. AAM estimates that competition for the rest could save another $189 billion.
What Biosimilar Adoption Figures Show About the US Market
Biosimilar adoption is high for clinic-administered cancer drugs, where several molecules now have most of their volume in biosimilars, and lower for insulin and most eye drugs. Approvals have increased since 2024, but launches, uptake, and price declines take several years to follow.
The Medicare payment data show two patterns. For some reference products, such as Remicade, payment limits fell to near biosimilar levels. For others, such as Avastin and Rituxan, payment limits stayed high while biosimilars took most of the volume.
So if you are citing biosimilar adoption, give the molecule and the measure, because share, price change, and approvals differ widely between drugs and between the medical and pharmacy benefits.
Data Collection and Methodology
Approval counts are our count of the FDA Biosimilar Product Information list, with content current as of October 28, 2026, by approval date and reference molecule. The FDA lists some products sold under two brand names as a single entry, so its total can be lower than other published counts. Market share and average sales price change figures come from Samsung Bioepis, which uses IQVIA data; molecule shares are as of Q2 2026 except epoetin alfa, adalimumab, and insulin glargine, which come from the report's Figure 10 for the latest year.
Medicare payment limits are from the October CMS ASP pricing file for each year from 2015 to 2026. We converted each billing code's payment limit to a common unit (100 mg, or 300 mcg for filgrastim), used the reference product's current and earlier codes, and took the median across biosimilar codes with a payment limit in each file. We left out pegfilgrastim because its billing code and unit changed during the period. Savings figures are IQVIA estimates published by the Association for Accessible Medicines. We calculated changes, medians, and shares from the published values.
Sources
- Healthcare Industry Reviews analysis of FDA biosimilar approvals for 2015 to 2026, Samsung Bioepis market data for 2026, CMS Medicare Part B payment limits for 2015 to 2026, and AAM savings estimates for 2016 to 2025, conducted November 2026.
- US Food and Drug Administration. Biosimilar Product Information. Content current as of October 28, 2026.
- Samsung Bioepis. Biosimilar Market Report, Q4 2026. October 2026.
- Centers for Medicare & Medicaid Services. ASP Pricing Files. October 2015 to October 2026.
- Association for Accessible Medicines. 2026 US Generic and Biosimilar Medicines Savings Report. September 2026.
- Centers for Medicare & Medicaid Services. Frequently Asked Questions: Inflation Reduction Act Biosimilars Temporary Payment Increase. October 2022.