Clinical Trial Termination Statistics: 2026 Report
Published
Our analysts reviewed 34,695 terminated and 334,482 completed study records on ClinicalTrials.gov, covering trials that ended from the registry's early years through November 9, 2026. We sorted the stated reason for every terminated interventional trial to show how often clinical trials stop early, at which phase, and why, as of Q4 2026.
Key Findings
- ClinicalTrials.gov listed 34,695 terminated studies as of November 9, 2026. Among interventional trials that have ended, 30,118 were terminated and 261,790 completed, a termination rate of 10.3%.
- Low or slow enrollment was the most common stated reason for stopping, cited by 10,305 terminated interventional trials (34.2%) and by 31.5% of trials that stopped from 2021 through 2026.
- Combined phase 1/2 trials had the highest termination rate, 20.9%, followed by phase 2 trials at 17.6%. Device, behavioral, and other trials without a drug phase had the lowest rate, 6.6%.
- Business or strategic decisions accounted for 29.9% of industry-sponsored terminations, compared with 2.9% of terminations by universities, hospitals, and other sponsors.
- Trials with at least one US site were terminated at a rate of 15.0%, about twice the 7.1% rate for trials run only outside the United States.
Every year, thousands of clinical trials stop before they finish. A drug company may stop developing a compound, a hospital may fail to find enough eligible patients, or an independent monitoring board may see that a treatment is not working. When that happens, the trial's record on ClinicalTrials.gov, the federal registry run by the National Library of Medicine, changes to “terminated,” and the sponsor writes a short note explaining why. Patients who volunteered have taken on the risks of a study that may never answer its question, and sponsors have spent money they cannot recover. A 2015 review of trials with posted results found that about 12% had been terminated, and insufficient enrollment was the leading reason among trials that stopped for reasons other than their own data.3 Reporters, research sites, and investors still ask the same questions a decade later: how often trials stop, at which phase, and why. The answers differ a great deal by who runs the trial.
Our analysts downloaded every study record with a terminated or completed status from the ClinicalTrials.gov API, 34,695 terminated studies and 334,482 completed studies as of November 9, 2026. We focused on the 30,118 terminated and 261,790 completed interventional trials, which test a drug, device, procedure, or behavioral program. We sorted each terminated trial's stated reason into one of 11 categories and measured termination rates by year, phase, sponsor type, and location. We also compared how many participants terminated and completed trials enrolled.
In the following sections, we compare clinical trial terminations by year, phase, stated reason, sponsor type, and location, and then look at how many participants were enrolled when trials stopped.
How Many Clinical Trials Are Terminated Each Year
Each terminated record carries the date the trial stopped, which the registry stores as its completion date. Counting trials by that year shows whether terminations are becoming more or less common as the number of trials grows.
| Year stopped or completed | Terminated | Completed | Termination rate |
|---|---|---|---|
| 2010 | 1,048 | 7,998 | 11.6% |
| 2011 | 1,141 | 8,764 | 11.5% |
| 2012 | 1,249 | 9,559 | 11.6% |
| 2013 | 1,236 | 9,981 | 11.0% |
| 2014 | 1,305 | 10,836 | 10.7% |
| 2015 | 1,400 | 11,882 | 10.5% |
| 2016 | 1,520 | 12,809 | 10.6% |
| 2017 | 1,608 | 13,433 | 10.7% |
| 2018 | 1,647 | 14,110 | 10.5% |
| 2019 | 1,634 | 15,128 | 9.7% |
| 2020 | 1,996 | 13,945 | 12.5% |
| 2021 | 1,867 | 14,585 | 11.3% |
| 2022 | 2,026 | 16,629 | 10.9% |
| 2023 | 1,990 | 17,682 | 10.1% |
| 2024 | 1,829 | 18,019 | 9.2% |
| 2025 | 1,525 | 16,728 | 8.4% |
| 2026 (through Nov. 9) | 757 | 9,894 | 7.1% |
Source: Healthcare Industry Reviews analysis of ClinicalTrials.gov API records as of November 9, 2026, conducted November 2026. Termination rate is terminated trials as a share of terminated plus completed trials ending that year.
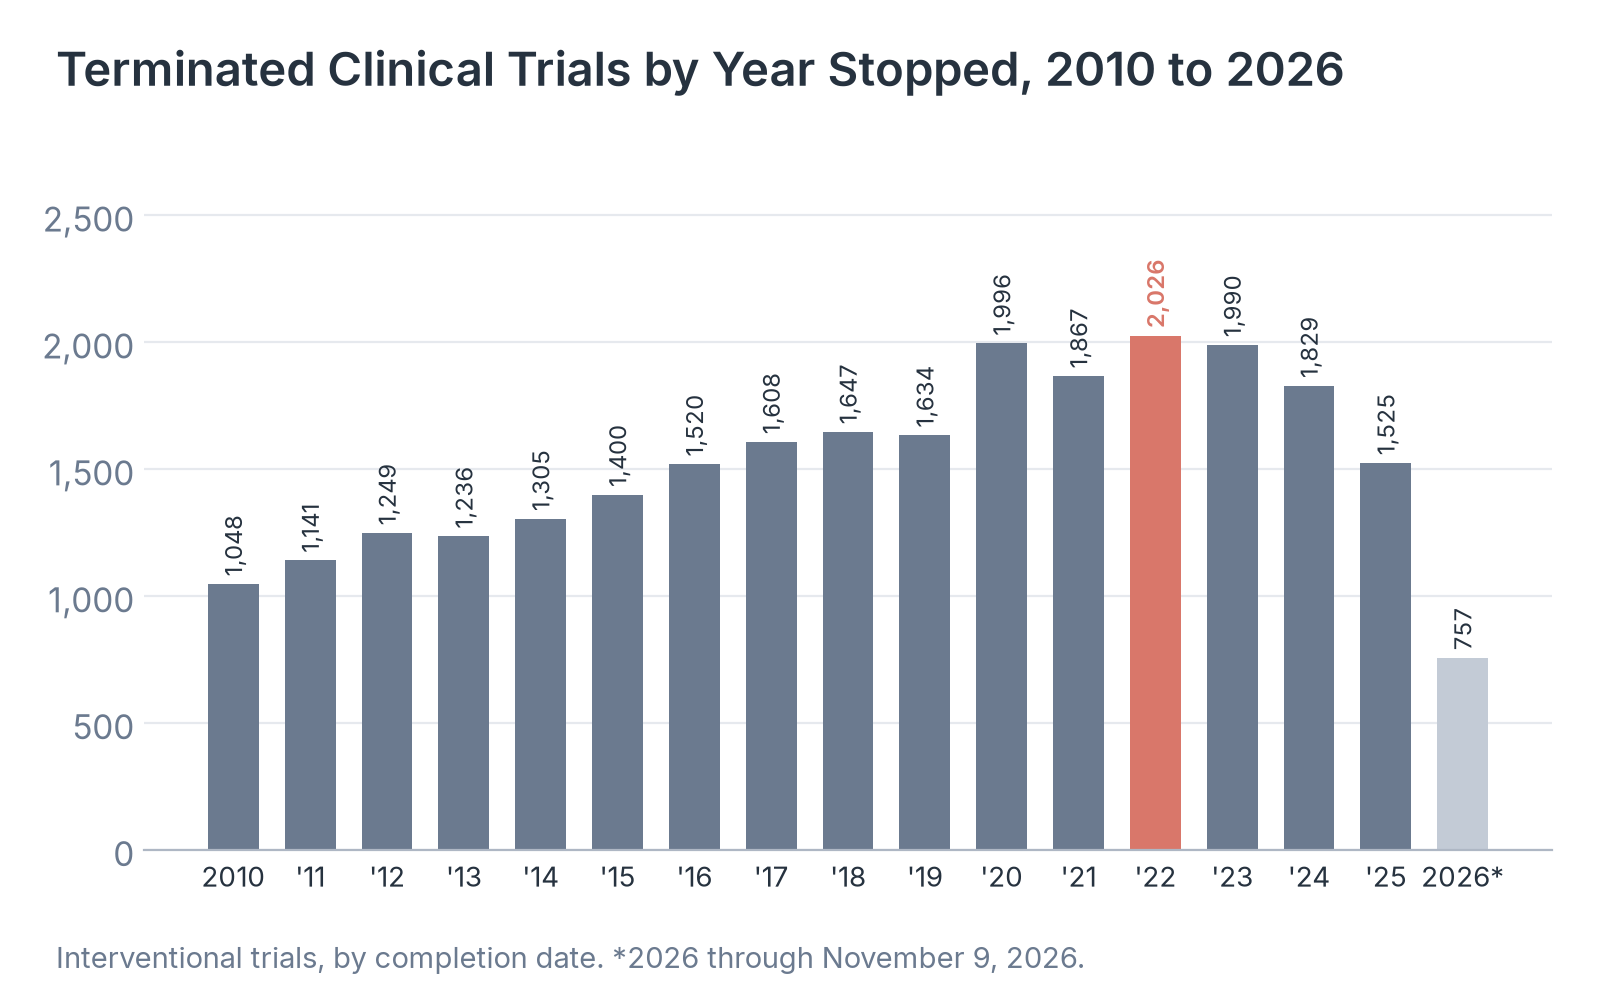
Source: Healthcare Industry Reviews analysis of ClinicalTrials.gov API records as of November 9, 2026, conducted November 2026.
Key Findings
- Terminations rose from 1,048 trials in 2010 to a peak of 2,026 in 2022, while completions grew faster, from 7,998 to 16,629. The number of terminations then fell to 1,525 in 2025.
- The termination rate jumped to 12.5% in 2020, the highest of any year since 2010, as the COVID-19 pandemic shut down research sites and enrollment. It has fallen every year since, to 8.4% in 2025.
- The 2026 count of 757 terminations and 9,894 completions covers trials that ended from January 1 through early November, so the year's 7.1% rate is partial. Even so, it continues the decline that began after 2020.
Termination Rates by Clinical Trial Phase
Drug trials move through numbered phases, from small first-in-human safety studies in phase 1 to large phase 3 trials that support approval and phase 4 studies after a drug is on the market. Device, behavioral, and procedure trials usually have no phase. We calculated a termination rate for each phase using every trial that has ended.
| Phase | Terminated | Completed | Termination rate |
|---|---|---|---|
| Early phase 1 | 424 | 2,724 | 13.5% |
| Phase 1 | 4,010 | 32,878 | 10.9% |
| Phase 1/2 | 1,991 | 7,532 | 20.9% |
| Phase 2 | 7,328 | 34,383 | 17.6% |
| Phase 2/3 | 667 | 3,844 | 14.8% |
| Phase 3 | 3,529 | 26,300 | 11.8% |
| Phase 4 | 2,717 | 21,307 | 11.3% |
| Not applicable (device, behavioral, and other) | 9,452 | 132,822 | 6.6% |
Source: Healthcare Industry Reviews analysis of ClinicalTrials.gov API records as of November 9, 2026, conducted November 2026. Interventional trials only.
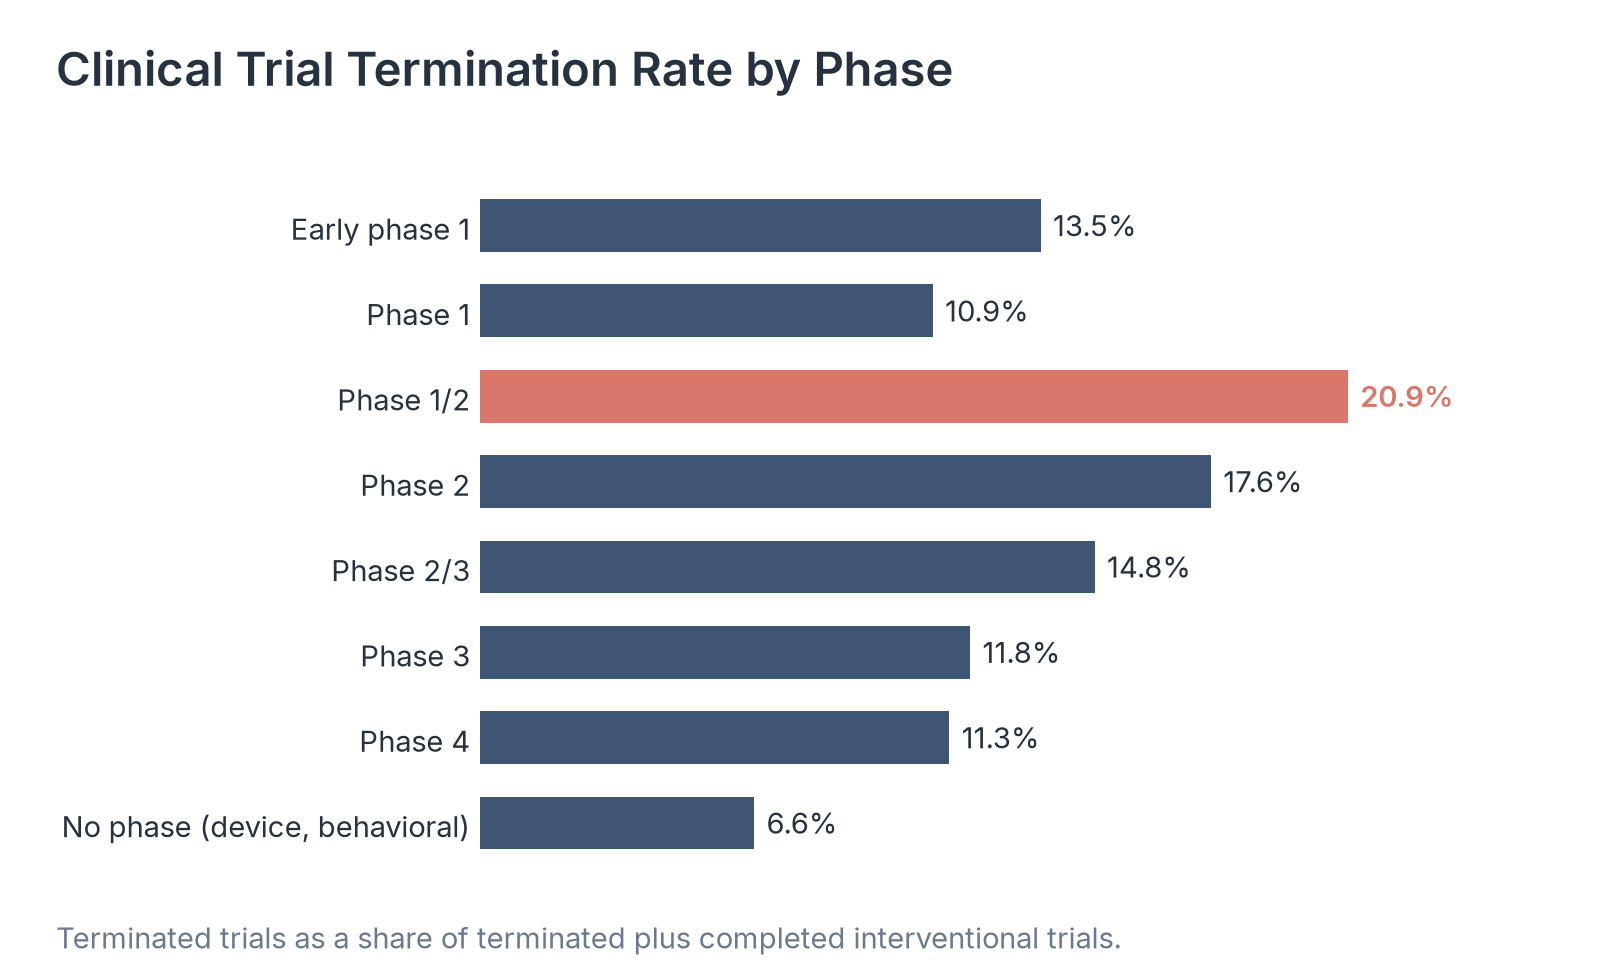
Source: Healthcare Industry Reviews analysis of ClinicalTrials.gov API records as of November 9, 2026, conducted November 2026.
Key Findings
- Phase 2 trials, where a drug is first tested for whether it works, account for 7,328 terminations, more than any other drug phase. At 17.6%, their termination rate is well above the 10.3% rate for all interventional trials.
- Combined phase 1/2 trials stopped most often, at 20.9%. These trials fold dose-finding and a first test of whether a drug works into a single study, so they face the setbacks of both phases.
- Phase 3 trials were terminated at 11.8%, close to the phase 1 rate of 10.9%. Because completed phase 3 trials enroll a median of 250 participants, each one that stops affects far more patients than an early-phase termination.
Why Clinical Trials Are Terminated
Sponsors must give a brief reason when they stop a trial, written in their own words. We read the patterns in those notes and sorted every terminated interventional trial into one of 11 categories, then compared all terminated trials with those that stopped in the past six years.
| Reason | All terminated trials | Share | Stopped 2021 to 2026 | Share |
|---|---|---|---|---|
| Low or slow enrollment | 10,305 | 34.2% | 3,144 | 31.5% |
| Business or strategic decision | 3,753 | 12.5% | 2,104 | 21.1% |
| Lack of efficacy or futility | 2,273 | 7.5% | 822 | 8.2% |
| Funding | 1,705 | 5.7% | 706 | 7.1% |
| COVID-19 pandemic | 1,452 | 4.8% | 790 | 7.9% |
| Investigator or staffing change | 1,209 | 4.0% | 407 | 4.1% |
| Safety or adverse events | 980 | 3.3% | 315 | 3.2% |
| Regulatory or administrative | 802 | 2.7% | 229 | 2.3% |
| Drug or device supply | 419 | 1.4% | 140 | 1.4% |
| Other | 3,993 | 13.3% | 1,237 | 12.4% |
| Not stated | 3,227 | 10.7% | 101 | 1.0% |
| Total | 30,118 | 100.0% | 9,995 | 100.0% |
Source: Healthcare Industry Reviews analysis of ClinicalTrials.gov API records as of November 9, 2026, conducted November 2026. Each trial is assigned one primary reason.
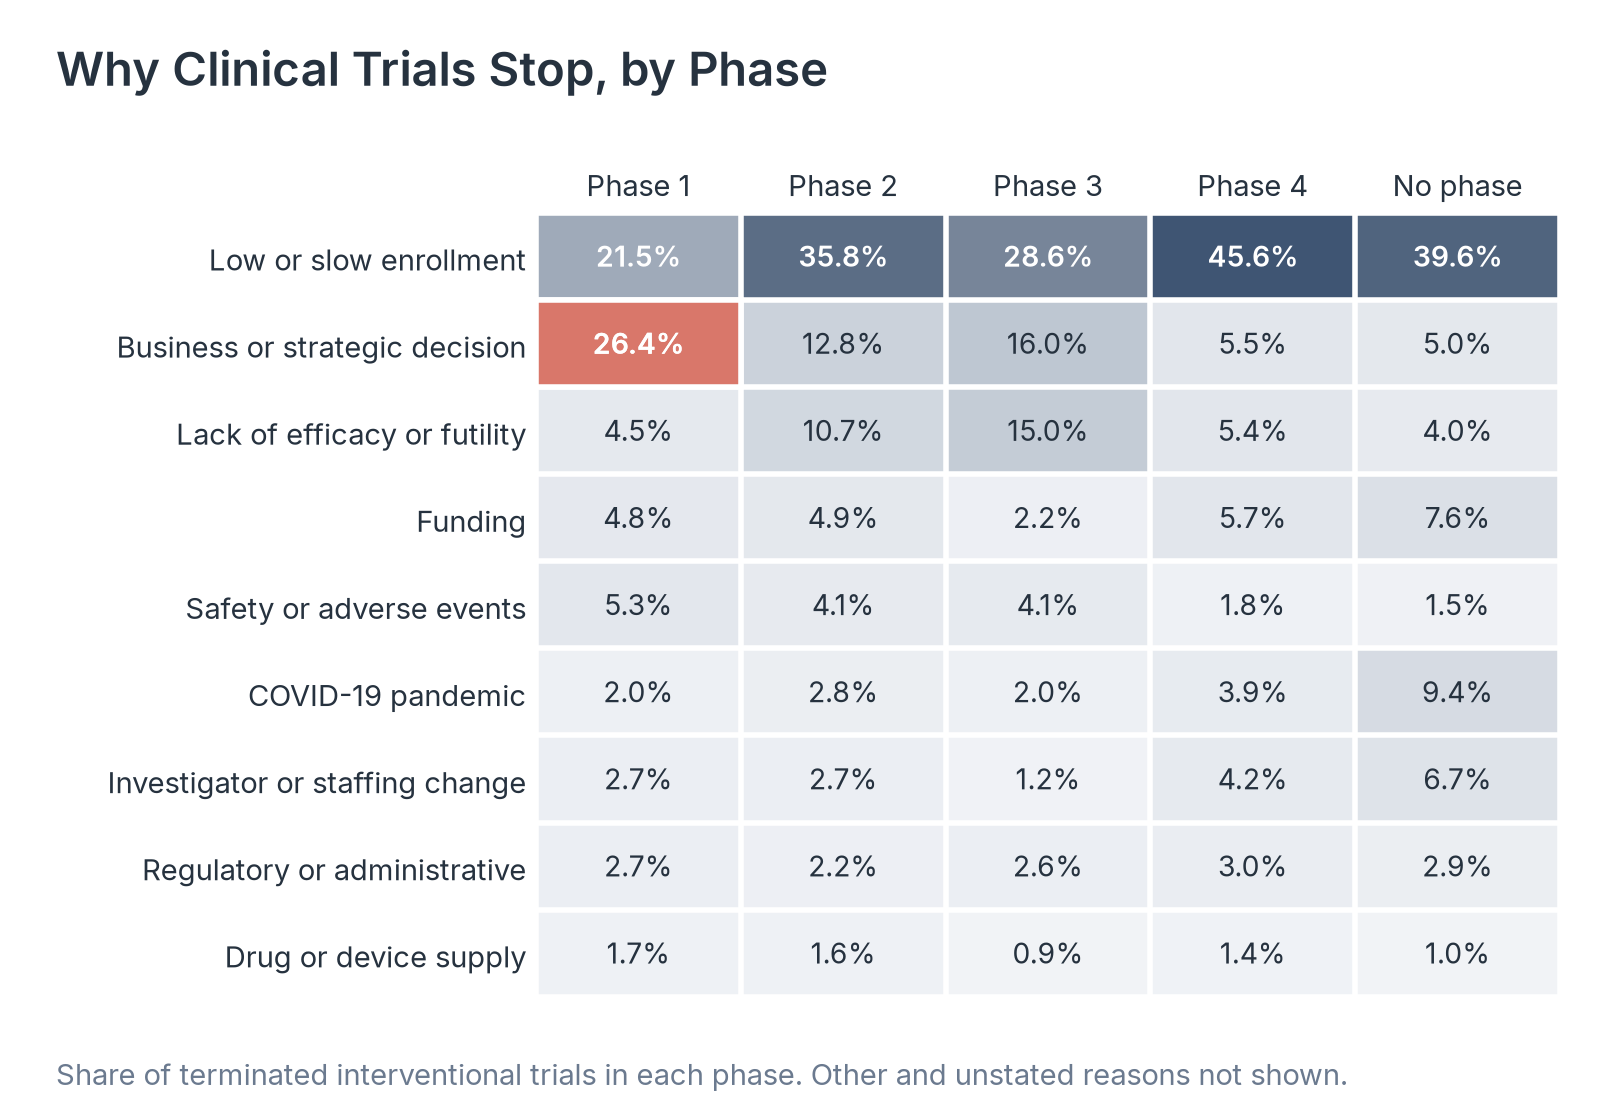
Source: Healthcare Industry Reviews analysis of ClinicalTrials.gov API records as of November 9, 2026, conducted November 2026.
Key Findings
- Low or slow enrollment was the leading reason in phase 2, phase 3, and phase 4 trials and in trials without a phase, and it explains 45.6% of phase 4 terminations. In phase 1, business or strategic decisions led, at 26.4%.
- Lack of efficacy or futility, meaning the treatment was not working well enough to justify continuing, accounted for 15.0% of phase 3 terminations, compared with 4.5% in phase 1. Safety concerns stopped 3.3% of all terminated trials.
- Business decisions account for 12.5% of all terminated trials but 21.1% of those stopped since 2021. Nearly every recent record states a reason: 1.0% of trials stopped since 2021 give none, compared with 10.7% of all terminated trials. Funding problems and departing investigators together explain another 11.1% of recent terminations, so many trials end for reasons unrelated to the treatment being tested.
Termination Rates by Sponsor Type and Trial Location
Drug and device companies, universities and hospitals, and government agencies run trials for different reasons and with different budgets. We compared termination rates and the most common stated reason for each type of lead sponsor, and for trials with and without a site in the United States.
| Lead sponsor or location | Terminated | Completed | Termination rate | Most common stated reason |
|---|---|---|---|---|
| Industry | 10,712 | 76,265 | 12.3% | Business or strategic decision |
| NIH | 752 | 5,687 | 11.7% | Low or slow enrollment |
| Other federal agency | 247 | 2,923 | 7.8% | Low or slow enrollment |
| Non-US government | 291 | 5,348 | 5.2% | Low or slow enrollment |
| Research networks | 327 | 2,135 | 13.3% | Low or slow enrollment |
| Universities, hospitals, and other | 17,744 | 169,109 | 9.5% | Low or slow enrollment |
| Trials with at least one US site | 18,121 | 102,566 | 15.0% | Low or slow enrollment |
| Trials with sites only outside the US | 10,941 | 142,436 | 7.1% | Low or slow enrollment |
Source: Healthcare Industry Reviews analysis of ClinicalTrials.gov API records as of November 9, 2026, conducted November 2026. Interventional trials only. Most common stated reason excludes other and unstated reasons.
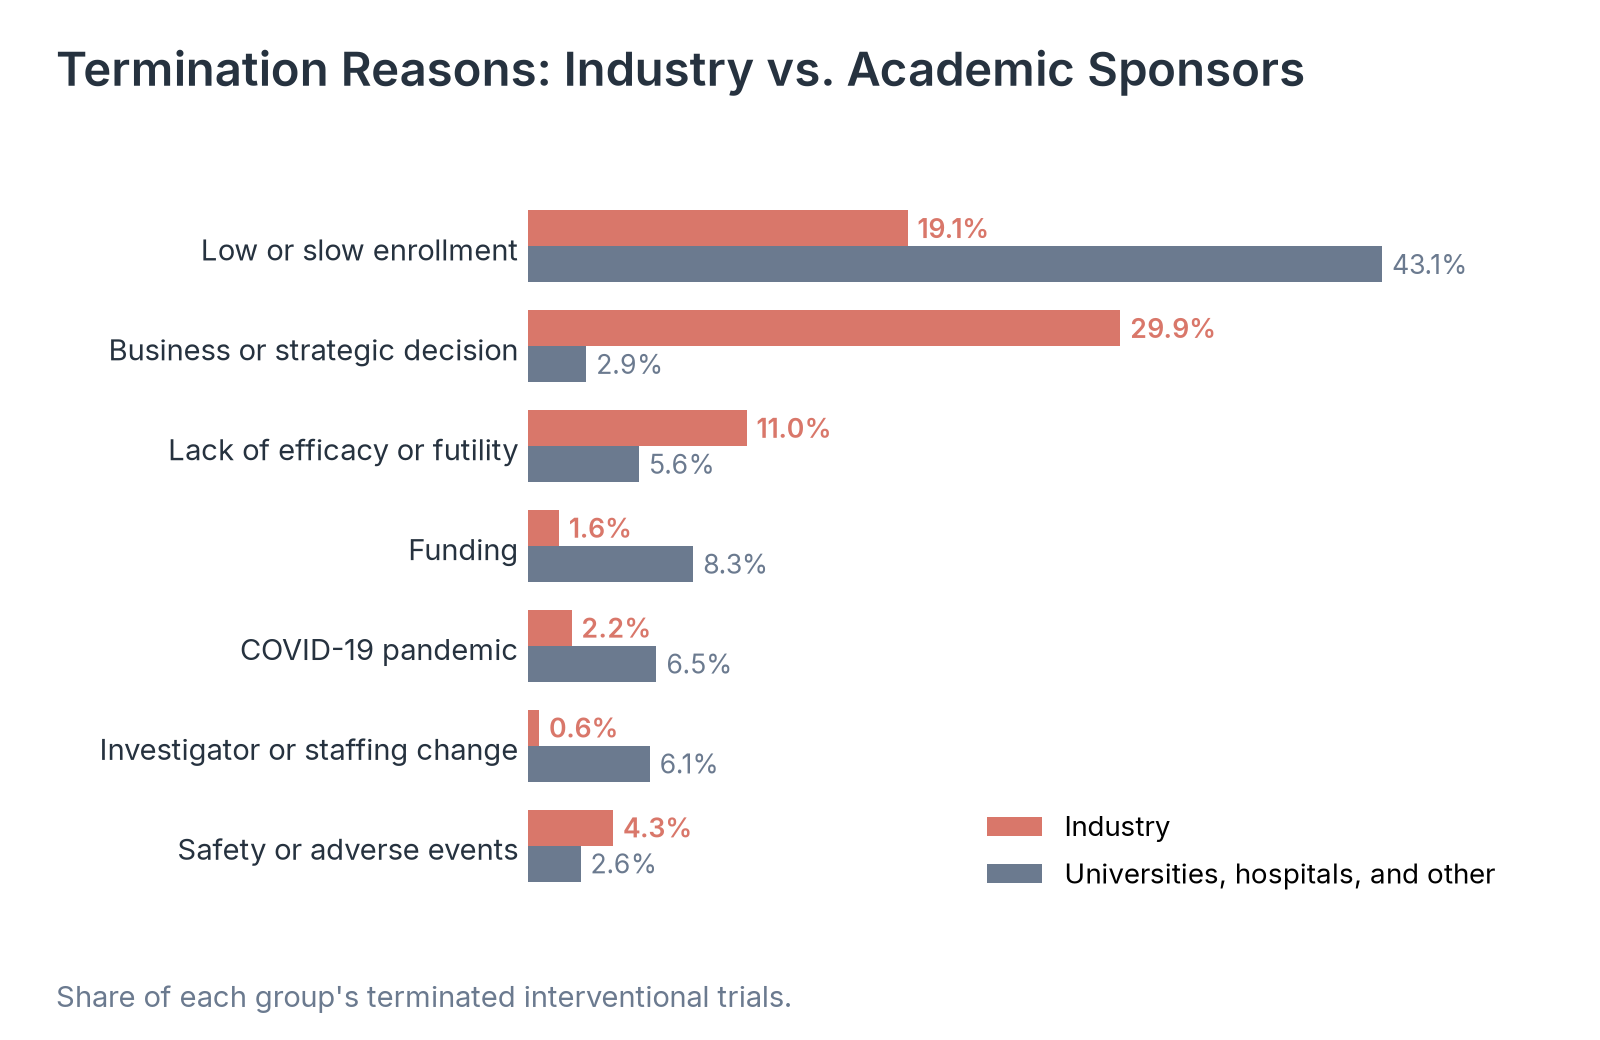
Source: Healthcare Industry Reviews analysis of ClinicalTrials.gov API records as of November 9, 2026, conducted November 2026.
Key Findings
- Industry sponsors terminated 10,712 trials, a rate of 12.3%, compared with 9.5% for universities, hospitals, and other sponsors, which terminated 17,744. Trials led by the National Institutes of Health were terminated at 11.7%.
- Companies most often stopped trials for business or strategic reasons (29.9%), while universities and hospitals most often cited low enrollment (43.1%) and funding (8.3%). Academic sponsors were also far more likely to stop a trial because the lead investigator left or staff changed (6.1% vs. 0.6%).
- The US gap holds within sponsor types. Industry trials with a US site were terminated at 15.7%, compared with 9.1% outside the US, and academic and other trials at 15.1% vs. 6.5%. Trials run only outside the US include more device and behavioral studies without a phase (57.0% vs. 38.9%), which stop least often.
How Many Participants Terminated Trials Enrolled
Terminated records report how many participants a trial had enrolled when it stopped. Those counts show how far trials got before ending and how many patients took part in studies that will not reach their planned conclusion.
| Trials | Terminated (median participants) | Completed (median participants) |
|---|---|---|
| All interventional trials | 19 | 60 |
| Phase 1 | 14 | 30 |
| Phase 2 | 16 | 60 |
| Phase 3 | 79 | 250 |
Source: Healthcare Industry Reviews analysis of ClinicalTrials.gov API records as of November 9, 2026, conducted November 2026. Actual enrollment as reported for 28,336 terminated and 244,919 completed interventional trials.
Source: Healthcare Industry Reviews analysis of ClinicalTrials.gov API records as of November 9, 2026, conducted November 2026.
Key Findings
- The median terminated trial had enrolled 19 participants when it stopped, compared with 60 in the median completed trial. In phase 3, the gap was 79 participants vs. 250.
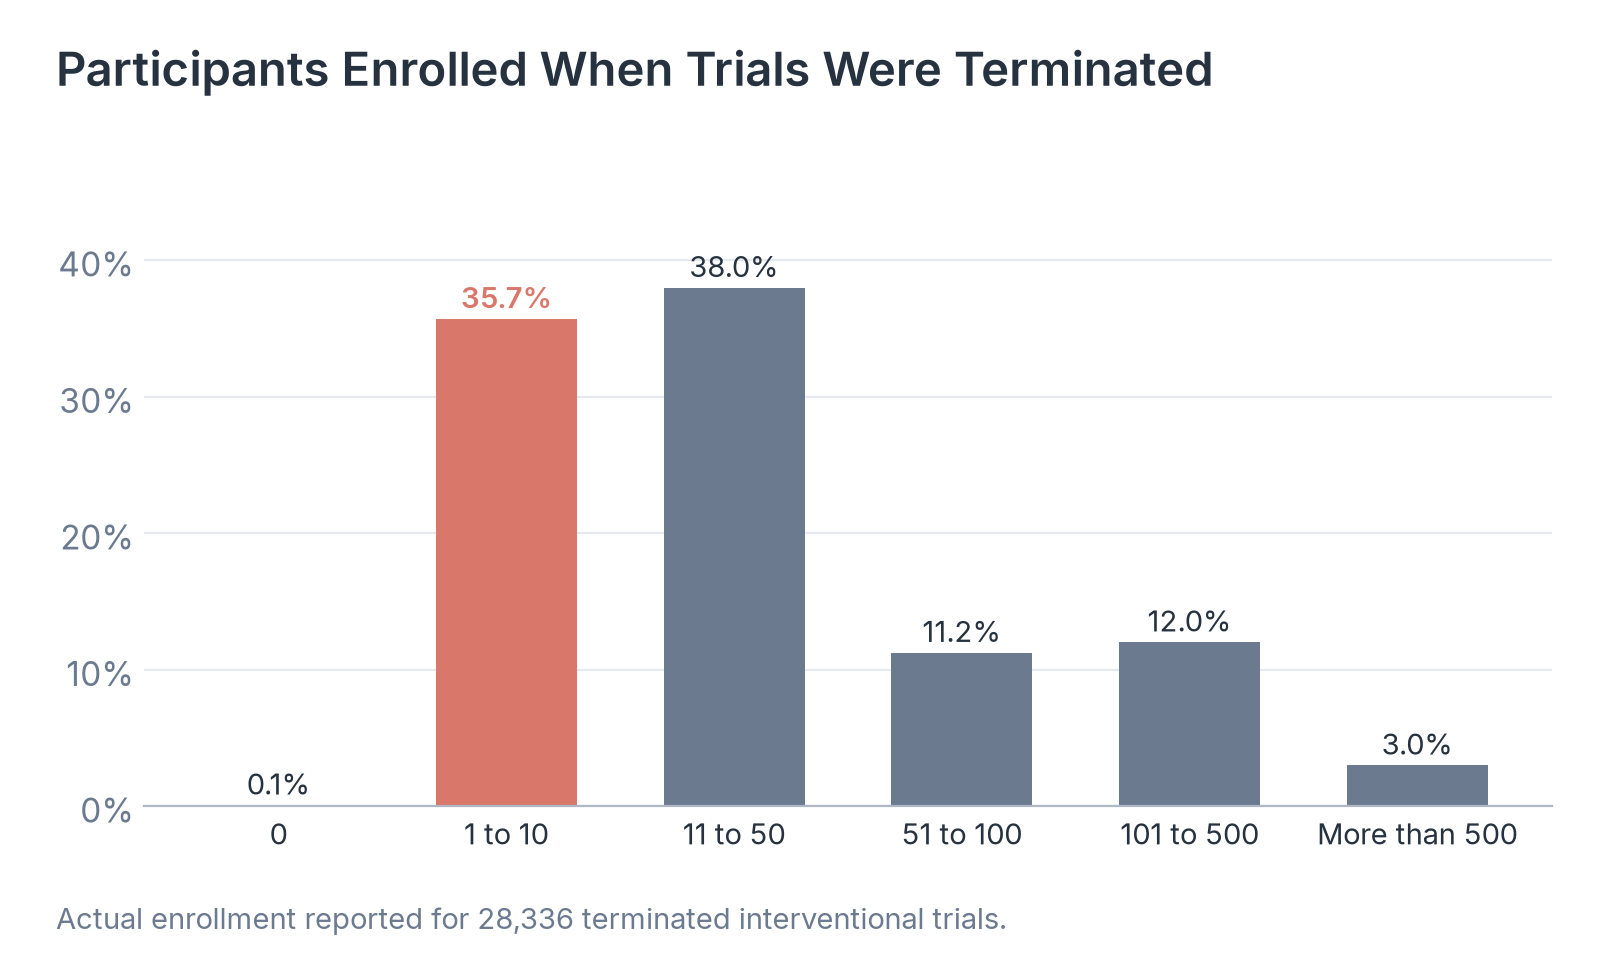
- About 73.7% of terminated trials with reported enrollment had 50 or fewer participants, and 35.7% had 10 or fewer. Another 849 trials, 3.0%, had enrolled more than 500 people before stopping.
- The gap appears in every drug phase. Terminated phase 1 trials had enrolled a median of 14 participants, compared with 30 for completed phase 1 trials, and terminated phase 2 trials 16, compared with 60.
What Clinical Trial Terminations Mean for Patients and Research
About one in ten interventional trials that end on ClinicalTrials.gov is terminated, and the share rises to nearly one in five for phase 2 and phase 1/2 drug trials. Most terminated trials stop early in enrollment, after a few dozen participants at most, and most stop for reasons that have nothing to do with whether the treatment is safe or effective.
Recruitment remains the most common reason trials stop, especially in academic research, and business decisions explain a larger share of terminations since 2021 than in older records. Both are problems a sponsor can often see before a trial opens: whether enough eligible patients live near its sites, and whether the treatment still fits the company's plans.
So if you are reporting on a terminated trial, the phase, the sponsor type, and the stated reason in its registry record will tell you whether it fits the most common pattern or stands out from it.
Data Collection and Methodology
We downloaded all study records with an overall status of terminated (34,695) or completed (334,482) from the ClinicalTrials.gov API (version 2.0.5) on November 10, 2026. The registry's data timestamp was November 9, 2026. We kept interventional studies for all rates and reason counts (30,118 terminated and 261,790 completed). Observational studies (4,577 terminated) are counted only in the total. Withdrawn studies, which stopped before enrolling anyone, and suspended studies, which may resume, are excluded.
Termination rate is the number of terminated trials divided by the number of terminated plus completed trials in the same group. Trials are assigned to a year by their completion date, which for a terminated trial is the date it stopped. Phase comes from the registry's phase field, and sponsor type comes from the lead sponsor class. A trial counts as having a US site if any listed location is in the United States; 1,056 terminated trials list no location and are excluded from the location rows.
We classified each terminated trial's free-text “why stopped” note with a set of keyword rules applied in a fixed order (safety, efficacy or futility, COVID-19, enrollment, funding, investigator or staffing, business or strategy, drug or device supply, and regulatory or administrative), after removing phrases that rule a reason out, such as “not due to safety concerns.” Each trial receives one primary reason. Notes that only point to another field, or are blank, are counted as not stated. A hand review of 100 randomly drawn notes agreed with the assigned category in 95 cases. Blank notes are most common in older records; the field became required for most trials in 2017.
Enrollment figures use actual enrollment as reported in each record. Counts for recent years can change as sponsors update their records. We calculated rates, shares, and medians directly from the downloaded records.
Sources
- Healthcare Industry Reviews analysis of ClinicalTrials.gov records for 34,695 terminated and 334,482 completed studies, as of November 9, 2026, conducted November 2026.
- National Library of Medicine. ClinicalTrials.gov API, version 2.0.5. Data timestamp November 9, 2026. Accessed November 10, 2026.
- Williams RJ, Tse T, DiPiazza K, Zarin DA. Terminated Trials in the ClinicalTrials.gov Results Database: Evaluation of Availability of Primary Outcome Data and Reasons for Termination. PLOS ONE. May 26, 2015.