Community Health Center Statistics: 2026 Report
Published
Our analysts reviewed five years of HRSA Uniform Data System reports covering 2021 through 2025, including 2025 data from 1,356 health center awardees and state reports for all 50 states and the District of Columbia, to show who community health centers serve, how they are paid, and what their care costs as of Q4 2026.
Key Findings
- Community health centers served 32,746,392 patients in 2025, up 8.5% from 30,193,278 in 2021.
- Medicaid or the Children's Health Insurance Program (CHIP) covered 47.9% of health center patients in 2025, and 17.2% had no insurance, down from 20.3% in 2021.
- The number of health center patients aged 65 and older grew 27.3% from 2021 to 2025, to 4,186,809, faster than any other age group.
- Total cost per health center patient rose 37.2%, from $1,218.59 in 2021 to $1,671.85 in 2025, in nominal dollars.
- West Virginia had the most health center patients per resident in 2025, at 335.9 per 1,000, compared with 27.1 in Minnesota and a US average of 94.1.
Community health centers are local clinics that treat medical, dental, mental health, and substance use needs. They adjust their fees to a patient's income and family size, are governed by boards where most members are patients, and must serve everyone, even people who cannot pay.2 About 90% of their patients have incomes below 200% of the federal poverty level, so their finances depend heavily on Medicaid and on grants from the Health Resources and Services Administration (HRSA) Health Center Program.2 Every grantee, called an awardee, reports its patients, services, quality-of-care results, costs, and revenue to HRSA each year through the Uniform Data System (UDS). Those reports show a patient base that has changed in the last five years, and the change has not been even across the country.
Our analysts compiled national UDS results for 2021 through 2025 from HRSA's data portal, covering patients by age and insurance, service use, quality-of-care measures, and costs, plus 2025 revenue by source.3 We also pulled the 2025 UDS summary for each state and the District of Columbia and divided each state's patient count by its July 1, 2025 population from the Census Bureau's Vintage 2025 estimates.5 The 2025 national figures cover 1,356 reporting awardees.
In the following sections, we break down health center patients by age, insurance status, and state, along with cost per patient, revenue sources, and quality-of-care results.
How Many Patients Community Health Centers Serve
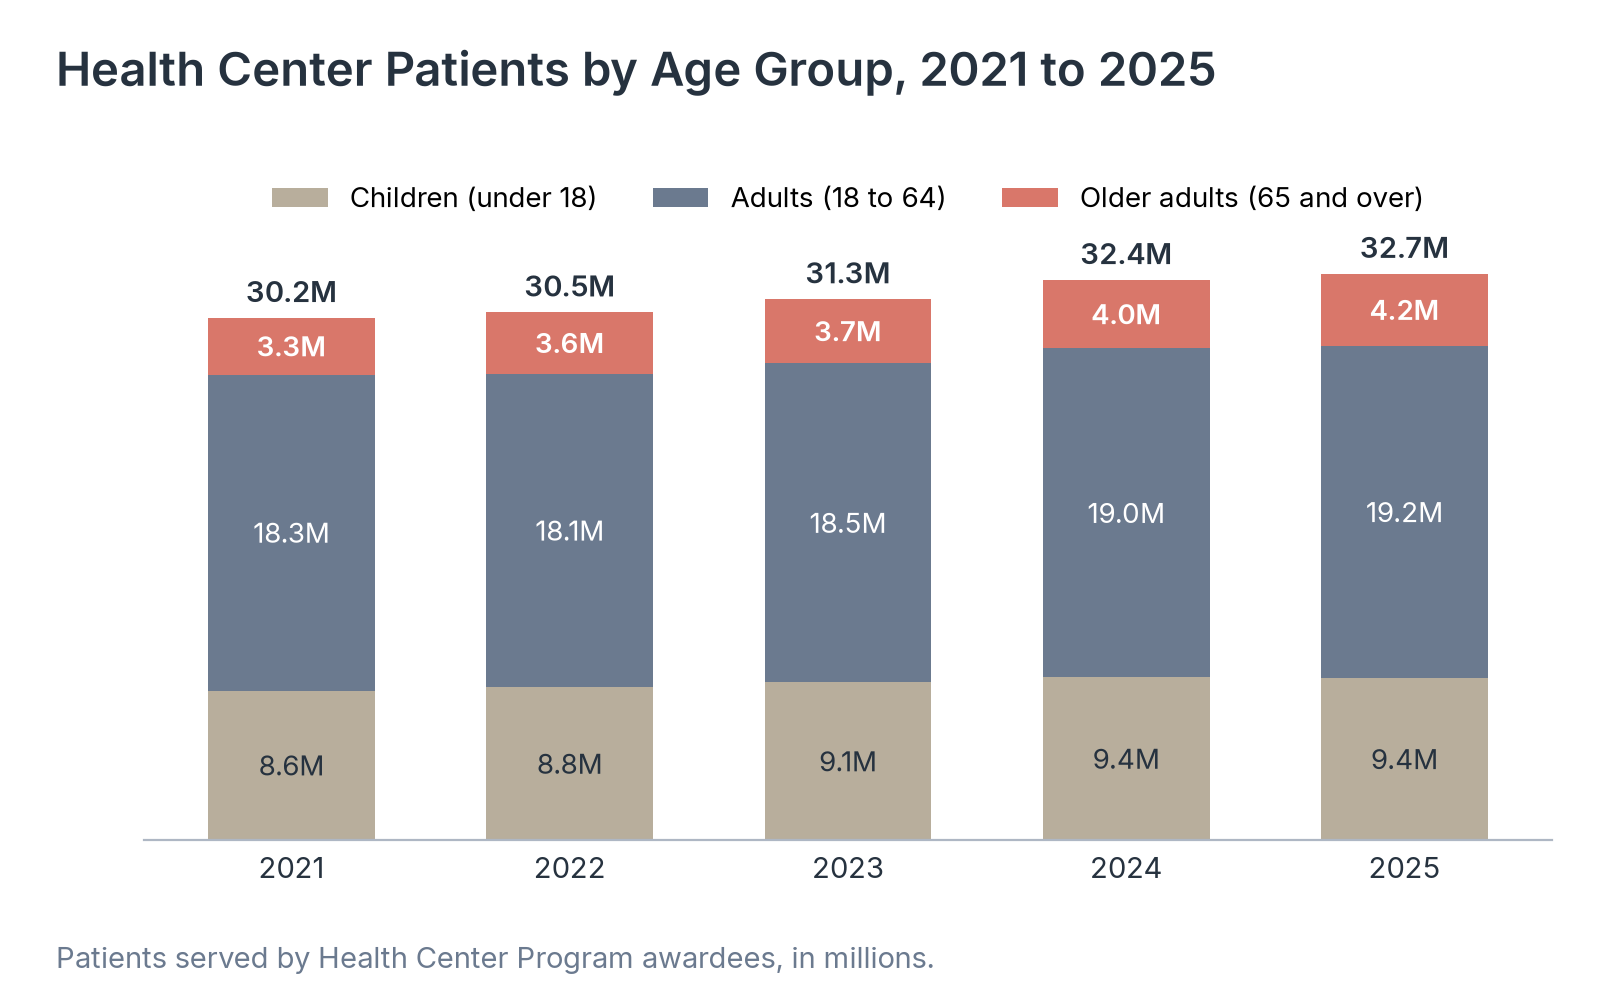
We started with the number of people health centers see each year, split by age, because the age mix shapes which services a clinic has to staff for.
| Year | Total patients | Children (under 18) | Adults (18 to 64) | Older adults (65 and over) | Share aged 65 and over |
|---|---|---|---|---|---|
| 2021 | 30,193,278 | 8,635,363 | 18,268,669 | 3,289,246 | 10.9% |
| 2022 | 30,517,276 | 8,824,109 | 18,137,909 | 3,555,258 | 11.7% |
| 2023 | 31,277,341 | 9,110,850 | 18,458,338 | 3,708,153 | 11.9% |
| 2024 | 32,387,774 | 9,402,165 | 19,021,539 | 3,964,070 | 12.2% |
| 2025 | 32,746,392 | 9,365,906 | 19,193,677 | 4,186,809 | 12.8% |
Source: Health Resources and Services Administration (HRSA), National Health Center Program Uniform Data System (UDS) Awardee Data, 2021 to 2025.
Source: Healthcare Industry Reviews analysis of HRSA Uniform Data System data for 2021 to 2025 and Census Bureau Vintage 2025 population estimates, conducted November 2026.
Key Findings
- Health centers added 2,553,114 patients between 2021 and 2025. Growth slowed to 1.1% in 2025, after a 3.6% increase in 2024.
- Patients aged 65 and older rose from 3,289,246 in 2021 to 4,186,809 in 2025, and their share of all patients climbed from 10.9% to 12.8%. Over the same period, the number of children grew 8.5% and the number of adults aged 18 to 64 grew 5.1%.
- The number of child patients fell by 36,259 in 2025, the only year-over-year drop for any age group in the five years. For clinics, a patient base that is growing older means more Medicare-covered visits and more long-term care for chronic conditions alongside pediatric care.
How Health Center Patients Are Insured
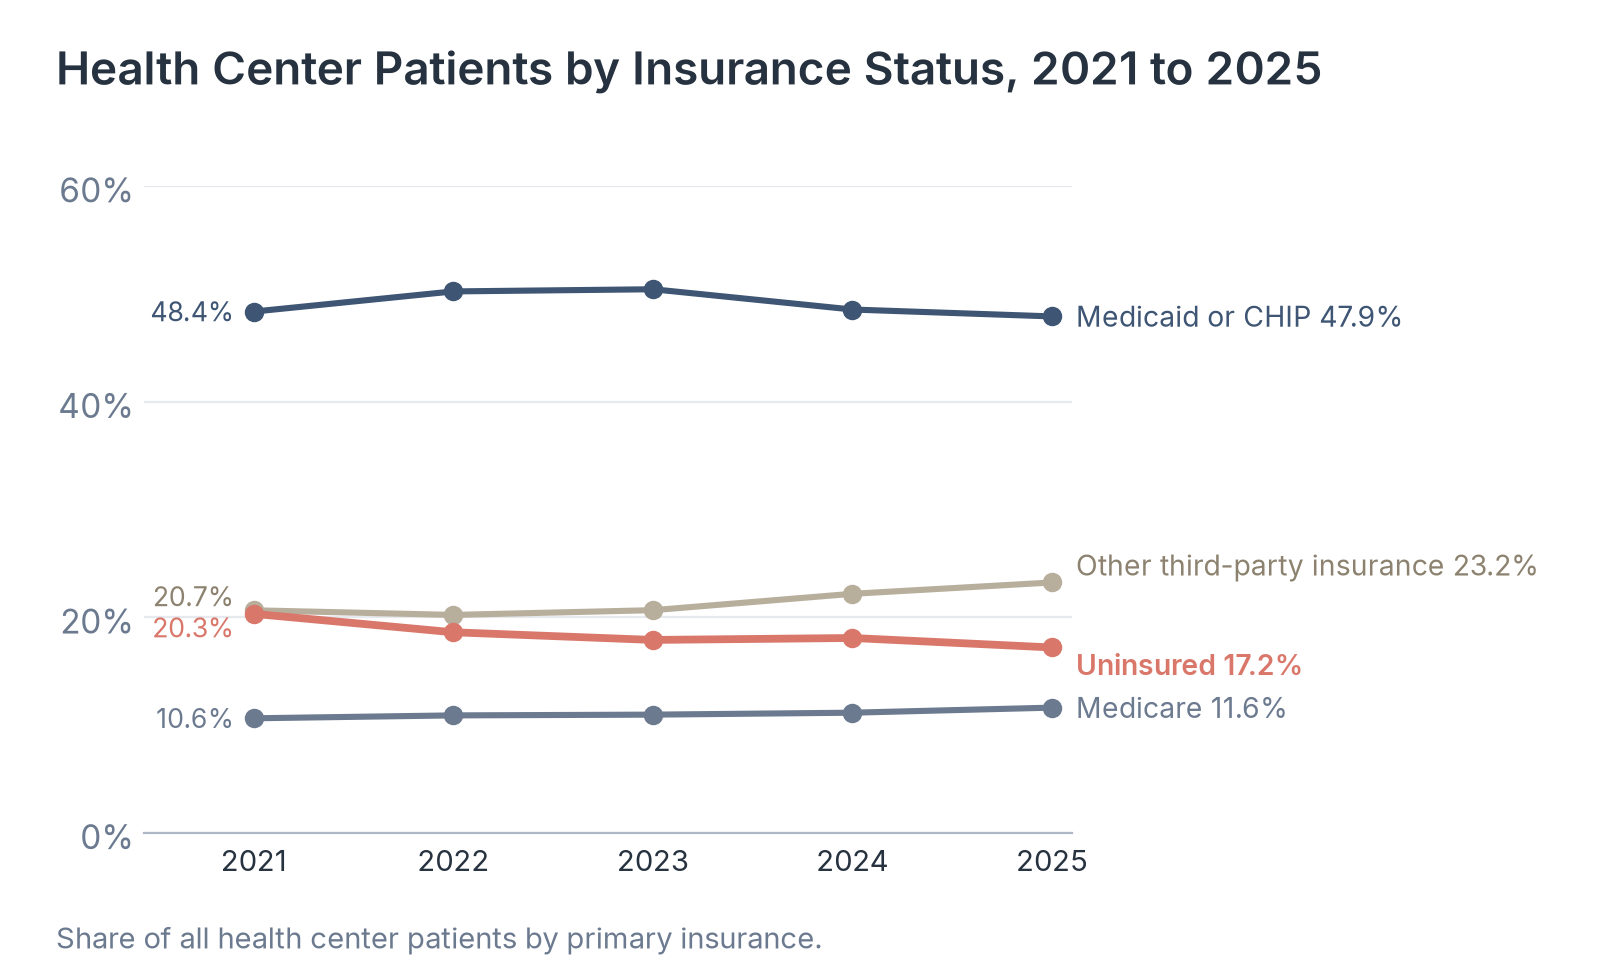
Insurance status decides how a health center is paid for each visit, so we tracked the share of patients in each coverage group, along with family income for the patients who reported it.
| Year | Uninsured | Medicaid or CHIP | Medicare | Other third-party insurance | At or below the poverty line | At or below 200% of the poverty line |
|---|---|---|---|---|---|---|
| 2021 | 20.3% | 48.4% | 10.6% | 20.7% | 66.7% | 89.7% |
| 2022 | 18.6% | 50.2% | 10.9% | 20.2% | 66.3% | 89.7% |
| 2023 | 17.9% | 50.4% | 11.0% | 20.7% | 67.3% | 89.9% |
| 2024 | 18.1% | 48.6% | 11.2% | 22.2% | 67.5% | 90.0% |
| 2025 | 17.2% | 47.9% | 11.6% | 23.2% | 67.7% | 90.0% |
Source: Health Resources and Services Administration (HRSA), National Health Center Program Uniform Data System (UDS) Awardee Data, 2021 to 2025. Income shares are of patients with known income.
Source: Healthcare Industry Reviews analysis of HRSA Uniform Data System data for 2021 to 2025 and Census Bureau Vintage 2025 population estimates, conducted November 2026.
Key Findings
- The uninsured share of health center patients fell from 20.3% in 2021 to 17.2% in 2025, with a small rise from 17.9% in 2023 to 18.1% in 2024. In 2025, 5,634,840 health center patients had no insurance.
- Medicaid or CHIP coverage peaked at 50.4% of patients in 2023 and fell to 47.9% in 2025. Other third-party insurance rose from 20.7% to 23.2% over the five years, and Medicare rose from 10.6% to 11.6%.
- Among patients with known income, 67.7% lived at or below the federal poverty line in 2025, up from 66.7% in 2021. Health centers kept serving a mostly low-income population as Medicaid coverage declined after 2023, so changes in Medicaid eligibility affect both their patients and their largest source of revenue.
Which States Have the Most Health Center Patients per Resident
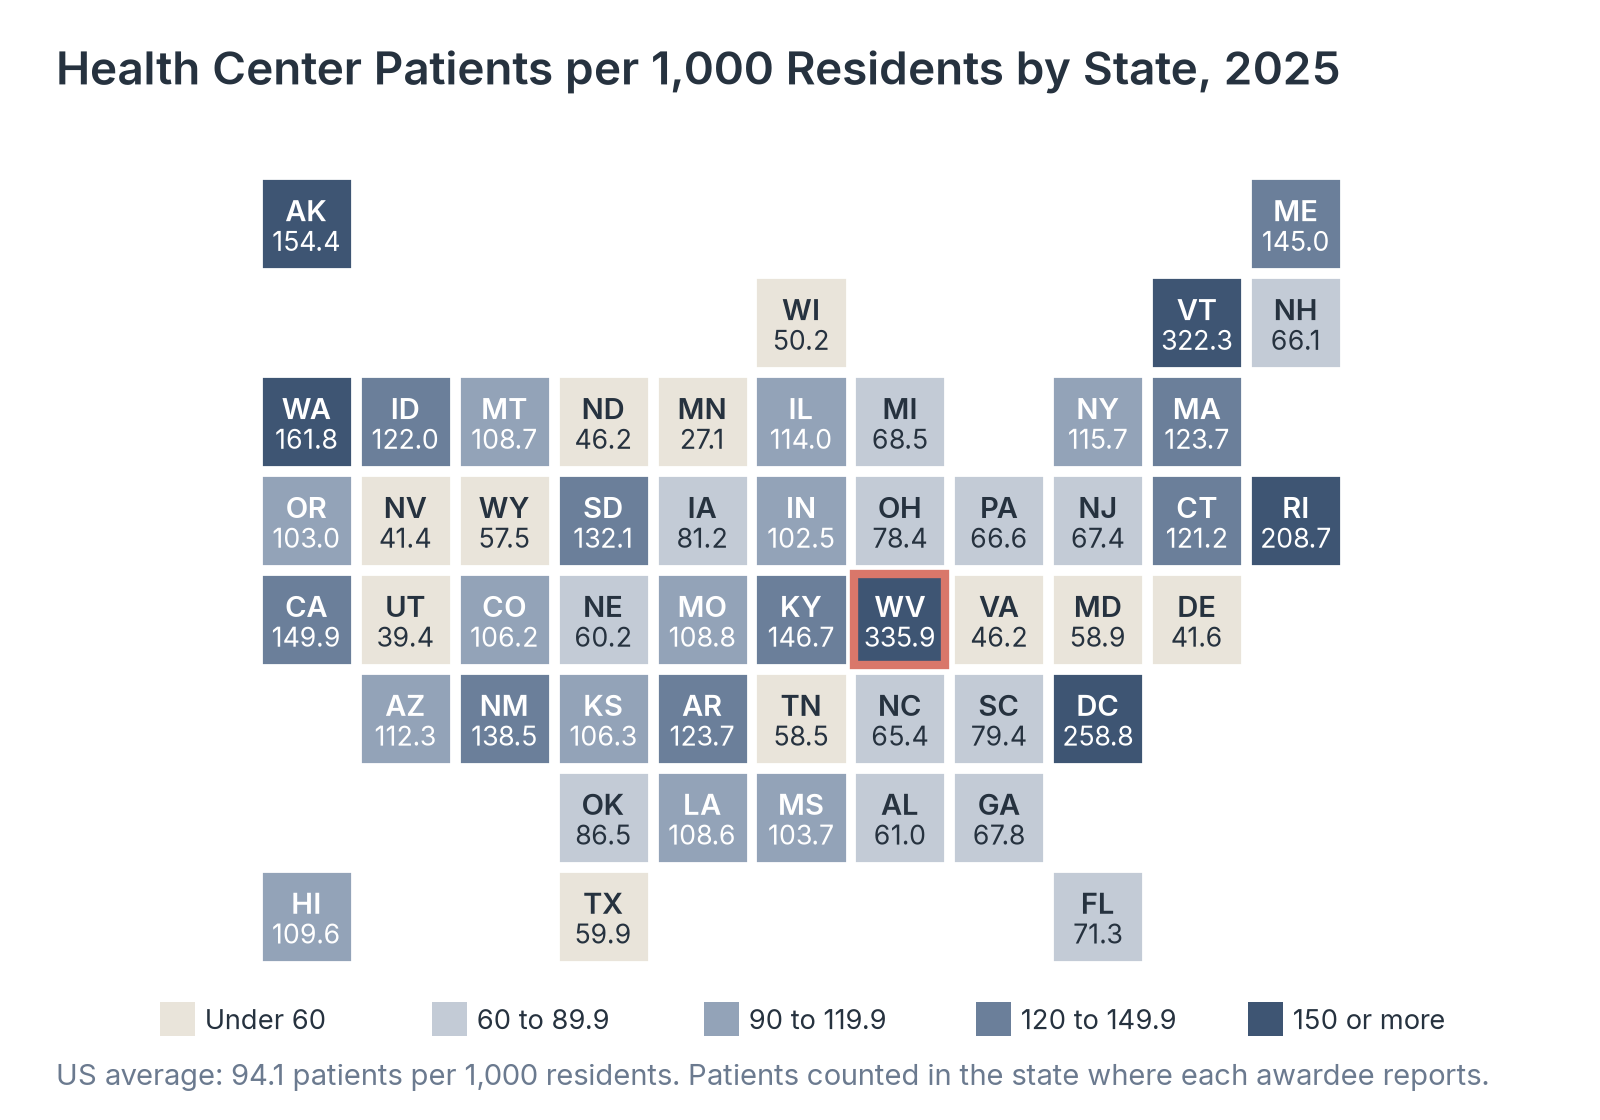
Raw patient counts favor large states, so we compared each state's 2025 health center patients with its population to see where health centers reach the largest share of residents.
| State | Rank | Patients, 2025 | Residents, 2025 | Patients per 1,000 residents | Reporting awardees | Change in patients, 2021 to 2025 |
|---|---|---|---|---|---|---|
| West Virginia | 1 | 593,315 | 1,766,147 | 335.9 | 28 | +17.7% |
| Vermont | 2 | 207,752 | 644,663 | 322.3 | 11 | +12.5% |
| District of Columbia | 3 | 179,535 | 693,645 | 258.8 | 8 | -6.0% |
| Rhode Island | 4 | 232,629 | 1,114,521 | 208.7 | 8 | +22.8% |
| Washington | 5 | 1,294,656 | 8,001,020 | 161.8 | 27 | +8.3% |
| Alaska | 6 | 113,867 | 737,270 | 154.4 | 27 | -1.0% |
| California | 7 | 5,900,539 | 39,355,309 | 149.9 | 170 | +12.6% |
| Kentucky | 8 | 675,713 | 4,606,864 | 146.7 | 25 | +13.8% |
| Maine | 9 | 205,142 | 1,414,874 | 145.0 | 18 | +4.8% |
| New Mexico | 10 | 294,409 | 2,125,498 | 138.5 | 16 | -6.8% |
| South Dakota | 11 | 123,557 | 935,094 | 132.1 | 4 | +22.7% |
| Massachusetts | 12 | 884,863 | 7,154,084 | 123.7 | 37 | +12.2% |
| Arkansas | 13 | 385,249 | 3,114,791 | 123.7 | 12 | +34.8% |
| Idaho | 14 | 247,642 | 2,029,733 | 122.0 | 14 | +22.2% |
| Connecticut | 15 | 447,075 | 3,688,496 | 121.2 | 16 | +9.2% |
| New York | 16 | 2,314,742 | 20,002,427 | 115.7 | 64 | +3.9% |
| Illinois | 17 | 1,450,397 | 12,719,141 | 114.0 | 45 | +0.2% |
| Arizona | 18 | 856,192 | 7,623,818 | 112.3 | 23 | +7.0% |
| Hawaii | 19 | 157,004 | 1,432,820 | 109.6 | 13 | +1.8% |
| Missouri | 20 | 681,965 | 6,270,541 | 108.8 | 27 | +10.6% |
| Montana | 21 | 124,474 | 1,144,694 | 108.7 | 13 | +5.2% |
| Louisiana | 22 | 501,384 | 4,618,189 | 108.6 | 35 | +8.9% |
| Kansas | 23 | 316,544 | 2,977,220 | 106.3 | 19 | +9.7% |
| Colorado | 24 | 638,538 | 6,012,561 | 106.2 | 19 | +0.6% |
| Mississippi | 25 | 306,400 | 2,954,160 | 103.7 | 20 | -1.5% |
| Oregon | 26 | 440,152 | 4,273,586 | 103.0 | 30 | +16.9% |
| Indiana | 27 | 714,585 | 6,973,333 | 102.5 | 26 | +27.3% |
| Oklahoma | 28 | 356,851 | 4,123,288 | 86.5 | 21 | +14.6% |
| Iowa | 29 | 263,006 | 3,238,387 | 81.2 | 14 | +4.0% |
| South Carolina | 30 | 442,323 | 5,570,274 | 79.4 | 23 | +1.3% |
| Ohio | 31 | 933,422 | 11,900,510 | 78.4 | 51 | +9.8% |
| Florida | 32 | 1,673,307 | 23,462,518 | 71.3 | 47 | -0.2% |
| Michigan | 33 | 693,367 | 10,127,884 | 68.5 | 39 | +5.6% |
| Georgia | 34 | 766,045 | 11,302,748 | 67.8 | 35 | +15.7% |
| New Jersey | 35 | 643,753 | 9,548,215 | 67.4 | 23 | +13.1% |
| Pennsylvania | 36 | 869,212 | 13,059,432 | 66.6 | 40 | +5.5% |
| New Hampshire | 37 | 93,585 | 1,415,342 | 66.1 | 9 | +4.7% |
| North Carolina | 38 | 732,318 | 11,197,968 | 65.4 | 38 | +1.5% |
| Alabama | 39 | 316,993 | 5,193,088 | 61.0 | 17 | +1.5% |
| Nebraska | 40 | 121,579 | 2,018,006 | 60.2 | 7 | +7.1% |
| Texas | 41 | 1,898,301 | 31,709,821 | 59.9 | 71 | +9.4% |
| Maryland | 42 | 368,723 | 6,265,347 | 58.9 | 16 | +8.8% |
| Tennessee | 43 | 427,688 | 7,315,076 | 58.5 | 29 | -2.2% |
| Wyoming | 44 | 33,872 | 588,753 | 57.5 | 5 | -2.5% |
| Wisconsin | 45 | 299,686 | 5,972,787 | 50.2 | 16 | +9.7% |
| North Dakota | 46 | 36,924 | 799,358 | 46.2 | 4 | +2.5% |
| Virginia | 47 | 410,092 | 8,880,107 | 46.2 | 26 | +8.6% |
| Delaware | 48 | 44,103 | 1,059,952 | 41.6 | 3 | -5.3% |
| Nevada | 49 | 135,913 | 3,282,188 | 41.4 | 7 | +21.4% |
| Utah | 50 | 139,551 | 3,538,904 | 39.4 | 12 | -14.7% |
| Minnesota | 51 | 158,039 | 5,830,405 | 27.1 | 16 | 0.0% |
| United States (50 states and DC) | 32,146,973 | 341,784,857 | 94.1 | 1324 | +8.2% |
Source: Healthcare Industry Reviews analysis of HRSA Uniform Data System data for 2021 to 2025 and Census Bureau Vintage 2025 population estimates, conducted November 2026, using HRSA state UDS summaries and Census Bureau state population estimates.
Source: Healthcare Industry Reviews analysis of HRSA Uniform Data System data for 2021 to 2025 and Census Bureau Vintage 2025 population estimates, conducted November 2026.
Key Findings
- West Virginia, at 335.9 health center patients per 1,000 residents, and Vermont, at 322.3, were the only states where health centers served about one in three residents in 2025. The District of Columbia, at 258.8, and Rhode Island, at 208.7, came next.
- Minnesota had the lowest rate, at 27.1 patients per 1,000 residents, followed by Utah at 39.4, Nevada at 41.4, and Delaware at 41.6. Utah also had the largest five-year drop in patients, at 14.7%, while Arkansas had the largest gain, at 34.8%.
- Large states differ widely. California's 5,900,539 patients, 18.4% of all patients in the 50 states and DC, come to 149.9 per 1,000 residents, while Texas, with 1,898,301 patients, has 59.9 per 1,000. A change in health center funding therefore reaches a much larger share of residents in West Virginia, Vermont, or California than in Texas or Minnesota.
What Health Center Care Costs per Patient
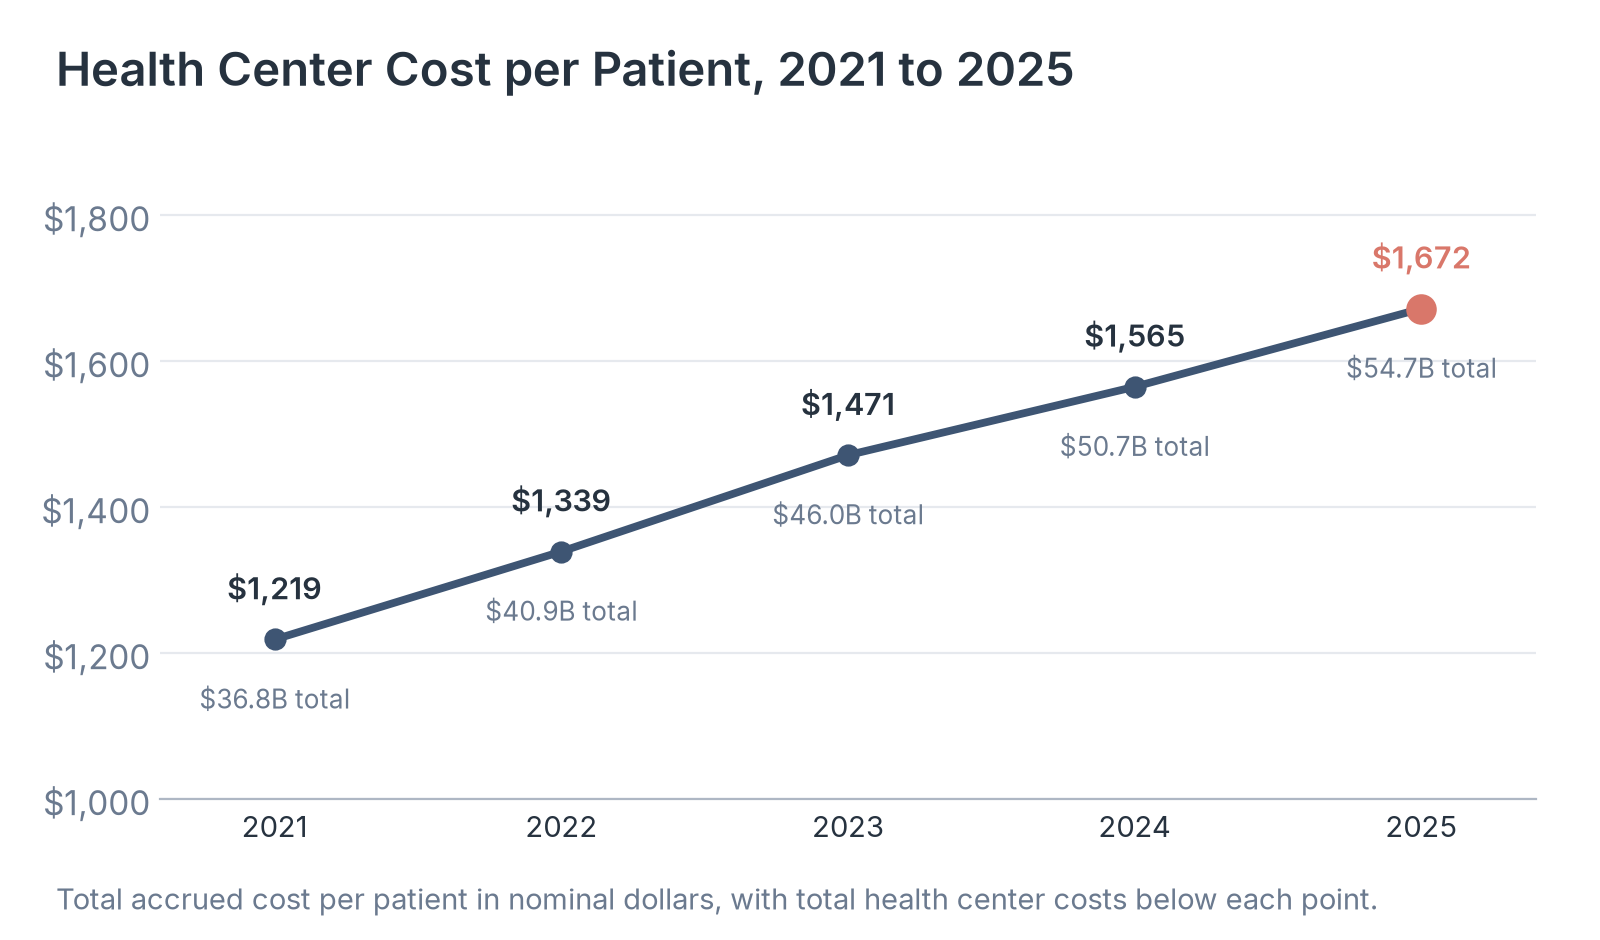
We followed total spending and cost per patient over five years to see how fast health center budgets have grown compared with the number of people they serve.
| Year | Total patients | Total cost | Cost per patient | Health Center Program grant funds | Grant funds as a share of total cost |
|---|---|---|---|---|---|
| 2021 | 30,193,278 | $36.79 billion | $1,218.59 | $5.18 billion | 14.1% |
| 2022 | 30,517,276 | $40.86 billion | $1,339.02 | $5.04 billion | 12.3% |
| 2023 | 31,277,341 | $46.01 billion | $1,471.09 | $5.08 billion | 11.0% |
| 2024 | 32,387,774 | $50.68 billion | $1,564.73 | $5.16 billion | 10.2% |
| 2025 | 32,746,392 | $54.75 billion | $1,671.85 | $5.44 billion | 9.9% |
Source: Health Resources and Services Administration (HRSA), National Health Center Program Uniform Data System (UDS) Awardee Data, 2021 to 2025. Grant funds are the health center cluster grants drawn down each year. Dollar figures are nominal.
Source: Healthcare Industry Reviews analysis of HRSA Uniform Data System data for 2021 to 2025 and Census Bureau Vintage 2025 population estimates, conducted November 2026.
Key Findings
- Total health center costs rose 48.8%, from $36.79 billion in 2021 to $54.75 billion in 2025, while the number of patients grew 8.5%. Cost per patient rose every year, by $453.26 in total.
- Health Center Program grant funds rose 5.0% over the same period, to $5.44 billion in 2025. Those grants covered 9.9% of total costs in 2025, down from 14.1% in 2021.
- With grant funding nearly flat and costs rising, health centers have paid for their growth mostly with revenue from treating patients, which made up 75.6% of their revenue in 2025. That leaves clinic budgets more exposed to changes in what Medicaid, Medicare, and private insurers pay.
Where Health Center Revenue Comes From
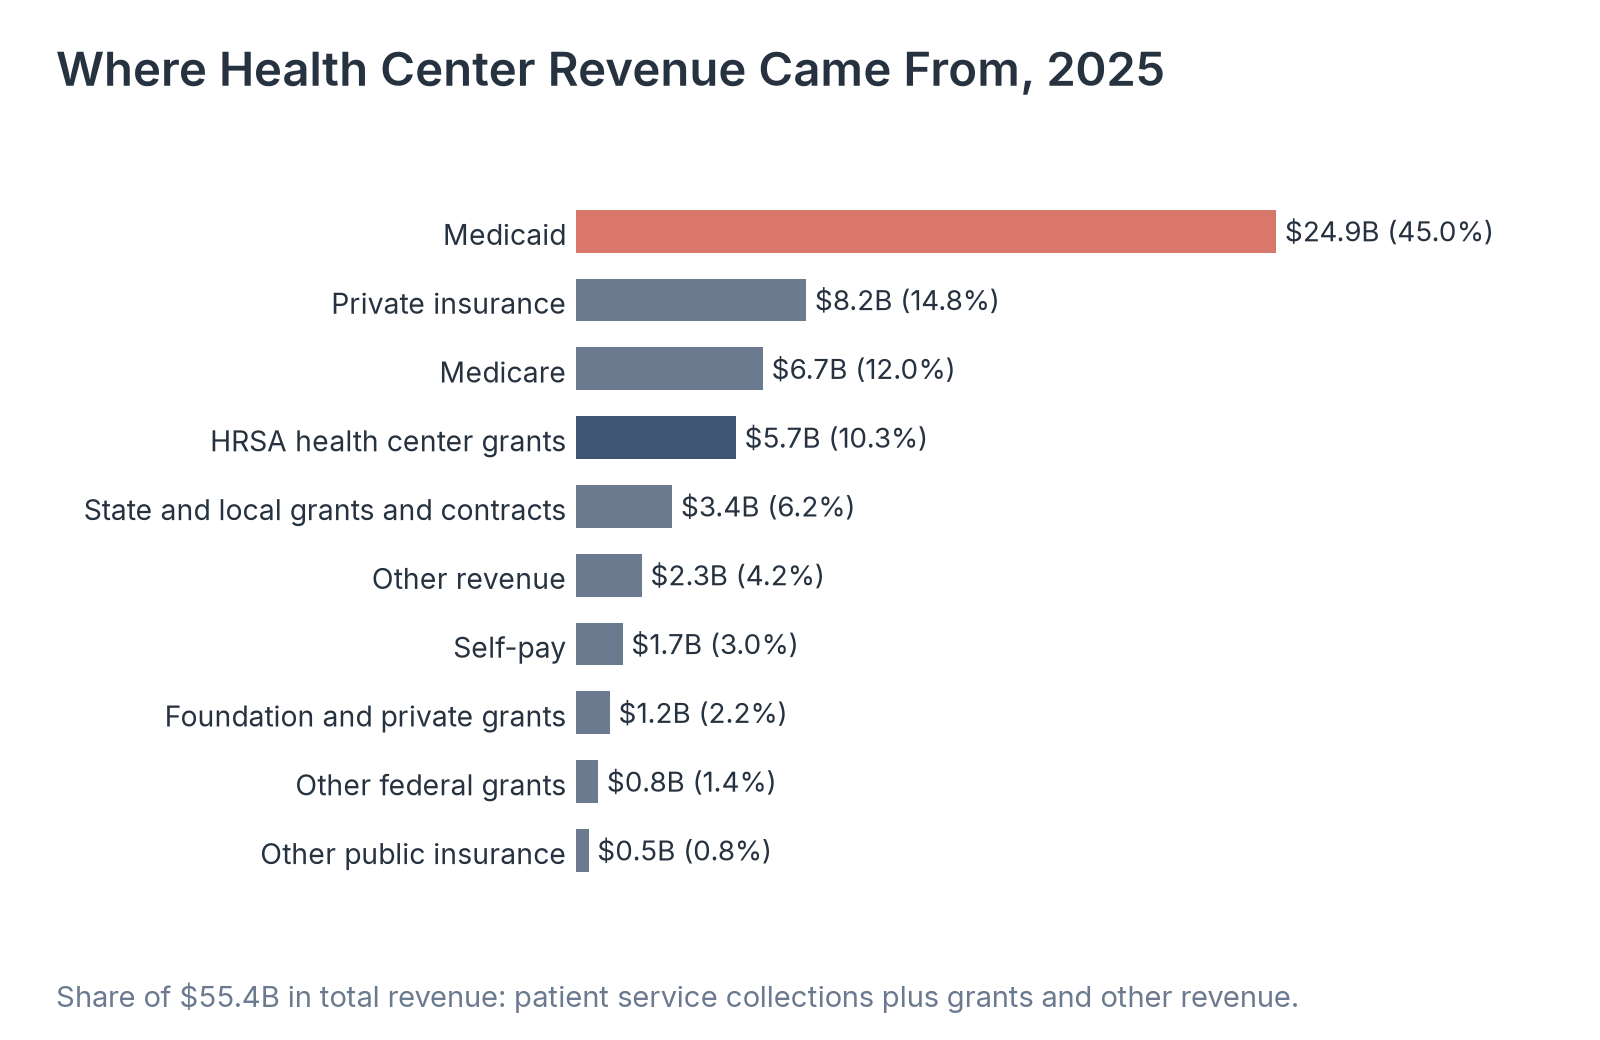
Health centers combine payments for patient care with federal, state, and private grants, so we split 2025 revenue by source to show which payers matter most to their budgets.
| Source | Type | Revenue | Share of total revenue |
|---|---|---|---|
| Medicaid | Patient care | $24.91 billion | 45.0% |
| Private insurance | Patient care | $8.19 billion | 14.8% |
| Medicare | Patient care | $6.65 billion | 12.0% |
| HRSA health center grants | Grants and other revenue | $5.69 billion | 10.3% |
| State and local grants and contracts | Grants and other revenue | $3.43 billion | 6.2% |
| Other revenue | Grants and other revenue | $2.35 billion | 4.2% |
| Self-pay | Patient care | $1.67 billion | 3.0% |
| Foundation and private grants | Grants and other revenue | $1.21 billion | 2.2% |
| Other federal grants | Grants and other revenue | $0.80 billion | 1.4% |
| Other public insurance | Patient care | $0.46 billion | 0.8% |
| Total | $55.36 billion | 100.0% |
Source: HRSA, UDS Table 9D: Patient Service Revenue, 2025 (amounts collected) and UDS Table 9E: Other Revenues, 2025. State and local grants include state indigent care programs.
Source: Healthcare Industry Reviews analysis of HRSA Uniform Data System data for 2021 to 2025 and Census Bureau Vintage 2025 population estimates, conducted November 2026.
Key Findings
- Medicaid paid health centers $24.91 billion in 2025, 45.0% of all revenue and 59.5% of the money collected for patient care. Private insurance, at $8.19 billion, and Medicare, at $6.65 billion, were the next largest sources.
- HRSA's health center grants from its Bureau of Primary Health Care totaled $5.69 billion, or 10.3% of revenue, including capital grants and $160.9 million in remaining COVID-19 supplemental funds. State and local governments added $3.43 billion through grants, contracts, and indigent care programs.
- Health centers collected 87.2% of what they charged Medicaid in 2025, compared with 62.8% from Medicare, 57.4% from private insurance, and 23.7% from patients paying for themselves. When a patient moves from Medicaid to having no insurance, the clinic collects far less for the same visit.
How Health Centers Score on Quality-of-Care Measures
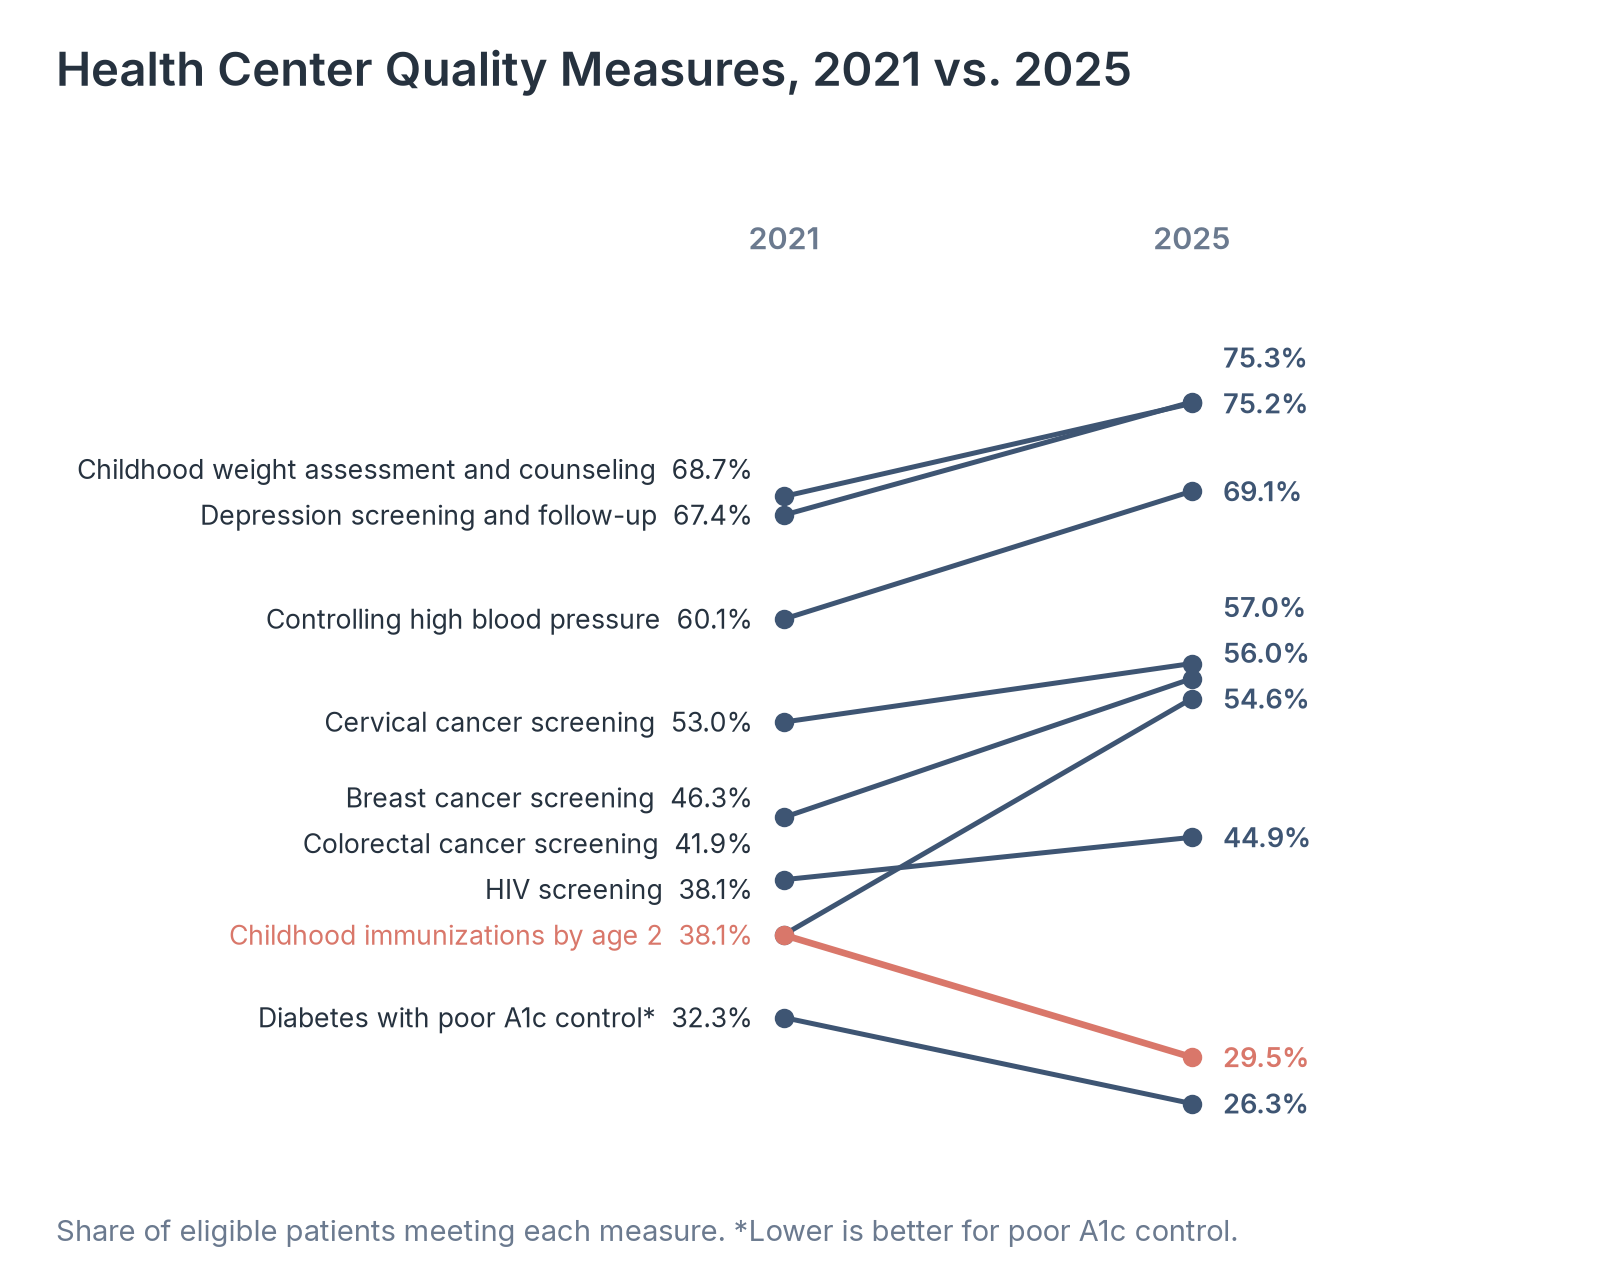
HRSA asks every health center to report the same clinical quality measures each year, so we compared 2021 and 2025 results for cancer screenings, chronic disease control, and childhood immunizations.
| Measure | 2021 | 2025 | Change (percentage points) |
|---|---|---|---|
| Depression screening and follow-up | 67.4% | 75.3% | +7.9 |
| Childhood weight assessment and counseling | 68.7% | 75.2% | +6.5 |
| Controlling high blood pressure | 60.1% | 69.1% | +8.9 |
| Cervical cancer screening | 53.0% | 57.0% | +4.1 |
| Breast cancer screening | 46.3% | 56.0% | +9.7 |
| HIV screening | 38.1% | 54.6% | +16.5 |
| Colorectal cancer screening | 41.9% | 44.9% | +3.0 |
| Childhood immunizations by age 2 | 38.1% | 29.5% | -8.5 |
| Diabetes with poor A1c control (lower is better) | 32.3% | 26.3% | -6.0 |
Source: Health Resources and Services Administration (HRSA), National Health Center Program Uniform Data System (UDS) Awardee Data, 2021 to 2025. Each measure is the share of eligible patients who met it.
Source: Healthcare Industry Reviews analysis of HRSA Uniform Data System data for 2021 to 2025 and Census Bureau Vintage 2025 population estimates, conducted November 2026.
Key Findings
- HIV screening rose the most of any measure, by 16.5 percentage points to 54.6% in 2025. Breast cancer screening rose 9.7 points to 56.0%, and the share of patients with high blood pressure whose blood pressure was under control rose 8.9 points to 69.1%.
- Childhood immunizations by age 2 fell from 38.1% in 2021 to 29.5% in 2025, the only measure in the table that moved in the wrong direction. The rate bottomed out at 28.0% in 2024.
- The share of diabetic patients with poorly controlled blood sugar fell from 32.3% to 26.3%, an improvement. Colorectal cancer screening rose only 3.0 points and stayed below half of eligible patients, at 44.9%, making it the lowest of the adult cancer screenings that health centers report.
What Health Center Trends Mean for Patients and Clinics
For patients, health centers are the regular source of care for a large and growing group of low-income people, including more older adults who need ongoing treatment for chronic conditions. Nearly half of those patients rely on Medicaid, so a change in Medicaid eligibility or in federal grants reaches them through the clinic they already use.
Three-quarters of health center revenue now comes from billing for patient care, which ties clinic finances closely to Medicaid policy and to how much each center can collect from Medicare and private plans. The gap between states also means that the same national policy can affect a third of residents in one state and fewer than 1 in 30 in another.
So if you are reporting on health centers in a single state, compare its patients per 1,000 residents and its five-year change with the national figures above before drawing conclusions from its raw patient count.
Data Collection and Methodology
We took national results for 2021 through 2025 from HRSA's five-year UDS summary for Health Center Program awardees, and 2025 revenue from UDS Tables 9D and 9E. Patient service revenue is the amount collected during 2025, not the amount charged. State and local grants combine state government grants and contracts, state and local indigent care programs, and local government grants and contracts. Other revenue is non-patient service revenue not reported elsewhere. Figures cover Health Center Program awardees only and exclude look-alike clinics that meet program rules without receiving grants.
For the state ranking, we used each state's 2025 UDS summary page, which counts patients served by awardees that report in that state, and divided by the state's July 1, 2025 resident population from the Census Bureau's Vintage 2025 estimates. A patient who crosses a state line for care is counted in the state where the awardee reports. Puerto Rico, with 508,068 patients across 21 awardees, and the other territories are excluded from the ranking and from the 50-state total of 32,146,973 patients, so that total is lower than the national figure of 32,746,392. Income shares use patients with known income as the denominator. Cost per patient is total accrued cost divided by total patients, in nominal dollars with no inflation adjustment. We calculated products, differences, and ratios from the published values.
Sources
- Healthcare Industry Reviews analysis of HRSA Uniform Data System national and state data for 2021 to 2025 and Census Bureau Vintage 2025 state population estimates, conducted November 2026.
- HRSA Bureau of Primary Health Care. What is a Health Center? Reviewed November 2025.
- HRSA. National Health Center Program Uniform Data System (UDS) Awardee Data, 2025 reporting period with five-year summary, and UDS Table 9D: Patient Service Revenue and Table 9E: Other Revenues, 2025.
- HRSA. State or Territory Health Center Program Uniform Data System (UDS) Data, 2025, one summary page per state and the District of Columbia.
- US Census Bureau. Annual Estimates of the Resident Population for the United States, Regions, States, District of Columbia, and Puerto Rico (NST-EST2025-ALLDATA). Vintage 2025.