Dialysis Facility Statistics: 2026 Report
Published
Our analysts reviewed MedPAC's July 2026 Data Book counts of 7,605 dialysis facilities and 137,200 hemodialysis stations at the end of 2024, the National Forum of ESRD Networks census of 516,837 dialysis patients as of March 31, 2025, and the CMS Dialysis Facility listing of 7,490 active facilities by chain and state as published for July 2026. The figures show how US dialysis capacity, patient setting, and chain concentration look as of Q4 2026.
Key Findings
- MedPAC counted 7,605 dialysis facilities at the end of 2024, down 1.4% from 2023, with 137,200 hemodialysis stations and a mean of 18 stations per facility.
- As of March 31, 2025, ESRD Networks reported 7,556 dialysis centers treating 516,837 dialysis patients, of whom 433,396 received in-center hemodialysis and 78,407 dialyzed at home.
- Two chains, DaVita and Fresenius Medical Care, operated 5,500 of 7,490 active CMS-listed facilities (73.4%) in the July 2026 Dialysis Facility listing, and 89.5% of facilities were for-profit.
- Home hemodialysis and peritoneal dialysis both grew faster than in-center hemodialysis from 2013 to 2023, while in-center care still covered 57% of all ESRD patients in 2023.
- Texas (745) and California (734) had the most CMS-listed dialysis facilities in July 2026, followed by Florida (533) and Georgia (355).
Dialysis keeps people with end-stage renal disease alive when their kidneys no longer filter waste. Most patients still go to a dialysis clinic three times a week, while a smaller share dialyzes at home. Facility counts, chain concentration, and the home-care share are the numbers kidney care operators, value-based kidney care vendors, and reporters look up when they ask how the US dialysis market is organized.
Our analysts combined MedPAC's July 2026 Data Book Section 11 facility and modality tables, the National Forum of ESRD Networks census as of March 31, 2025, and chain and state counts from the CMS Dialysis Facility listing as published for July 2026 (7,490 active facilities). We lined up those vintages so readers can see facility capacity, patient setting, ownership concentration, and state totals in one place.
In the following sections, we compare facility capacity and ownership mix, patients by setting, modality trends since 2013, chain concentration, and facilities by state.
How Many Dialysis Facilities Operate in the United States
Facility and station counts measure in-center capacity. MedPAC's end-of-year 2024 file is the most recent national capacity table with a year-over-year change, and the ESRD Networks census adds a March 2025 checkpoint.
| Measure | 2024 | Average annual change, 2019 to 2023 | Change, 2023 to 2024 |
|---|---|---|---|
| Dialysis facilities | 7,605 | 0.2% | -1.4% |
| Hemodialysis stations | 137,200 | 0.8% | -1.0% |
| Mean stations per facility | 18 | - | - |
Source: Medicare Payment Advisory Commission, July 2026 Data Book, Section 11 (Chart 11-1), compiled from CMS institutional outpatient claims and Dialysis Compare files.
| Category | Share of facilities | Average annual change, 2019 to 2023 | Change, 2023 to 2024 |
|---|---|---|---|
| Freestanding | 95% | 0.3% | -1.4% |
| Hospital based | 5% | -2.5% | -0.9% |
| Urban | 84% | 0.4% | -1.2% |
| Rural | 16% | -1.3% | -1.2% |
| For profit | 90% | 0.5% | -0.8% |
| Nonprofit | 10% | -2.5% | -6.8% |
Source: Medicare Payment Advisory Commission, July 2026 Data Book, Section 11 (Chart 11-1). Nonprofit includes government facilities.
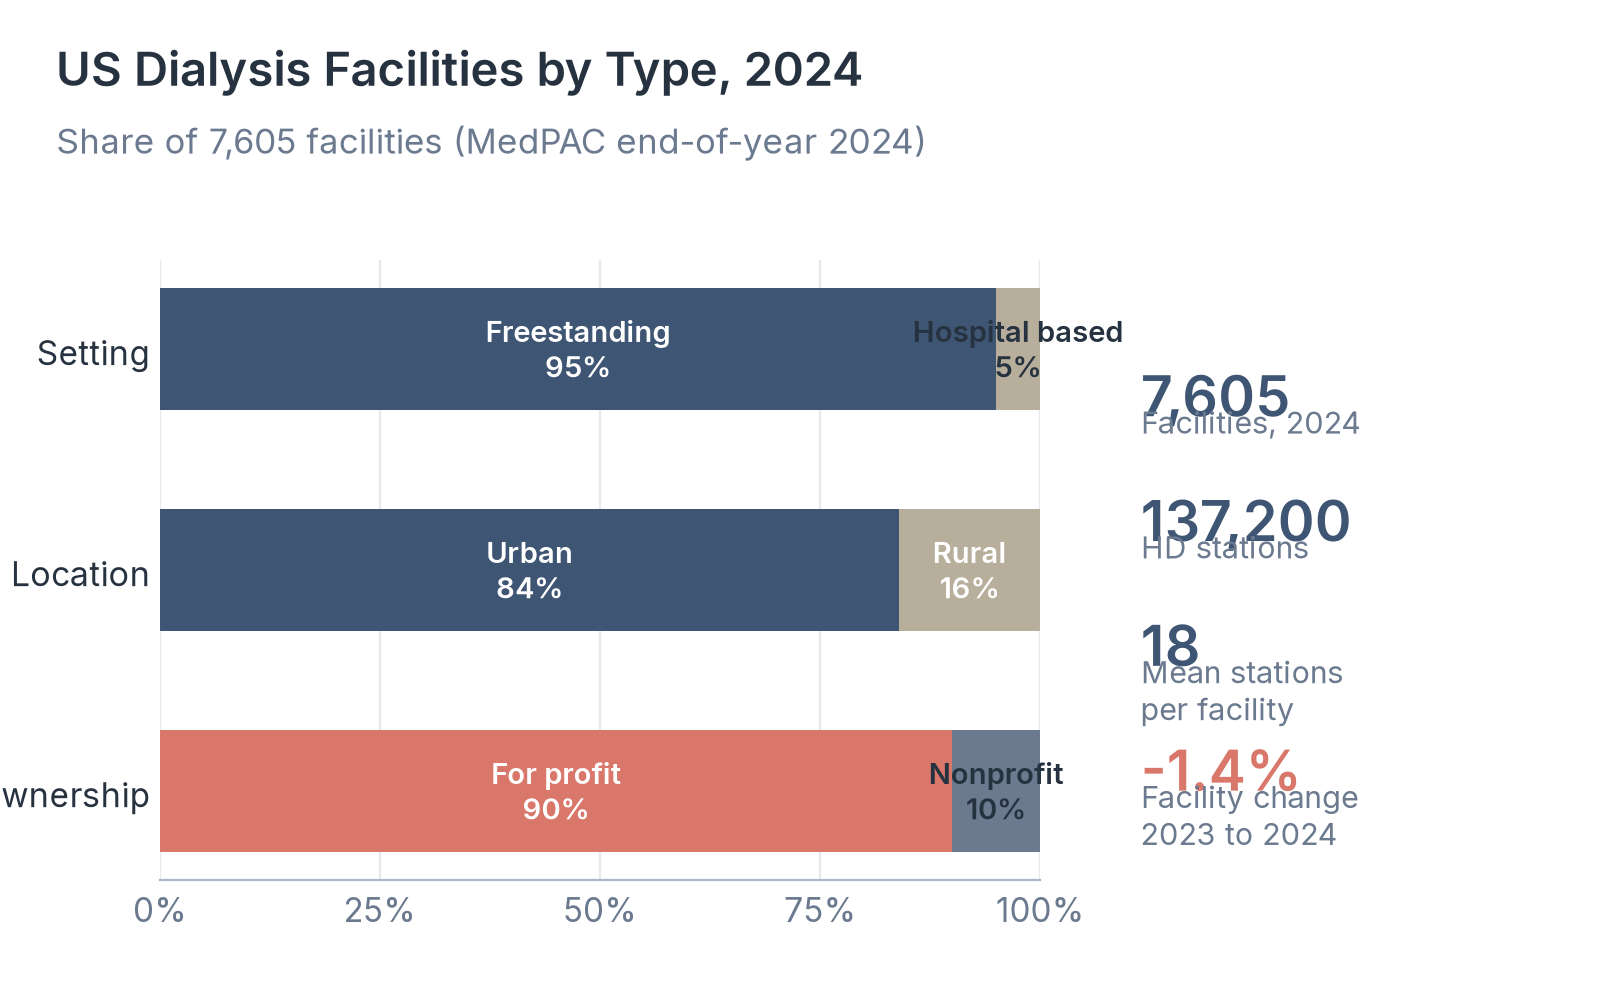
Source: Healthcare Industry Reviews analysis of MedPAC July 2026 Data Book Chart 11-1, November 2026.
Key Findings
- Facility count fell 1.4% between 2023 and 2024 after slow growth of 0.2% a year from 2019 to 2023. Hemodialysis stations fell 1.0% in 2024. MedPAC links the decline to slower new ESRD incidence, prior excess mortality, growth in home dialysis, and capacity optimization by providers.
- Freestanding clinics make up 95% of facilities, urban sites 84%, and for-profit operators 90%. Nonprofit facilities fell 6.8% from 2023 to 2024, faster than the 0.8% decline among for-profit facilities.
- ESRD Networks counted 7,556 dialysis centers as of March 31, 2025, close to MedPAC's end-2024 total of 7,605. The CMS Dialysis Facility listing used later in this report shows 7,490 active facilities as of July 2026, a different vintage and filter.
How Many People Dialyze In Center Versus at Home
Patient setting shows whether capacity sits in clinics or in home programs. The ESRD Networks national census reports in-center, home, and nursing-home dialysis counts as of March 31, 2025.
| Setting | Patients | Share of dialysis patients |
|---|---|---|
| In-center hemodialysis | 433,396 | 83.9% |
| Home dialysis | 78,407 | 15.2% |
| Nursing home or skilled nursing facility | 5,034 | 1.0% |
| Total dialysis patients | 516,837 | 100% |
Source: National Forum of ESRD Networks, Quarterly National ESRD Census, as of March 31, 2025. Shares calculated by Healthcare Industry Reviews. The same census reported 223 transplant centers and 316,873 patients with a functioning kidney transplant.
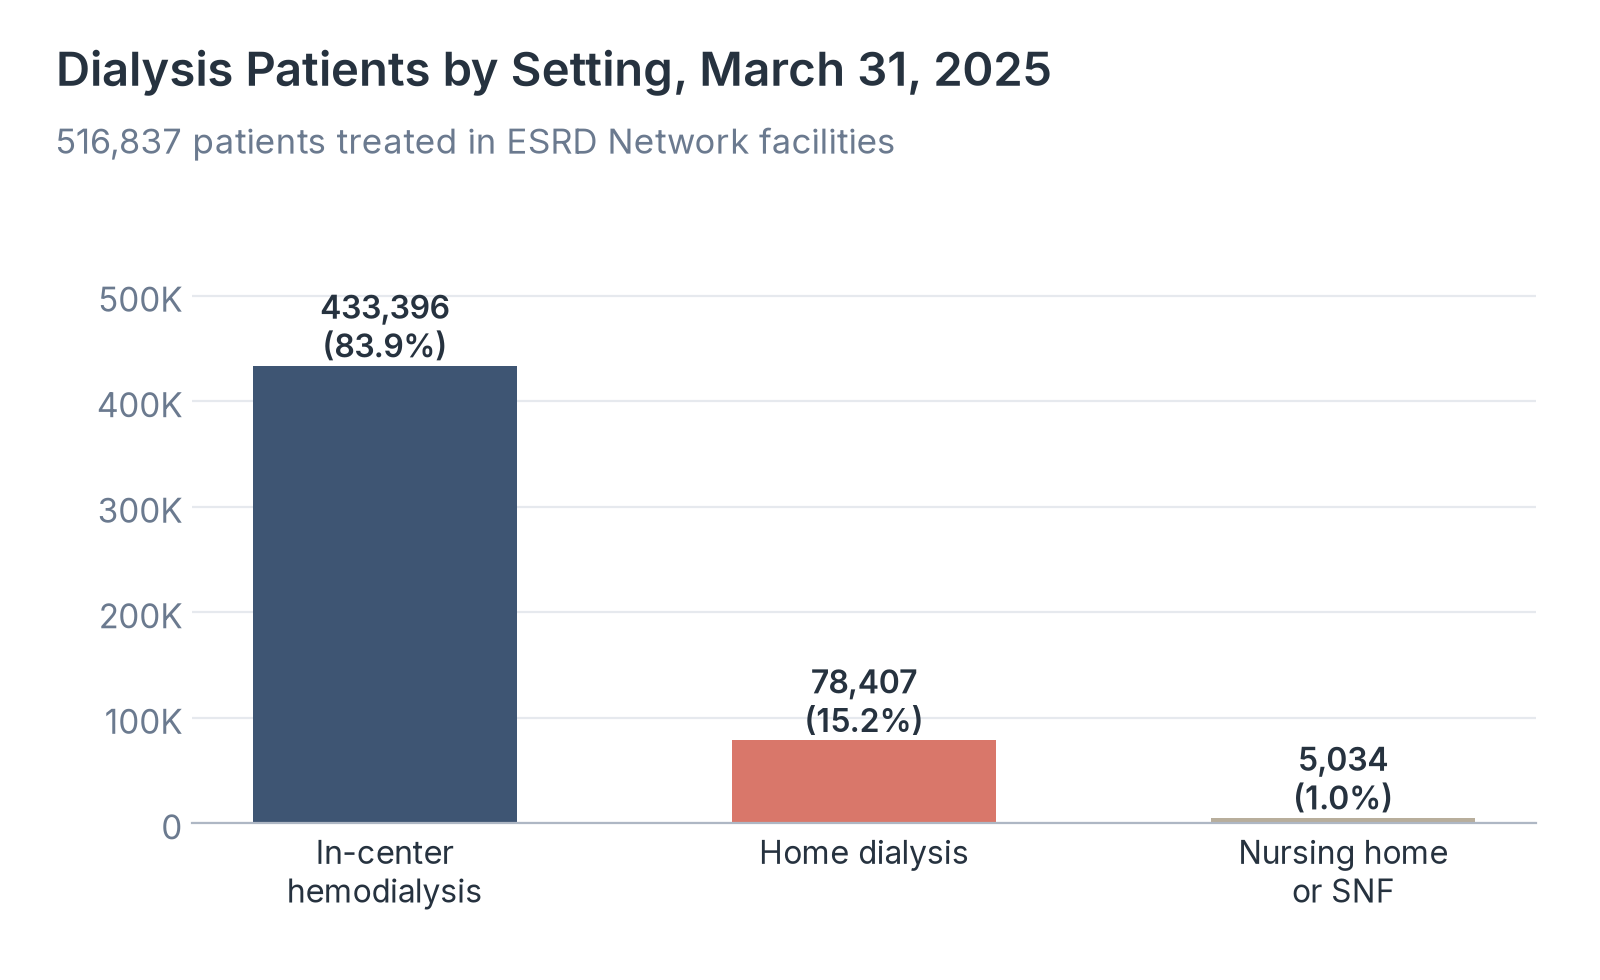
Source: Healthcare Industry Reviews analysis of the National Forum of ESRD Networks census as of March 31, 2025, conducted November 2026.
Key Findings
- About 5 in 6 dialysis patients (83.9%) still receive in-center hemodialysis. Home dialysis accounts for 15.2%, and nursing-home or skilled nursing facility dialysis for 1.0%.
- ESRD Networks also reported 316,873 people with a functioning kidney transplant as of the same date, so transplant recipients remain a large parallel population next to the dialysis census.
- Among Medicare Advantage and fee-for-service dialysis beneficiaries combined, MedPAC reports that large dialysis organizations (DaVita and Fresenius) treated 74% of Medicare Advantage dialysis beneficiaries and 73% of fee-for-service dialysis beneficiaries in January 2024.
How Dialysis Modality Has Changed Since 2013
A decade of US Renal Data System counts, as compiled by MedPAC, shows which modalities grew and which still dominate. Shares below are of all ESRD patients, including those with a functioning graft or transplant.
| Modality | Patients 2013 (thousands) | Share 2013 | Patients 2023 (thousands) | Share 2023 | Average annual change |
|---|---|---|---|---|---|
| In-center hemodialysis | 414.7 | 63% | 472.1 | 57% | 1% |
| Home hemodialysis | 7.0 | 1% | 13.7 | 2% | 7% |
| Peritoneal dialysis | 44.0 | 7% | 67.9 | 8% | 4% |
| Other dialysis | 1.6 | 0.2% | 4.2 | 0.5% | 10% |
| Functioning graft and kidney transplant | 194.6 | 29% | 273.0 | 33% | 3% |
Source: Medicare Payment Advisory Commission, July 2026 Data Book, Section 11 (Chart 11-3), compiled from the US Renal Data System. Includes Medicare and non-Medicare patients. Home hemodialysis and peritoneal dialysis are home dialysis methods.
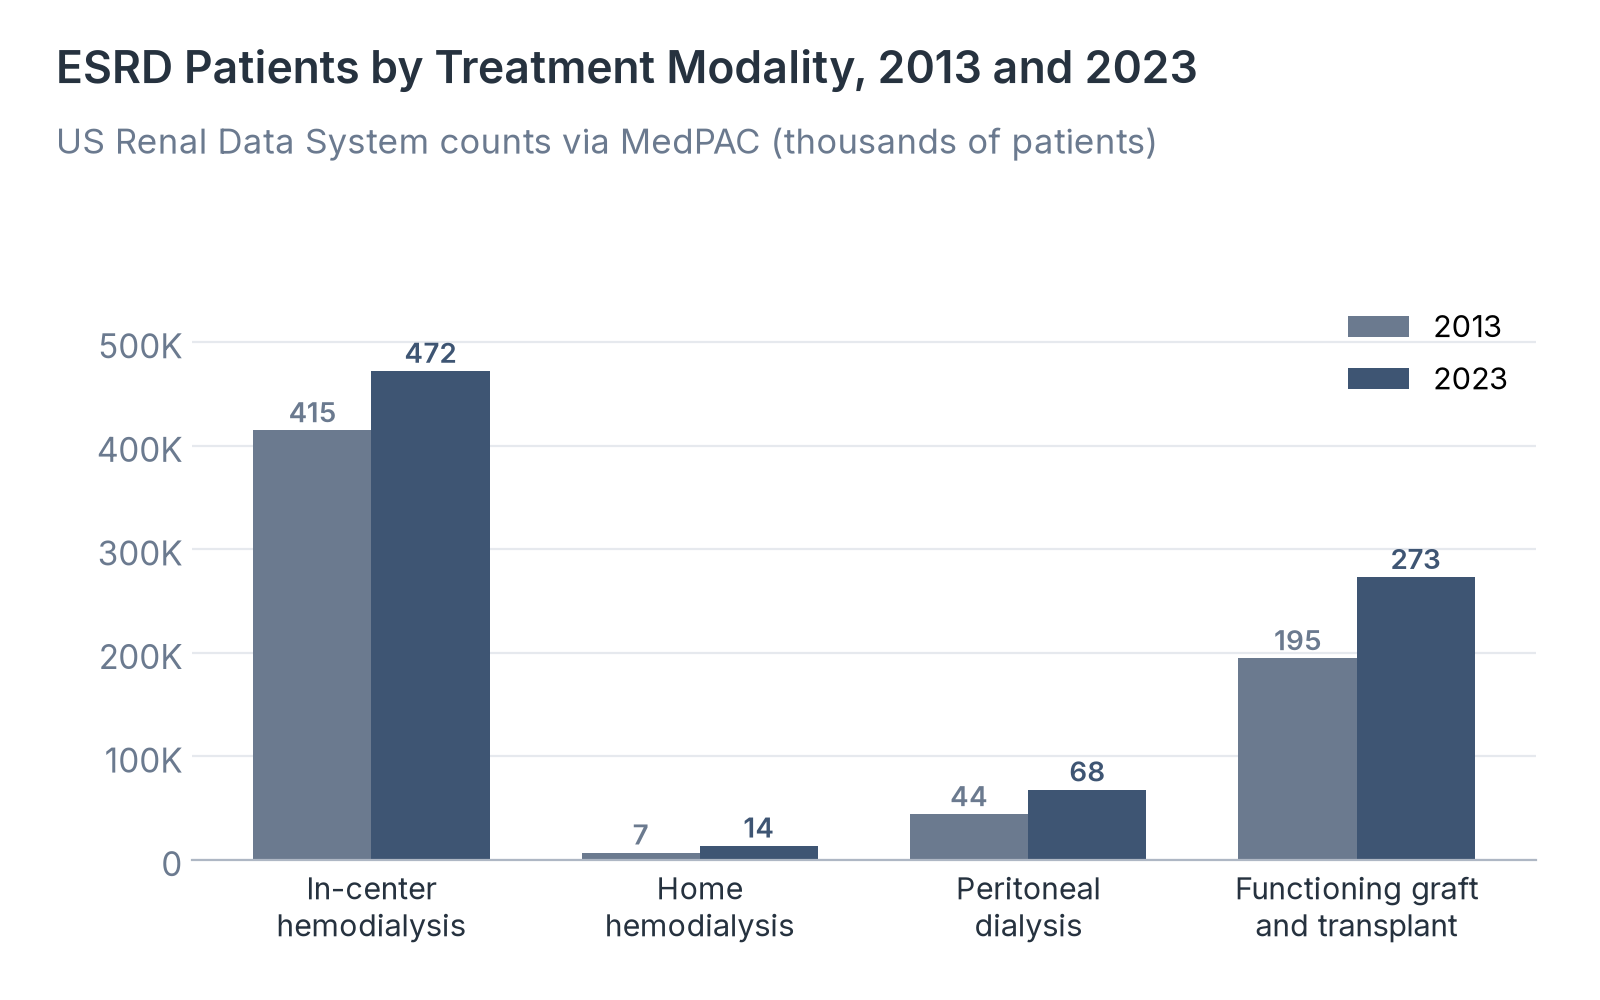
Source: Healthcare Industry Reviews analysis of MedPAC July 2026 Data Book Chart 11-3, November 2026.
Key Findings
- In-center hemodialysis remained the largest modality in 2023 at 472,100 patients (57% of all ESRD patients), but its share fell from 63% in 2013 as home options and transplant grew.
- Home hemodialysis nearly doubled, from 7,000 to 13,700 patients (7% average annual growth). Peritoneal dialysis grew from 44,000 to 67,900 (4% a year) and remains the most common home method.
- Patients with a functioning graft or transplant rose from 194,600 to 273,000 (3% a year) and made up 33% of ESRD patients in 2023. Total ESRD patients numbered 815,896 in 2023.
How Concentrated Is Dialysis Chain Ownership
Chain concentration tells buyers and reporters how much of the clinic market two large dialysis organizations control. The CMS Dialysis Facility listing for July 2026 records the chain on each active facility record.
| Chain or ownership group | Facilities | Stations | Share of facilities |
|---|---|---|---|
| DaVita | 2,799 | 48,930 | 37.4% |
| Fresenius Medical Care | 2,701 | 51,077 | 36.1% |
| US Renal Care, Inc. | 453 | 8,007 | 6.0% |
| Dialysis Clinic, Inc. | 243 | 4,551 | 3.2% |
| American Renal Associates | 218 | 4,170 | 2.9% |
| Independent | 742 | - | 9.9% |
| All other listed chains | 334 | - | 4.5% |
| Total active facilities | 7,490 | 132,735 | 100% |
Source: Centers for Medicare & Medicaid Services, Dialysis Facility listing (dataset 23ew-n7w9), July 2026 release, as compiled by American Factbook (retrieved October 15, 2026) and KidneyPass (snapshot July 29, 2026). Shares calculated by Healthcare Industry Reviews. DaVita plus Fresenius = 5,500 facilities (73.4%). For-profit share on the same listing: 89.5%.
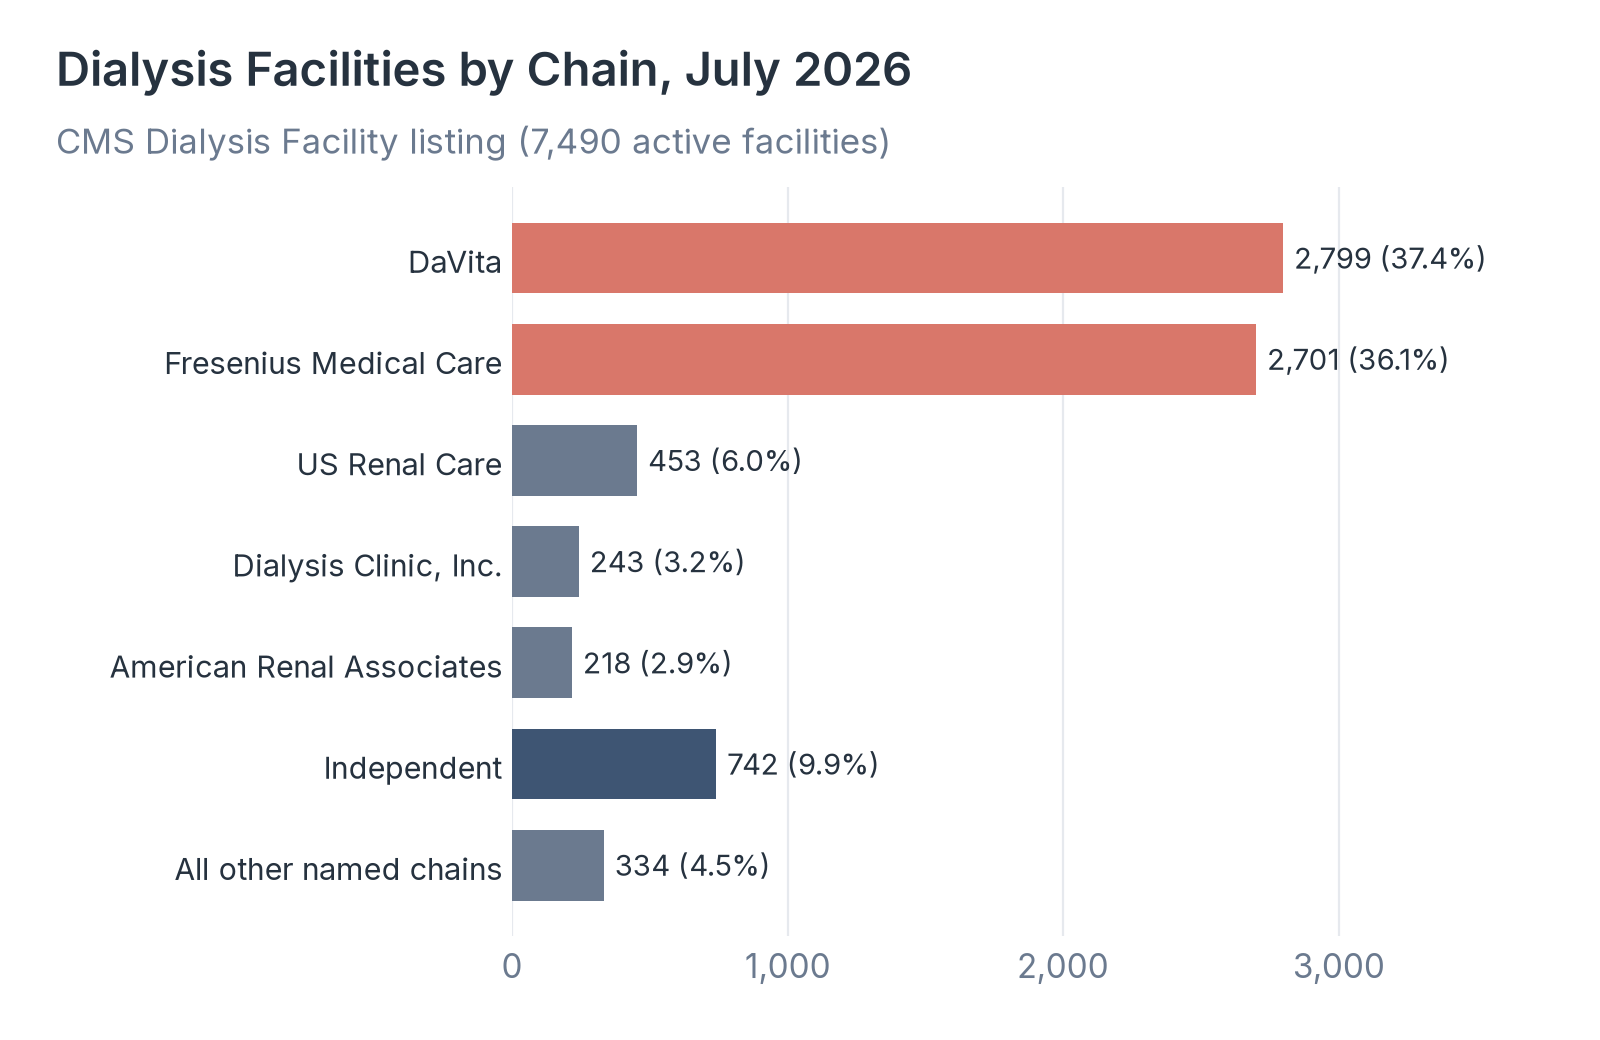
Source: Healthcare Industry Reviews analysis of CMS Dialysis Facility listing chain counts as published July 2026, conducted November 2026.
| Service flag | Facilities | Share of active facilities |
|---|---|---|
| Home hemodialysis or peritoneal dialysis training | 4,217 | 56.3% |
| Evening shift | 1,148 | 15.3% |
Source: Centers for Medicare & Medicaid Services Dialysis Facility listing, as compiled by KidneyPass, snapshot July 29, 2026.
Key Findings
- DaVita and Fresenius together run 73.4% of active facilities. The next three listed chains add another 12.1%, independents 9.9%, and smaller listed chains 4.5%.
- Fresenius lists more stations (51,077) than DaVita (48,930) despite fewer facilities, so average clinic size differs by chain.
- 56.3% of active facilities list home hemodialysis or peritoneal dialysis training, while only 15.3% list an evening shift, so home-program flags are far more common than late clinic hours.
Which States Have the Most Dialysis Facilities
State facility totals follow population and ESRD prevalence. The CMS July 2026 listing ranks every state and territory by active facility count.
| State | Facilities | Stations per 100,000 residents |
|---|---|---|
| Texas | 745 | 44.9 |
| California | 734 | 39.1 |
| Florida | 533 | 38.5 |
| Georgia | 355 | 52.7 |
| New York | 345 | 33.5 |
| Illinois | 338 | 39.2 |
| Ohio | 312 | 40.8 |
| Pennsylvania | 301 | 38.3 |
| North Carolina | 251 | 50.1 |
| Michigan | 219 | 35.6 |
| Virginia | 206 | 40.9 |
| New Jersey | 192 | 36.4 |
| Tennessee | 189 | 46.7 |
| Alabama | 173 | 55.4 |
| Louisiana | 168 | 62.8 |
Source: Centers for Medicare & Medicaid Services Dialysis Facility listing, July 2026, as compiled by American Factbook. Stations per 100,000 residents as published on that compilation.
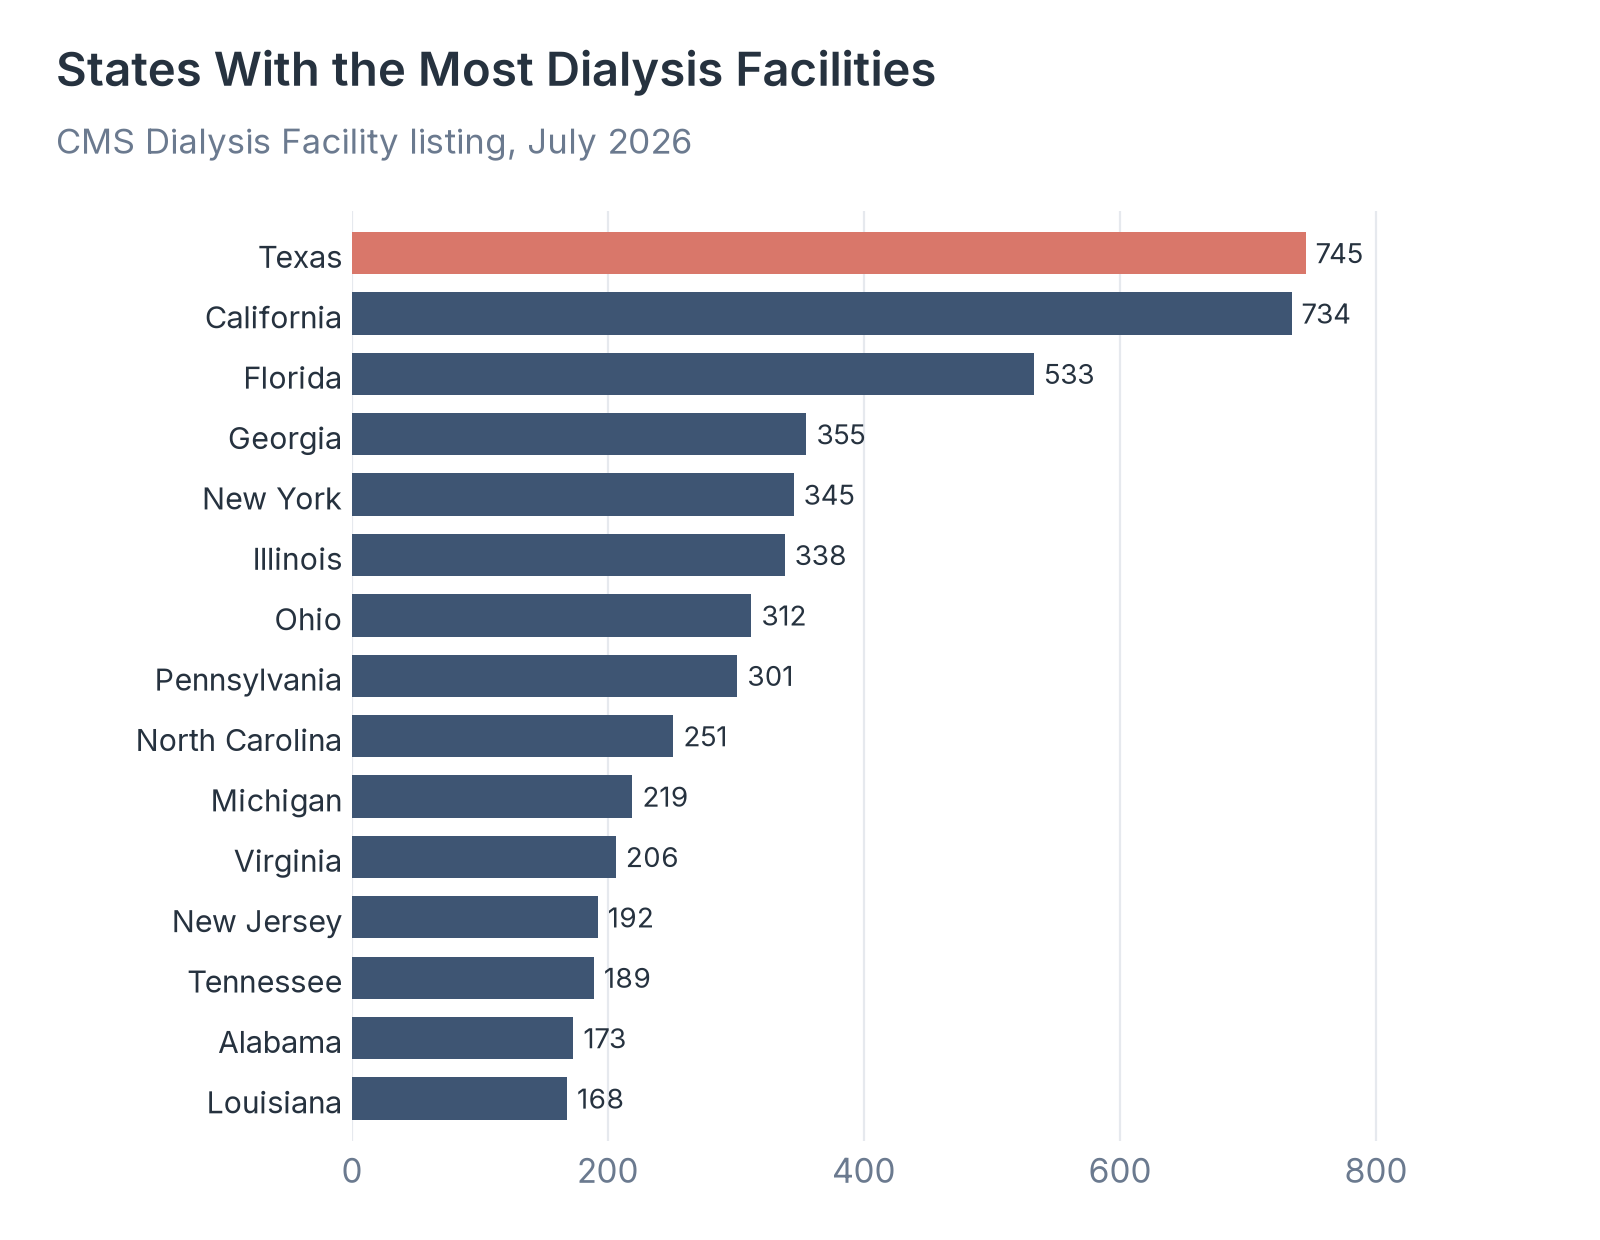
Source: Healthcare Industry Reviews analysis of CMS Dialysis Facility listing state counts as published July 2026, conducted November 2026.
Key Findings
- Texas and California together account for 1,479 facilities, about 20% of the national total of 7,490. Florida adds another 533.
- Stations per 100,000 residents are highest among these large states in Louisiana (62.8), Alabama (55.4), and Georgia (52.7), so Southern states often have denser station supply relative to population.
- Among smaller states on the full listing, Hawaii (71.0 stations per 100,000) and Mississippi (67.0) also show high station density, while Vermont (13.5) and Alaska (17.8) sit near the bottom.
What Dialysis Facility Statistics Show for 2026
The US dialysis market still centers on in-center hemodialysis inside freestanding, for-profit clinics, with two chains running about three quarters of active facilities. Facility and station counts edged down in 2024, while home dialysis and transplant continue to grow from a smaller base.
So if you are reporting on dialysis capacity or chain concentration, cite MedPAC for the 2024 facility and modality series, the ESRD Networks census for current patient setting counts, and the CMS Dialysis Facility listing for chain and state totals.
Data Collection and Methodology
Facility capacity, ownership mix, urban and rural shares, and modality trends come from MedPAC's July 2026 Data Book, Section 11 (Charts 11-1, 11-3, and 11-5), which we opened as a PDF on November 6, 2026. Chart 11-1 uses end-of-year CMS outpatient claims and Dialysis Compare files. Chart 11-3 uses the US Renal Data System and covers Medicare and non-Medicare patients. Large dialysis organization shares of Medicare dialysis beneficiaries are from Chart 11-5 (January 2024).
Patient setting counts are from the National Forum of ESRD Networks Quarterly National ESRD Census as of March 31, 2025, opened on November 6, 2026. Shares of in-center, home, and nursing-home dialysis are our calculations from those published counts.
Chain, station, state, home-training, evening-shift, and for-profit figures are from the CMS Dialysis Facility listing (dataset 23ew-n7w9). Direct API download returned HTTP 403 from this environment on November 6, 2026, so we used two independent public compilations of that same CMS file: American Factbook (CMS figures as released July 15, 2026; page retrieved October 15, 2026) and KidneyPass (snapshot July 29, 2026). Both report 7,490 active facilities and 132,735 stations. "All other listed chains" is the residual after subtracting the five listed chains and independents from 7,490. Facility totals differ slightly across MedPAC (7,605 at end of 2024), ESRD Networks (7,556 on March 31, 2025), and the CMS listing (7,490 in July 2026) because of date and inclusion rules.
We calculated products, differences, and ratios from the published values.
Sources
- Healthcare Industry Reviews, Dialysis Facility Study: analysis of MedPAC July 2026 Data Book Section 11 facility and modality tables, the National Forum of ESRD Networks census as of March 31, 2025, and CMS Dialysis Facility listing chain and state counts as published July 2026, conducted November 2026.
- Medicare Payment Advisory Commission. July 2026 Data Book, Section 11: Other services (Dialysis).
- National Forum of ESRD Networks. Quarterly National ESRD Census. As of March 31, 2025.
- American Factbook. Dialysis Facilities. CMS Dialysis Facility listing compilation, figures as released July 15, 2026 (retrieved October 15, 2026).
- KidneyPass. State of US Dialysis. CMS dataset 23ew-n7w9 snapshot, July 29, 2026.