Drug Price Increase Statistics: 2026 Report
Published
Our analysts reviewed 14 years of brand-name drug list price changes, from 2012 to 2025, federal counts of 23,515 drug price increases from 2017 to 2023, and the first price changes of 2026 to show how often drugmakers raise list prices, by how much, how those increases compare with inflation, and how US prices compare with other countries, as of Q4 2026.
Key Findings
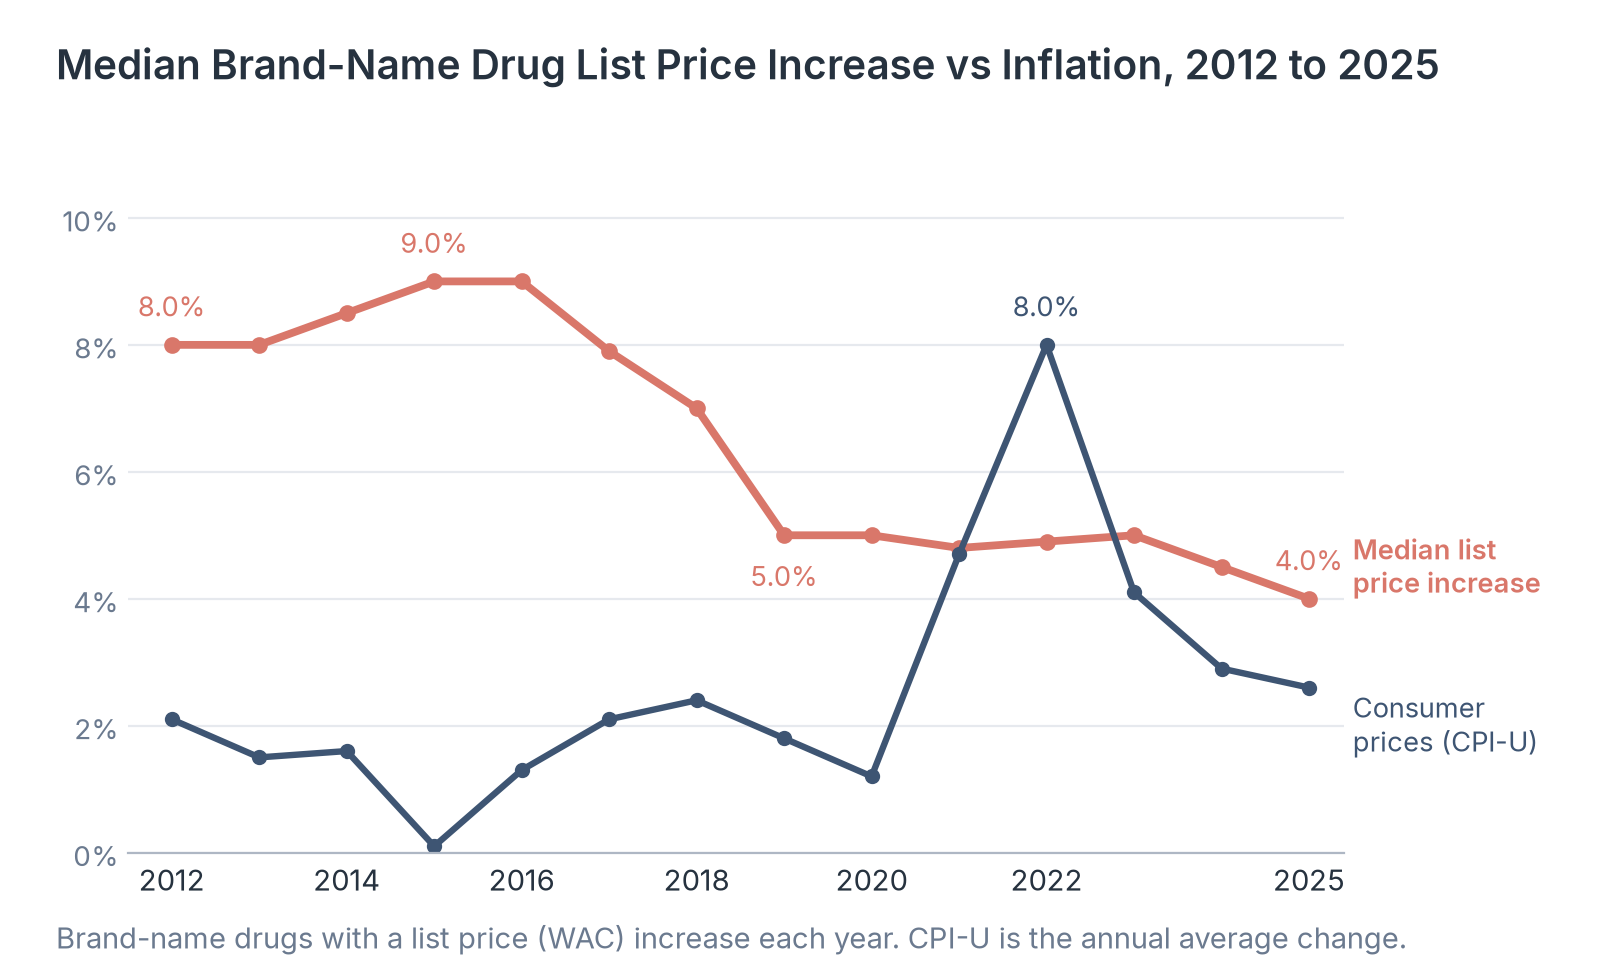
- The median list price increase on brand-name drugs was 4.0% in 2025, down from 4.5% in 2024 and from a peak of 9.0% in 2015 and 2016.
- By mid-January 2026, 872 brand-name drug products had taken list price increases for the year and 18 had taken decreases, with a median increase of about 4%.
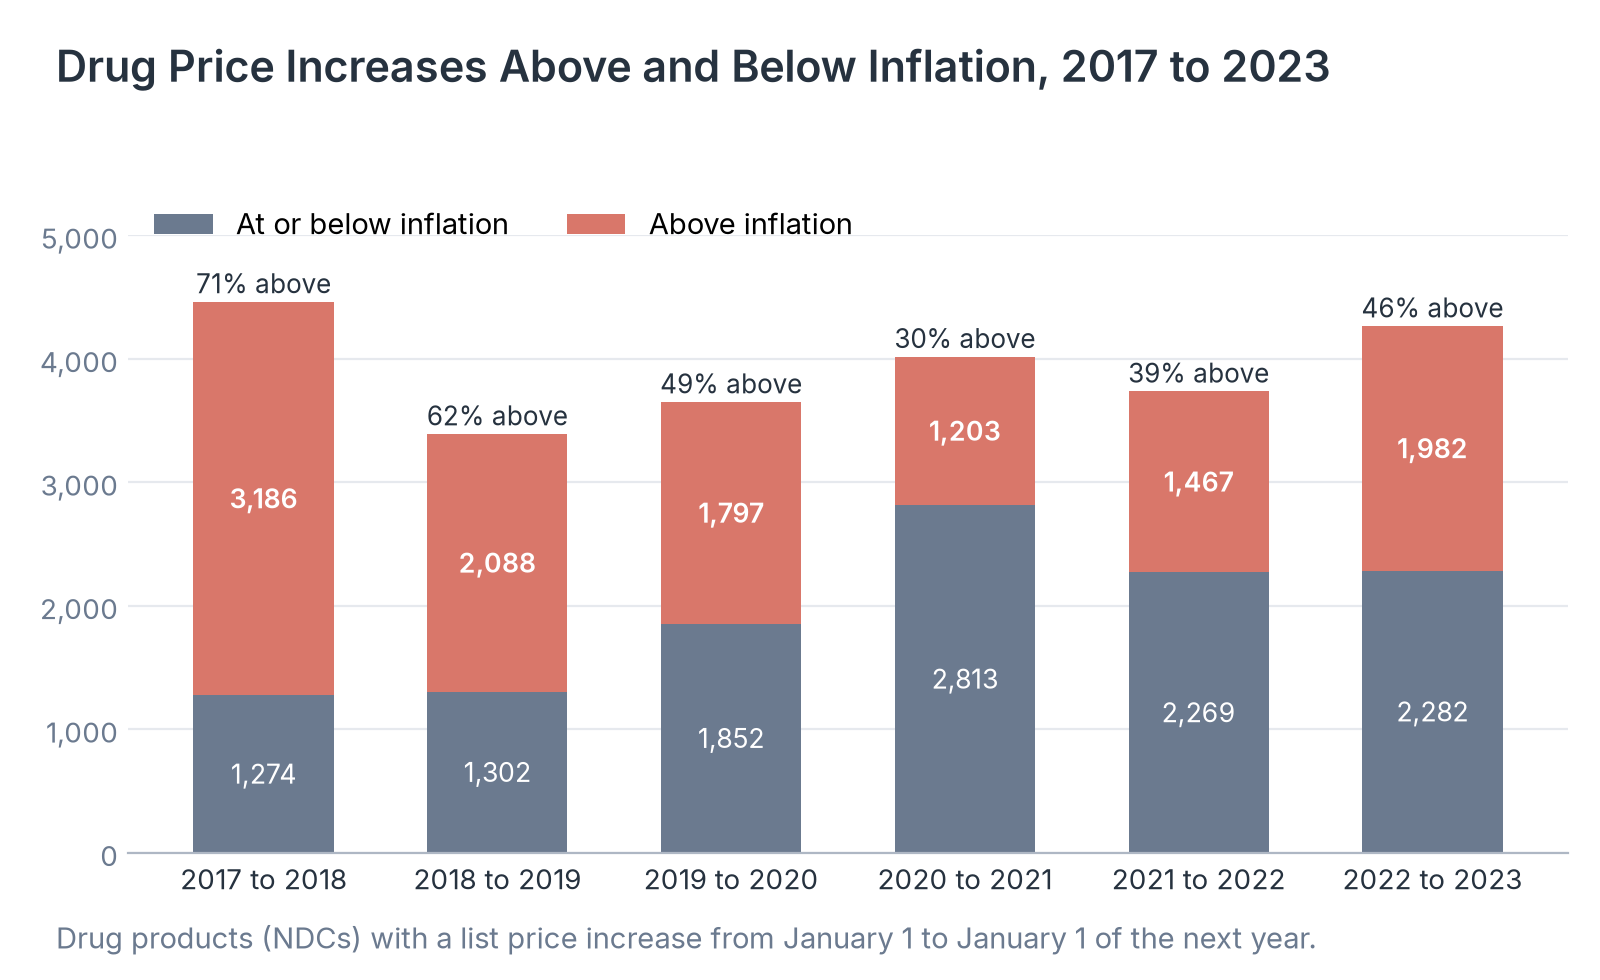
- From January 2022 to January 2023, 4,264 drug products had list price increases, and 1,982 of them (46%) rose faster than the 6.4% inflation rate. The average increase was 15.2%, or $590 per product.
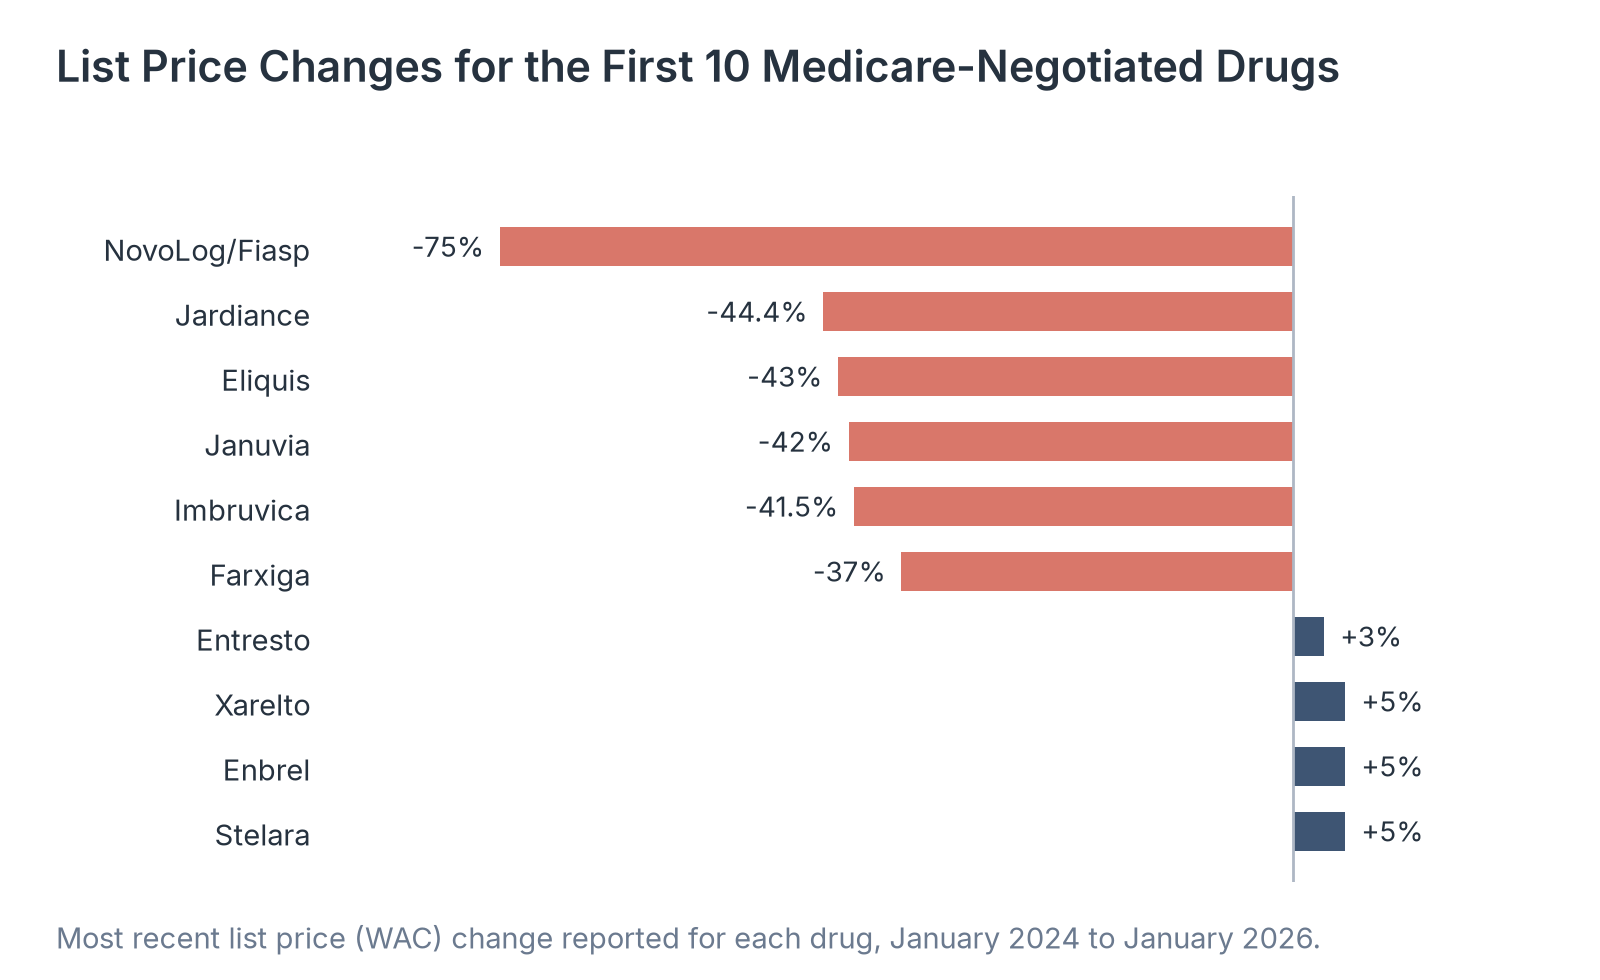
- Six of the first 10 drugs selected for Medicare price negotiation had list price cuts of 37% to 75% between January 2024 and January 2026. The other four had increases of 3% to 5%.
- US manufacturer prices for prescription drugs were 278% of prices in 33 other wealthy countries in 2022, and 422% for brand-name drugs.
Every January, drugmakers set new list prices for hundreds of brand-name drugs, and a second, smaller round follows in July.4 The list price, known as the wholesale acquisition cost (WAC), is what a manufacturer charges wholesalers before any rebates or discounts.
Insurers and pharmacy benefit managers usually pay less after rebates. People without insurance may pay the pharmacy's usual price, which tends to be higher than what insurers pay.4 Brand-name drugs account for more than 80% of prescription drug spending, even though generics fill about 90% of prescriptions, so brand list prices draw most of the attention.2
Under the Inflation Reduction Act of 2022, drugmakers must pay rebates to Medicare when prices for certain Part B and Part D drugs rise faster than inflation.4 But the number and size of price increases have changed a great deal over the past decade.
Our analysts compiled 14 years of brand-name list price changes, from 2012 to 2025, tracked by 46brooklyn Research.2,3 We compared the yearly median increase with consumer inflation from the Bureau of Labor Statistics.8
We also used Department of Health and Human Services counts of 23,515 list price increases on brand and generic products from January 2017 to January 2023.4 We added price cuts on drugs in Medicare price negotiation and a RAND comparison of US and international prices.5,6
In the following sections, we compare the median brand-name price increase with inflation since 2012, the number of price changes each January, how many increases exceeded inflation, price changes on the first drugs in Medicare price negotiation, the increases that touched the most Medicaid spending in 2025, and US prices against prices in other countries.
How the Median Brand-Name Price Increase Has Changed Since 2012
The median increase is the most common way to describe how much drugmakers raise list prices in a year, because a few extreme changes on little-used drugs do not move it. We set the yearly median increase on brand-name drugs next to the yearly change in consumer prices for 2012 to 2025.
| Year | Median list price increase | Consumer price inflation (CPI-U) | Difference, percentage points |
|---|---|---|---|
| 2025 | 4.0% | 2.6% | +1.4 |
| 2024 | 4.5% | 2.9% | +1.6 |
| 2023 | 5.0% | 4.1% | +0.9 |
| 2022 | 4.9% | 8.0% | -3.1 |
| 2021 | 4.8% | 4.7% | +0.1 |
| 2020 | 5.0% | 1.2% | +3.8 |
| 2019 | 5.0% | 1.8% | +3.2 |
| 2018 | 7.0% | 2.4% | +4.6 |
| 2017 | 7.9% | 2.1% | +5.8 |
| 2016 | 9.0% | 1.3% | +7.7 |
| 2015 | 9.0% | 0.1% | +8.9 |
| 2014 | 8.5% | 1.6% | +6.9 |
| 2013 | 8.0% | 1.5% | +6.5 |
| 2012 | 8.0% | 2.1% | +5.9 |
Source: 46brooklyn Research, Brand Drug List Price Change Box Score, median WAC increase on brand-name drugs, as published in the 2025 year in review; Bureau of Labor Statistics, Consumer Price Index for All Urban Consumers, annual average change.
Source: Healthcare Industry Reviews analysis of 46brooklyn Research brand drug list price data and Bureau of Labor Statistics consumer price data, conducted November 2026.
Key Findings
- The median increase stayed at 7% or more from 2012 to 2018, then fell to 5.0% in 2019 and has stayed at or below 5% since. The 2025 median of 4.0% was the lowest in the series.
- In 2022, consumer prices rose faster than the median brand-name list price, 8.0% compared with 4.9%, the only year from 2012 to 2025 when that happened. In 2025, the median increase was 1.4 percentage points above inflation.
- A list price raised by the median amount every year from 2012 to 2025 would be 2.4 times its 2011 level, while consumer prices rose 43% over the same period. Smaller yearly increases since 2019 have narrowed the annual gap, but the earlier increases remain built into today's prices.
How Many Brand-Name Drugs Change Price in January
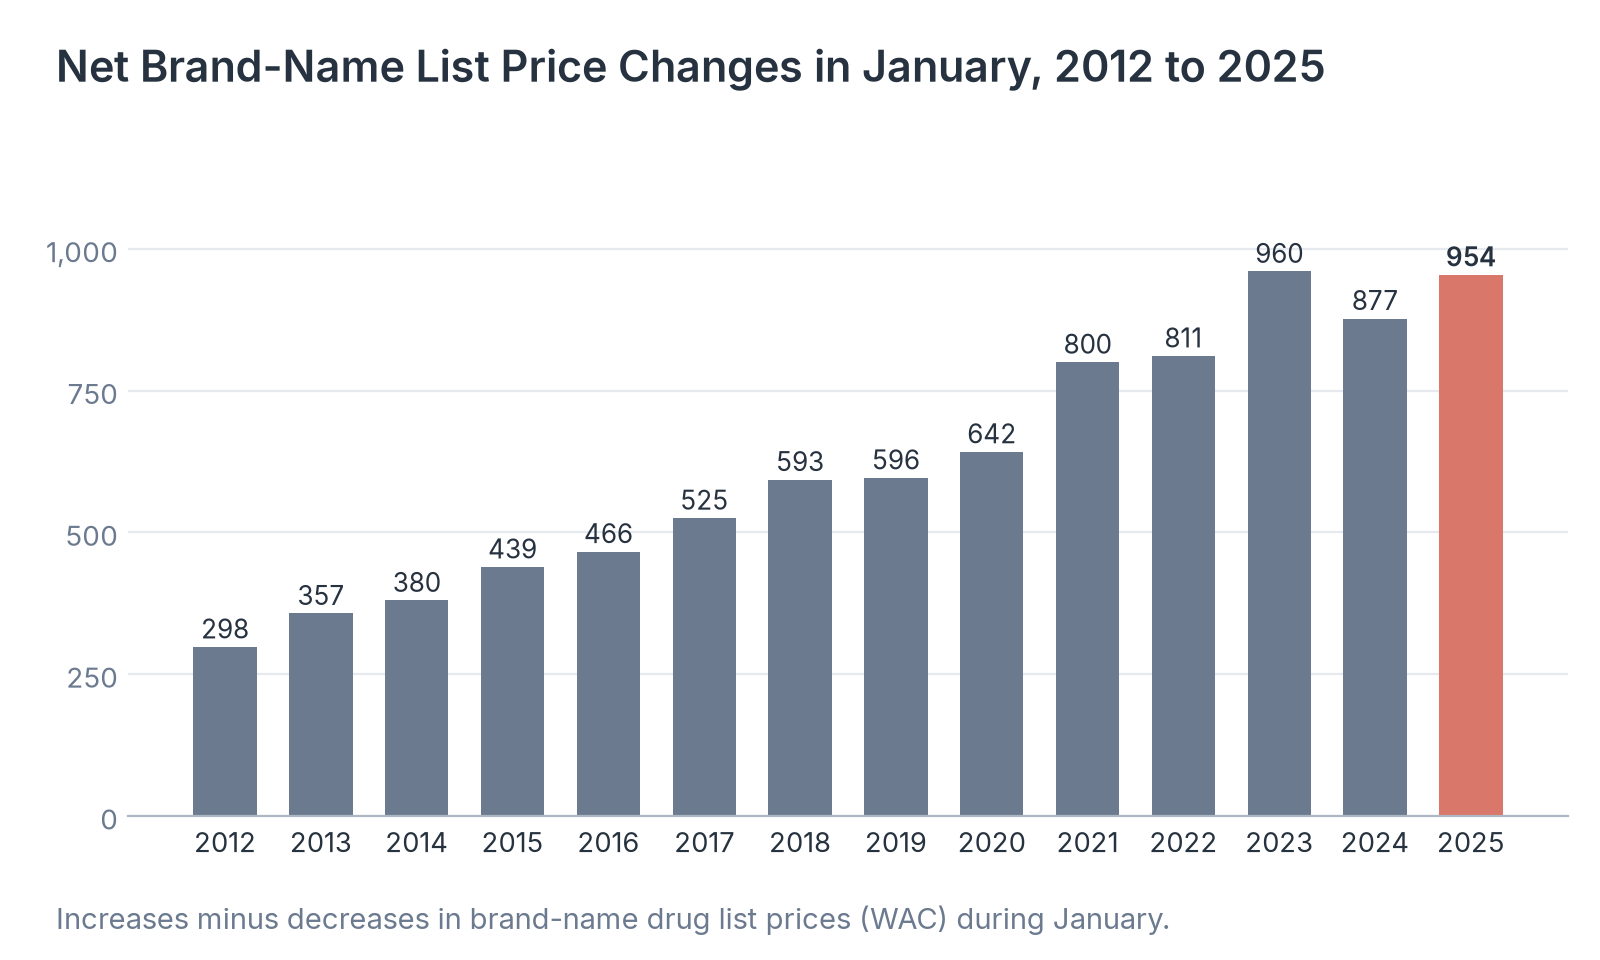
Reporters count January price changes each year because drugmakers make most of their list price changes at the start of the year. We tracked the net number of brand-name list price changes in January, increases minus decreases, for 2012 to 2025, and the first counts for January 2026.
| Year | Net January price changes (increases minus decreases) |
|---|---|
| 2025 | 954 |
| 2024 | 877 |
| 2023 | 960 |
| 2022 | 811 |
| 2021 | 800 |
| 2020 | 642 |
| 2019 | 596 |
| 2018 | 593 |
| 2017 | 525 |
| 2016 | 466 |
| 2015 | 439 |
| 2014 | 380 |
| 2013 | 357 |
| 2012 | 298 |
Source: 46brooklyn Research, 2025 year in review and 2026 early look, January 2026, Figure 1, based on the Elsevier Gold Standard Drug Database.
Source: Healthcare Industry Reviews analysis of 46brooklyn Research brand drug list price data and Bureau of Labor Statistics consumer price data, conducted November 2026.
Key Findings
- January price changes more than tripled from 298 in 2012 to 954 in 2025. 46brooklyn ranked 2025 second only to 2023, when the count reached 960.
- For all of 2024, 46brooklyn counted a net 1,360 brand-name list price increases. The 877 net January changes that year came to about 64% of the annual total.
- By mid-January 2026, 46brooklyn counted 872 brand-name list price increases and 18 decreases. Before the year began, drugmakers had announced increases on at least 350 drugs, up from more than 250 at the same point a year earlier, and Pfizer led with increases on about 80 drugs.7
How Many Drug Price Increases Exceeded Inflation
Inflation is the usual yardstick for whether a price increase is large, and it is also the test Medicare now uses for inflation rebates. We used a federal analysis of every list price change on brand and generic drug products to compare the number of increases above and below inflation for each year from 2017 to 2023.
| Period (January to January) | Price increases | Increases above inflation (share) | Price decreases | CPI-U change |
|---|---|---|---|---|
| 2017 to 2018 | 4,460 | 3,186 (71%) | 1,629 | 2.1% |
| 2018 to 2019 | 3,390 | 2,088 (62%) | 1,248 | 1.6% |
| 2019 to 2020 | 3,649 | 1,797 (49%) | 1,254 | 2.5% |
| 2020 to 2021 | 4,016 | 1,203 (30%) | 1,698 | 1.4% |
| 2021 to 2022 | 3,736 | 1,467 (39%) | 1,893 | 7.5% |
| 2022 to 2023 | 4,264 | 1,982 (46%) | 1,599 | 6.4% |
Source: HHS Office of the Assistant Secretary for Planning and Evaluation, Changes in the List Prices of Prescription Drugs, 2017-2023, Figure 1, October 6, 2023. Counts are drug products at the 11-digit National Drug Code level, brand and generic.
Source: Healthcare Industry Reviews analysis of HHS Office of the Assistant Secretary for Planning and Evaluation drug price data, conducted November 2026.
Key Findings
- In 2017 to 2018, 71% of the 4,460 drug price increases exceeded inflation, which was 2.1%. When inflation rose to 7.5% in 2021 to 2022 and 6.4% in 2022 to 2023, fewer increases cleared it, 39% and 46%.
- The average increase from January 2022 to January 2023 was 15.2%, or $590 per product, compared with 11.5% and $172 the year before. HHS found that the 2023 increases were concentrated in more expensive drugs.
- Drugs sold by several manufacturers had larger percentage increases than single-source drugs in 2023, 26.0% compared with 7.4%, but much smaller dollar increases, $69 compared with $958. Because single-source drugs generally cost much more, their average dollar increase was higher than for multi-source drugs in every year HHS studied.
How List Prices Changed for the First Drugs in Medicare Price Negotiation
Medicare's first negotiated prices for 10 drugs took effect in January 2026, and several makers cut their list prices around the same time. We compared the most recent list price change for each of the 10 drugs, as tracked by 46brooklyn.
| Drug | List price change | Effective |
|---|---|---|
| NovoLog and Fiasp | -75% | January 2024 (NovoLog) and January 2026 (Fiasp) |
| Jardiance | -44% | January 2026 |
| Eliquis | -43% | January 2026 |
| Januvia | -42% | January 2025 |
| Imbruvica | -41.5% | December 2025 |
| Farxiga | -37% | January 2026 |
| Entresto | +3% | January 2026 |
| Xarelto | +5% | January 2025 |
| Enbrel | +5% | January 2026 |
| Stelara | +5% | January 2026 |
Source: 46brooklyn Research, 2025 year in review and 2026 early look, January 2026. Most recent WAC change reported for each drug.
Source: Healthcare Industry Reviews analysis of 46brooklyn Research brand drug list price data and Bureau of Labor Statistics consumer price data, conducted November 2026.
Key Findings
- Six of the 10 drugs, NovoLog and Fiasp, Jardiance, Eliquis, Januvia, Imbruvica, and Farxiga, had list price cuts of 37% to 75%. Entresto rose 3%, and Xarelto, Enbrel, and Stelara each rose 5%.
- In January 2026, 46brooklyn recorded list price cuts on 11 brand-name products, including Cimerli (85.3%), Fiasp (75.0%), Tresiba (72.2%), Linzess (50.3%), and Jardiance and four related diabetes drugs (44.4% each).
- Weighted by what Medicaid spent on each drug the year before, the January 2026 changes lowered prices overall in 46brooklyn's early count. The cuts applied to drugs with more than $5 billion in yearly Medicaid spending, while increases of just over 4% applied to about $45 billion.
Which 2025 Price Increases Touched the Most Spending
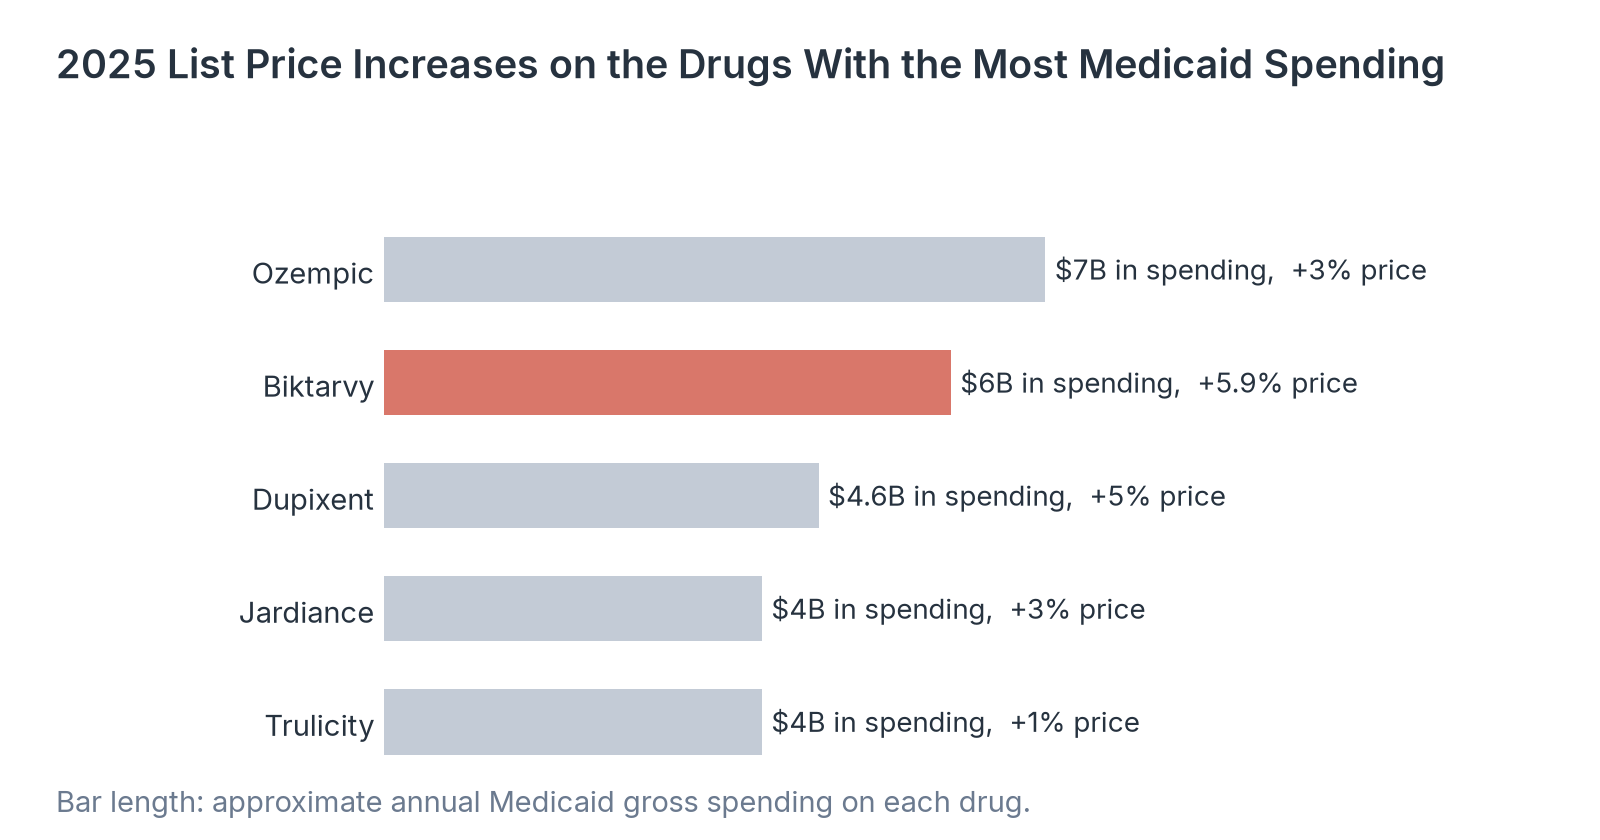
The count of price increases treats a little-used drug the same as a drug that millions of people take. We looked at the 2025 increases on the drugs with the largest Medicaid spending, which 46brooklyn uses as a measure of how widely a price change is felt.
| Drug | Manufacturer | 2025 list price increase | Annual Medicaid gross spending, approximate |
|---|---|---|---|
| Ozempic | Novo Nordisk | +3% | $7 billion |
| Biktarvy | Gilead | +5.9% | $6 billion |
| Dupixent | Sanofi | +5% | $4.6 billion |
| Jardiance | Boehringer Ingelheim | +3% | $4 billion |
| Trulicity | Eli Lilly | +1% | $4 billion |
Source: 46brooklyn Research, 2025 year in review and 2026 early look, January 2026, ranking of 2025 price changes by prior-year Medicaid gross expenditures.
Source: Healthcare Industry Reviews analysis of 46brooklyn Research brand drug list price data and Bureau of Labor Statistics consumer price data, conducted November 2026.
Key Findings
- Novo Nordisk raised the list price of Ozempic 3% in 2025, the increase that touched the most Medicaid spending, about $7 billion a year. Gilead's 5.9% increase on Biktarvy was the largest of the five.
- Medicaid spends about $100 billion a year on prescription drugs, so these five drugs account for about 1 in 5 Medicaid drug dollars before rebates.
- Weighted by Medicaid spending, brand-name list prices rose about 4% in 2025, close to the median. In 2024, the weighted change was 1.4%, the lowest 46brooklyn had recorded, in a year when brand-name insulin list prices fell about 75%.2,3
How US Drug Prices Compare With Other Countries
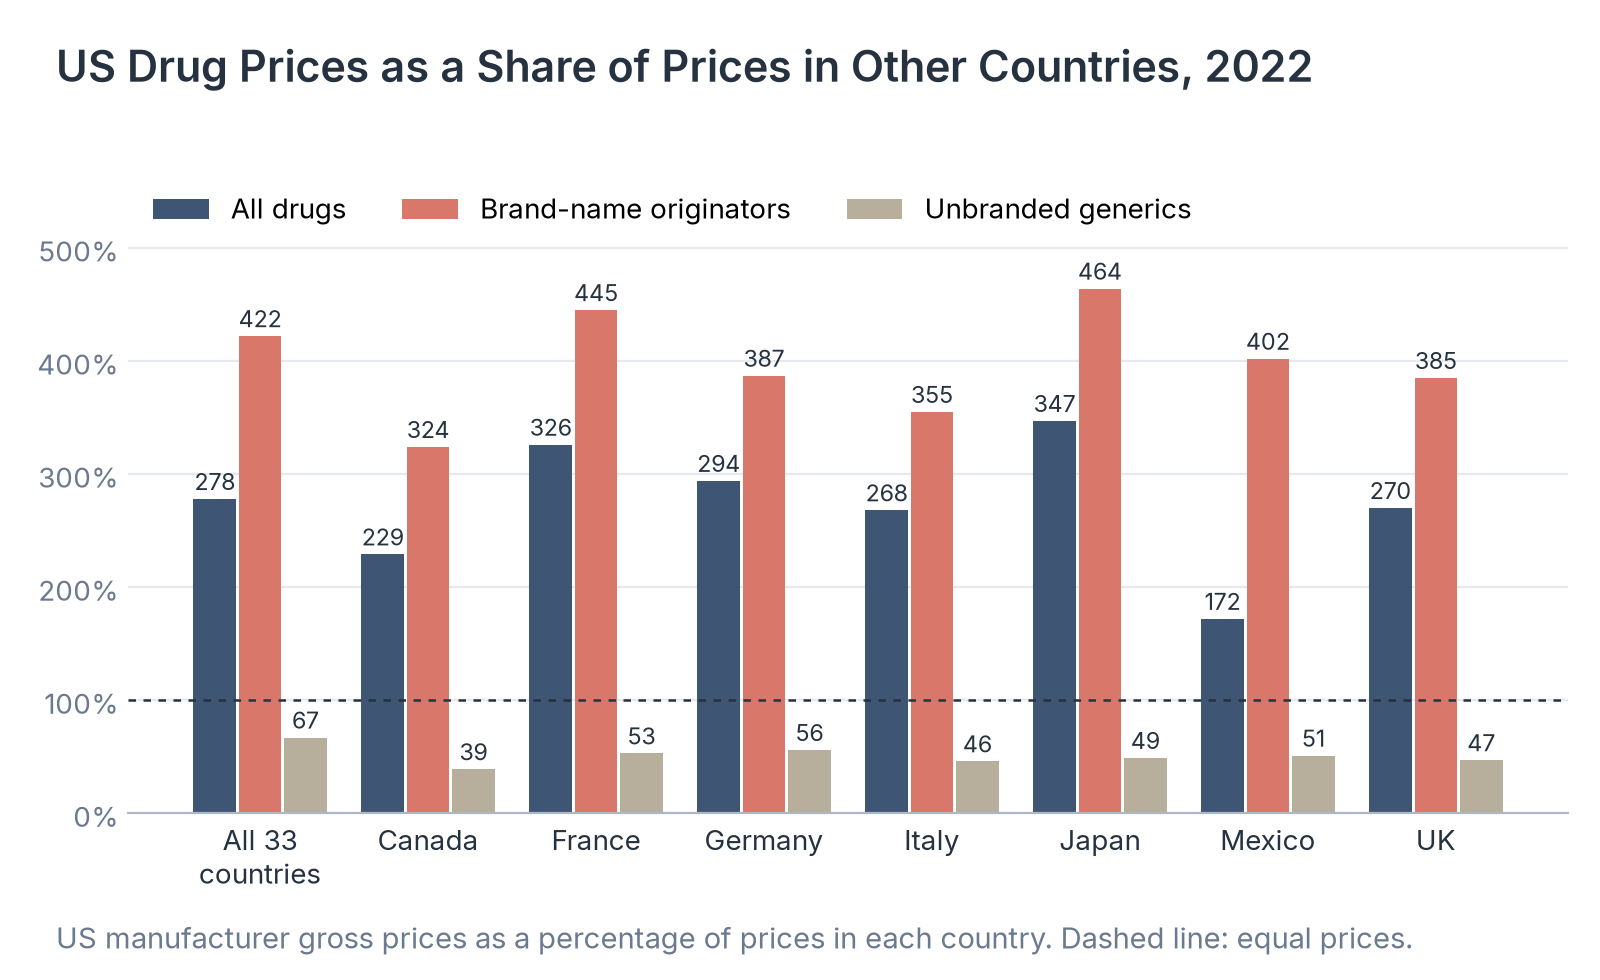
Yearly increases add up to prices that are far above those in other wealthy countries, a comparison that is central to current federal drug pricing policy. We compared US manufacturer prices with prices in other countries in 2022, using a RAND study for the Department of Health and Human Services.
| Comparison | All drugs | Brand-name originator drugs | Unbranded generics |
|---|---|---|---|
| All 33 OECD countries | 278% | 422% | 67% |
| Canada | 229% | 324% | 39% |
| France | 326% | 445% | 53% |
| Germany | 294% | 387% | 56% |
| Italy | 268% | 355% | 46% |
| Japan | 347% | 464% | 49% |
| Mexico | 172% | 402% | 51% |
| United Kingdom | 270% | 385% | 47% |
Source: RAND, International Prescription Drug Price Comparisons: Estimates Using 2022 Data, Figure S.1, 2024. Manufacturer gross prices before rebates. A value of 278% means US prices were 2.78 times prices in the comparison country.
Source: Healthcare Industry Reviews analysis of RAND international drug price data, conducted November 2026.
Key Findings
- US prices for all drugs ranged from 172% of prices in Mexico to 1,028% of prices in Turkey in 2022. Among the G7 countries, the gap was largest with Japan, at 347%, and smallest with Canada, at 229%.
- US prices for unbranded generics were 67% of the prices in other countries. Generics make up about 90% of US prescriptions, and the overall price gap is driven by brand-name drugs.
- The United States accounted for 62% of drug sales across the 34 countries RAND studied but only 24% of the volume. Even after RAND adjusted US prices down for rebates and discounts, brand-name prices stayed more than three times as high as in other countries.6
What Drug Price Increase Trends Mean
Drugmakers still raise list prices on hundreds of brand-name drugs every January, but the typical increase has been cut roughly in half since the middle of the last decade. For people who pay a deductible or coinsurance based on list price, a 4% increase on an expensive brand-name drug is still a real cost, and it comes on top of prices set by years of larger increases.
The largest price changes of 2026 so far have been cuts. Six of the first 10 drugs in Medicare price negotiation now carry list prices 37% to 75% lower than before, and Linzess, which is on Medicare's negotiation list for 2027, took a 50.3% list price cut in January 2026.
So if you are citing how much drug prices rose, give the median brand-name increase for the year, compare it with inflation for the same year, and note that list prices do not include rebates.
Data Collection and Methodology
Brand-name price figures come from 46brooklyn Research's Brand Drug List Price Change Box Score, which tracks changes in wholesale acquisition cost (WAC) for brand-name drugs using the Elsevier Gold Standard Drug Database. They also come from the values 46brooklyn published in its 2024 and 2025 year-in-review reports and its January 2026 early look. 46brooklyn Research is a nonprofit that publishes price changes from a commercial drug database.
The median increase covers brand-name drugs with a WAC increase in each calendar year. January counts are net changes, increases minus decreases. Medicaid-weighted figures use 46brooklyn's prior-year Medicaid gross expenditure weighting, based on CMS State Drug Utilization Data.
Counts of increases above and below inflation come from the HHS Office of the Assistant Secretary for Planning and Evaluation (ASPE). ASPE analyzed AnalySource WAC data for every drug product at the 11-digit National Drug Code level, brand and generic, and measured the cumulative change from January 1 of one year to January 1 of the next against the 12-month change in the CPI-U.
We read the counts from the data labels on the first figure in ASPE's brief. International comparisons come from RAND's analysis of 2022 IQVIA MIDAS sales and volume data for the United States and 33 OECD countries, using manufacturer gross prices.
The negotiated drug list comes from 46brooklyn's January 2026 review. Medicare's first 10 negotiated drugs include NovoLog and Fiasp as one insulin product.
Consumer price inflation is the annual average change in the Consumer Price Index for All Urban Consumers from the Bureau of Labor Statistics. The compounded comparison applies each year's median increase from 2012 to 2025 to a 2011 starting price and compares it with the change in the CPI-U annual average from 2011 to 2025.
List prices do not reflect rebates or discounts. We calculated differences, ratios, shares, and multi-year changes from the published values.
Sources
- Healthcare Industry Reviews analysis of 46brooklyn Research brand-name list price data for 2012 to 2026, HHS drug price change data for 2017 to 2023, RAND international price comparisons for 2022, and Bureau of Labor Statistics consumer price data, conducted November 2026.
- 46brooklyn Research, 2026 Drug Pricing Reload: Out With the Old, In With the New (2025 year in review and 2026 early look). January 2026. Brand Drug List Price Change Box Score.
- 46brooklyn Research, Drug Pricing 2024 Year in Review. January 2025.
- HHS Office of the Assistant Secretary for Planning and Evaluation, Changes in the List Prices of Prescription Drugs, 2017-2023. Issue brief HP-2023-25, October 6, 2023.
- RAND, International Prescription Drug Price Comparisons: Estimates Using 2022 Data. Andrew W. Mulcahy, Daniel Schwam, and Susan L. Lovejoy, 2024.
- RAND, Prescription Drug Prices in the U.S. Are 2.78 Times Those in Other Countries. February 1, 2024.
- Reuters via CNN, Drugmakers Raise US Prices on 350 Medicines Despite Pressure From Trump. January 1, 2026. Data from 3 Axis Advisors.
- U.S. Bureau of Labor Statistics, Consumer Price Index for All Urban Consumers, All Items, annual averages, via the Federal Reserve Bank of St. Louis.