Employer Health Insurance Premium Statistics: 2026 Report
Published
Our analysts reviewed 28 years of KFF Employer Health Benefits Survey results, from 1999 to 2026, and federal premium tables for private-sector employers in all 50 states and the District of Columbia to show what employer health insurance costs, who pays for it, and how fast it is rising, as of Q4 2026.
Key Findings
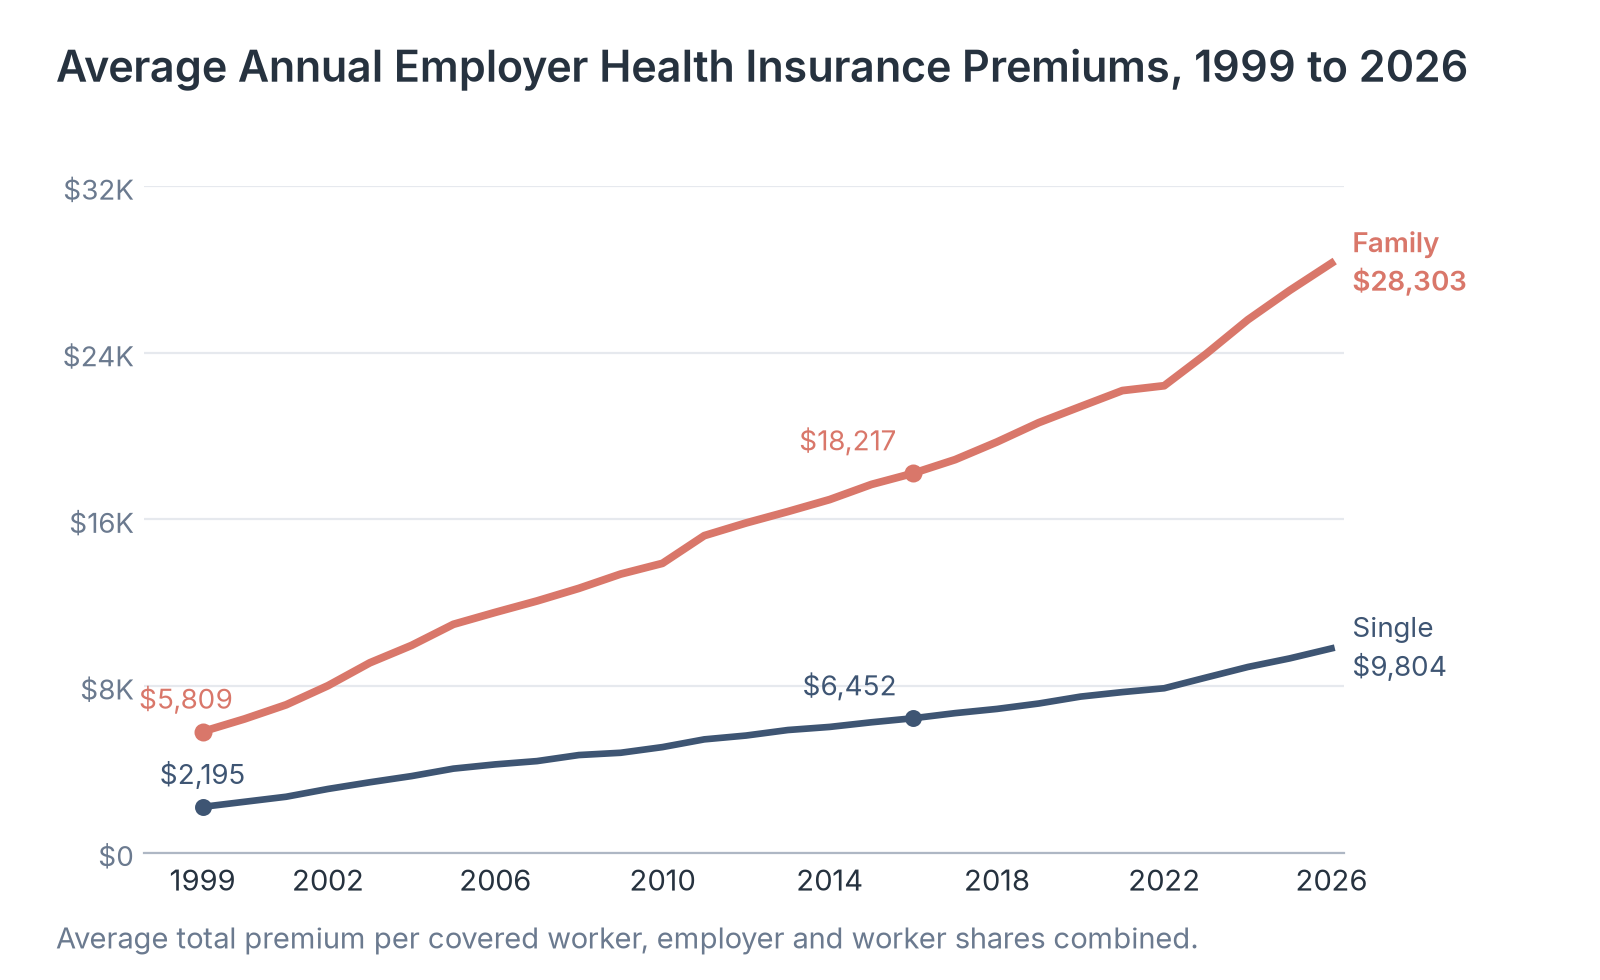
- The average annual premium for employer-sponsored family health coverage was $28,303 in 2026, up 5% from $26,993 in 2025. The average premium for single coverage was $9,804.
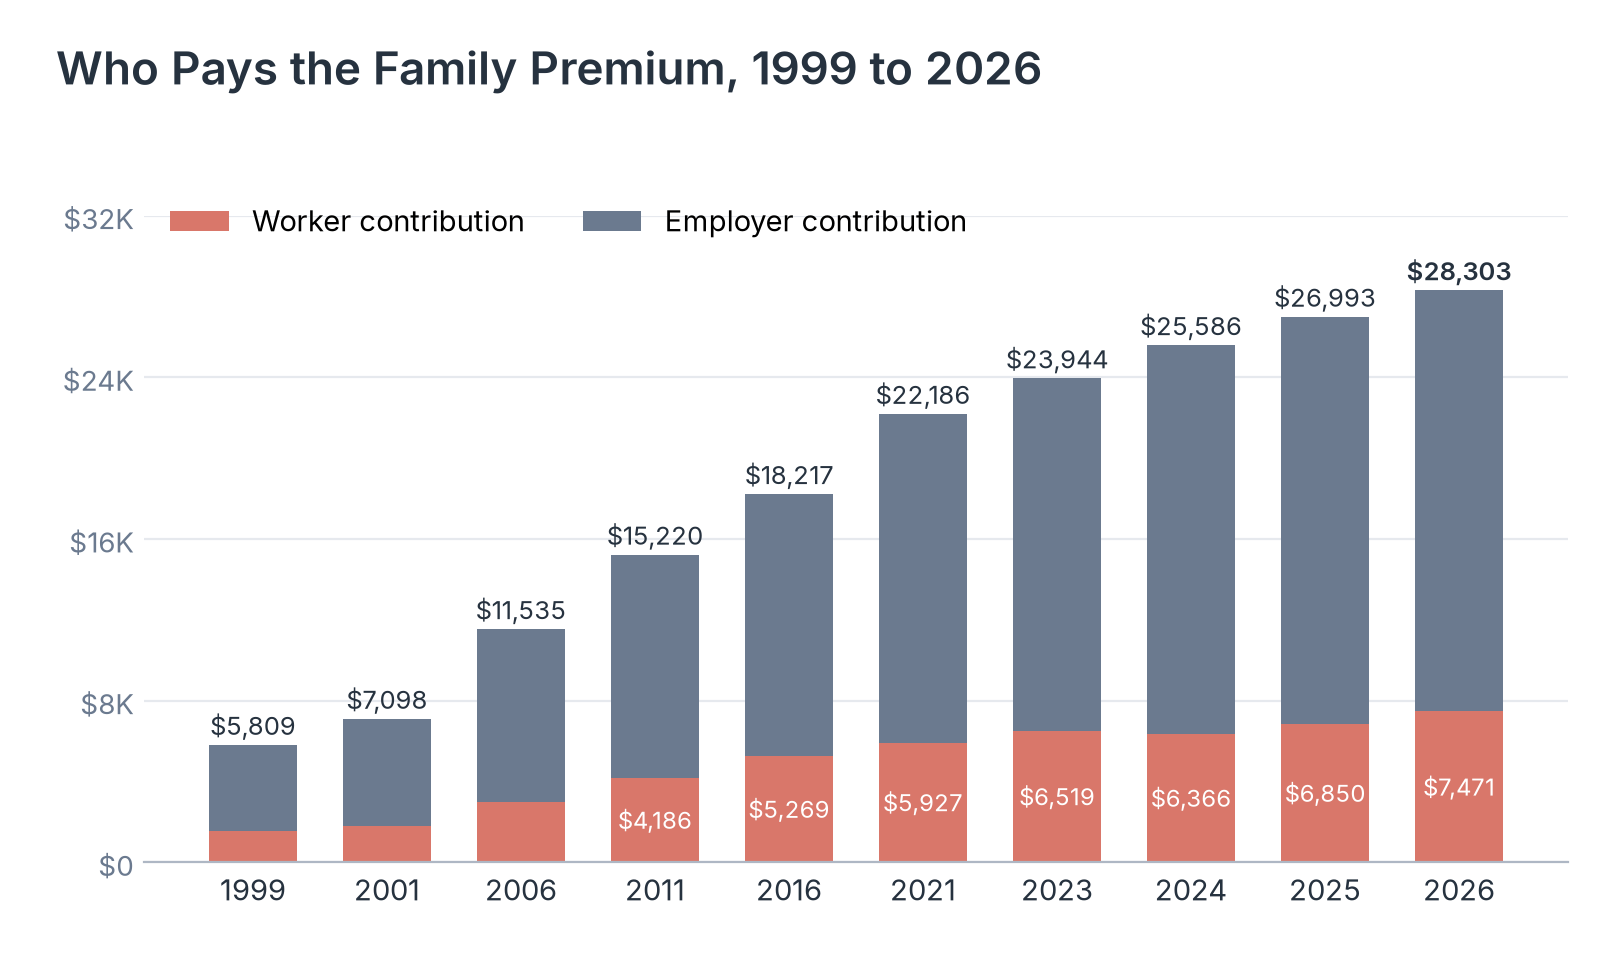
- Covered workers paid an average of $7,471 toward family coverage in 2026, up 9% or $621 from 2025. Employers paid the other $20,833.
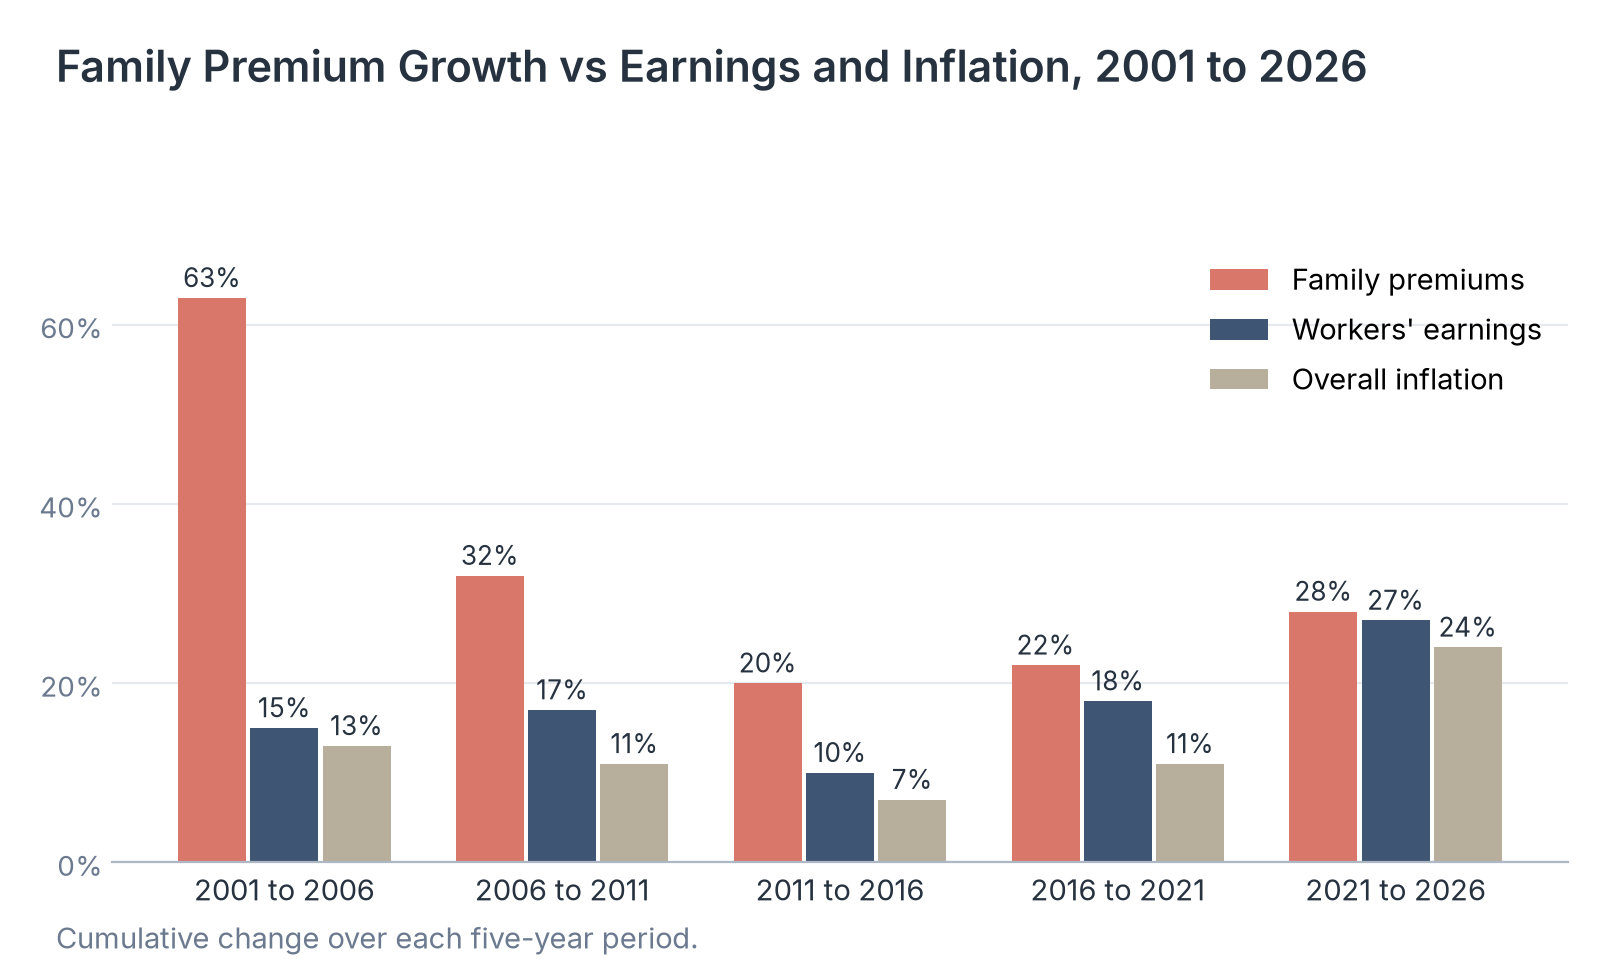
- Family premiums rose 28% from 2021 to 2026, compared with 27% growth in workers' earnings and 24% overall inflation.
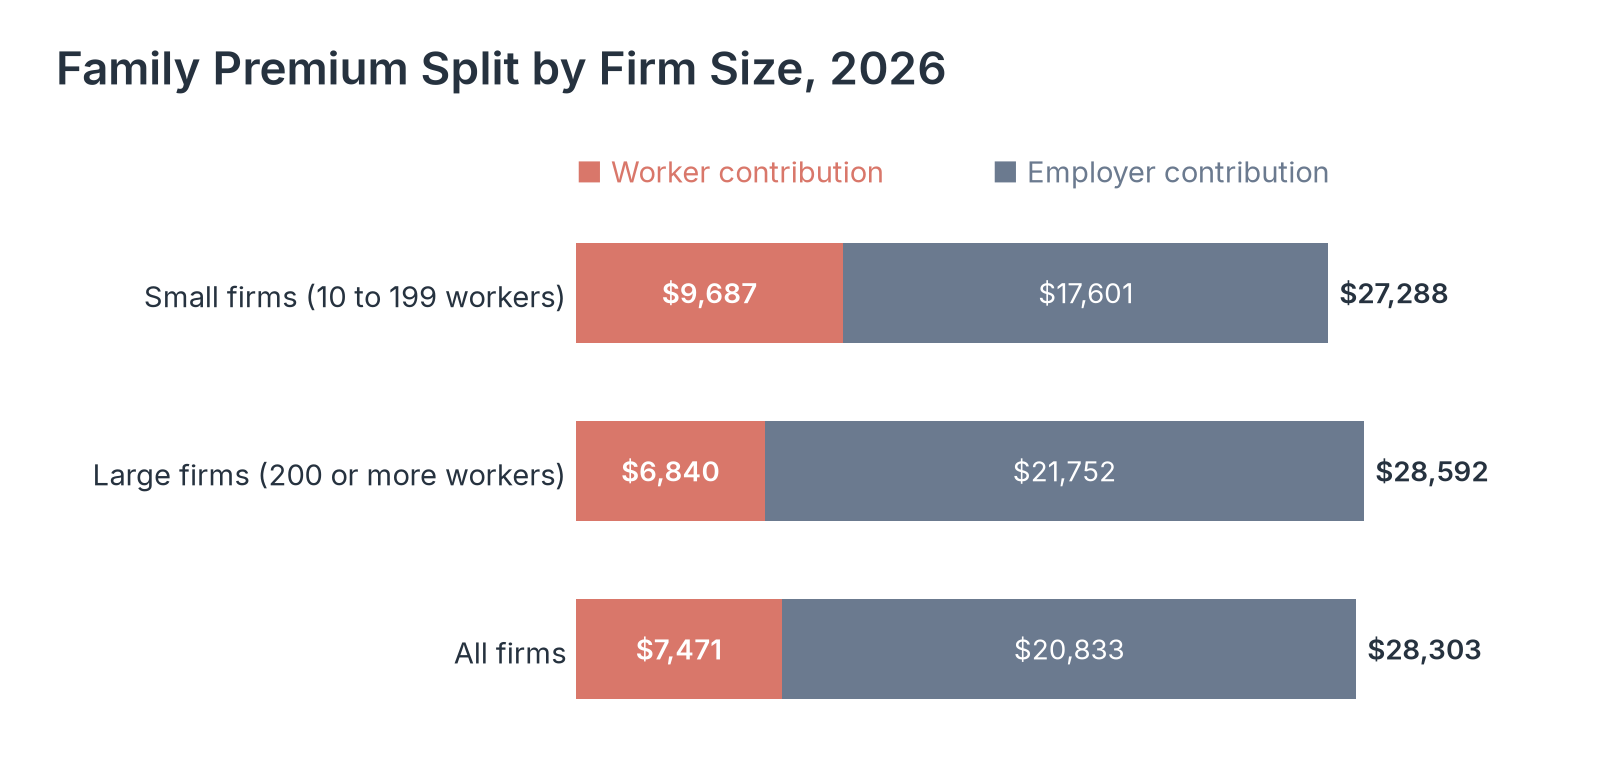
- Workers at small firms (10 to 199 workers) paid $9,687 toward family coverage in 2026, compared with $6,840 at larger firms.
- Among private-sector employers in 2025, the average family premium ranged from $21,932 in Mississippi to $30,132 in Alaska.
Employer-sponsored insurance covers almost 157 million people under age 65 in the United States.2 The premium for that coverage is the full yearly cost of a health plan for one worker, either for the worker alone (single coverage) or for the worker and family members (family coverage). Employers pay most of the premium, and workers pay the rest, usually through deductions from their paychecks.
Many larger employers pay medical claims from their own funds, an arrangement called self-funding, and 71% of covered workers are in self-funded plans; for those plans, the premium is the cost of coverage per worker. Premiums have risen every year since 1999, and yearly increases picked up again after 2022. But the bill is not split the same way at every employer.
Our analysts compiled the average premium and contribution figures published in the KFF Employer Health Benefits Survey for every year from 1999 to 2026.2,3 The 2026 survey interviewed 1,937 private and non-federal public employers with 10 or more workers between January and July 2026.
We added the 2025 state tables from the federal Medical Expenditure Panel Survey Insurance Component (MEPS-IC), which report premiums at private-sector employers in all 50 states and the District of Columbia.4 We measured average single and family premiums, the worker and employer shares, premium growth against earnings and inflation, and differences by firm size, plan type, region, industry, and state.
In the following sections, we cover how average premiums have changed since 1999, how the family premium is split between workers and employers, how premium growth compares with earnings and inflation, the gap between small and large employers, premiums by plan type, region, and industry, and premiums by state.
How Average Employer Premiums Have Changed Since 1999
The yearly average premium is the figure most often used to describe what employer health coverage costs. We tracked single and family premiums for every survey year since 1999, along with the yearly change in the family premium, to show the long-run path and the recent pace.
| Year | Single coverage | Family coverage | Family premium change from prior year |
|---|---|---|---|
| 2026 | $9,804 | $28,303 | 5% |
| 2025 | $9,325 | $26,993 | 6% |
| 2024 | $8,913 | $25,586 | 7% |
| 2023 | $8,406 | $23,944 | 7% |
| 2022 | $7,892 | $22,419 | 1% |
| 2021 | $7,707 | $22,186 | 4% |
| 2020 | $7,491 | $21,419 | 4% |
| 2019 | $7,159 | $20,646 | 5% |
| 2018 | $6,899 | $19,718 | 4% |
| 2017 | $6,697 | $18,870 | 4% |
| 2016 | $6,452 | $18,217 | 3% |
| 2015 | $6,258 | $17,680 | 4% |
| 2014 | $6,035 | $16,953 | 4% |
| 2013 | $5,886 | $16,377 | 3% |
| 2012 | $5,621 | $15,829 | 4% |
| 2011 | $5,437 | $15,220 | 10% |
| 2010 | $5,066 | $13,890 | 4% |
| 2009 | $4,794 | $13,375 | 5% |
| 2008 | $4,684 | $12,688 | 5% |
| 2007 | $4,394 | $12,084 | 5% |
| 2006 | $4,236 | $11,535 | 5% |
| 2005 | $4,032 | $10,962 | 10% |
| 2004 | $3,674 | $9,950 | 9% |
| 2003 | $3,377 | $9,113 | 14% |
| 2002 | $3,056 | $8,015 | 13% |
| 2001 | $2,682 | $7,098 | 11% |
| 2000 | $2,439 | $6,415 | 10% |
| 1999 | $2,195 | $5,809 |
Source: KFF, 2026 Employer Health Benefits Survey, Section 1 and Summary of Findings figure data, October 2026. Average total premium per covered worker, including worker and employer contributions. Figures for 1999 to 2017 come from the Kaiser/HRET Survey of Employer-Sponsored Health Benefits, which preceded the KFF survey.
Source: Healthcare Industry Reviews analysis of KFF Employer Health Benefits Survey data, conducted November 2026.
Key Findings
- The average family premium was $5,809 in 1999, so the 2026 figure is 4.9 times as high. The single premium is 4.5 times its 1999 level of $2,195.
- Family premiums rose just 1% in 2022, the smallest increase in the series, and then 7% in 2023, 7% in 2024, and 6% in 2025. Those were the largest yearly increases since a 10% rise in 2011.
- The average family premium grew by $6,117 in five years, from $22,186 in 2021. For employers and workers budgeting for 2027 coverage, the starting point is a premium that has grown at least 5% a year for four straight years, a run last seen from 2000 to 2009.
How the Family Premium Is Split Between Workers and Employers
A worker's paycheck deduction is the part of the premium most people notice, so it helps to see it next to the employer's share. We compared the worker and employer contributions to the average family premium in selected years from 1999 to 2026.
| Year | Worker contribution | Employer contribution | Total premium | Worker share of premium |
|---|---|---|---|---|
| 2026 | $7,471 | $20,833 | $28,303 | 27% |
| 2025 | $6,850 | $20,143 | $26,993 | 26% |
| 2024 | $6,366 | $19,219 | $25,586 | 26% |
| 2023 | $6,519 | $17,425 | $23,944 | 29% |
| 2021 | $5,927 | $16,259 | $22,186 | 28% |
| 2016 | $5,269 | $12,948 | $18,217 | 30% |
| 2011 | $4,186 | $11,034 | $15,220 | 28% |
| 2006 | $2,971 | $8,564 | $11,535 | 27% |
| 2001 | $1,800 | $5,298 | $7,098 | 26% |
| 1999 | $1,563 | $4,246 | $5,809 | 27% |
Source: KFF, 2026 Employer Health Benefits Survey, Section 6 figure data, October 2026. Average annual contributions per covered worker with family coverage.
Source: Healthcare Industry Reviews analysis of KFF Employer Health Benefits Survey data, conducted November 2026.
Key Findings
- Workers paid 27% of the average family premium in 2026, the same share as in 1999. The share peaked at 31% in 2017 and fell to 26% in 2024 and 2025.
- The employer contribution to family coverage grew from $4,246 in 1999 to $20,833 in 2026. The worker contribution grew from $1,563 to $7,471 over the same years.
- The worker contribution grew faster than the total premium in 2026, and the worker share went up for the first time since 2023. A larger worker share means more of each premium increase comes straight out of paychecks.
How Premium Growth Compares With Earnings and Inflation
Premium increases matter most when they outpace the money workers earn and the prices of everything else they buy. We compared cumulative growth in the family premium with workers' earnings and overall inflation across five five-year periods since 2001.
| Period | Family premiums | Workers' earnings | Overall inflation |
|---|---|---|---|
| 2001 to 2006 | 63% | 15% | 13% |
| 2006 to 2011 | 32% | 17% | 11% |
| 2011 to 2016 | 20% | 10% | 7% |
| 2016 to 2021 | 22% | 18% | 11% |
| 2021 to 2026 | 28% | 27% | 24% |
Source: KFF, 2026 Employer Health Benefits Survey, Section 1 and Summary of Findings figure data, October 2026. Inflation is the Bureau of Labor Statistics Consumer Price Index; earnings are from the Bureau of Labor Statistics Current Employment Statistics survey.
Source: Healthcare Industry Reviews analysis of KFF Employer Health Benefits Survey data, conducted November 2026.
Key Findings
- Family premiums rose 63% from 2001 to 2006, more than four times the growth in workers' earnings (15%) and inflation (13%). Premium growth slowed in each of the next two periods.
- From 2016 to 2021, family premiums rose 22% while earnings rose 18% and prices rose 11%. In the latest period, the three measures were within four percentage points of each other.
- Inflation of 8% in 2022 and 5.8% in 2023 pushed price growth in the latest period to 24%. In 2026 alone, family premiums rose 5%, against 3.7% growth in earnings and 2.7% inflation, so premiums are again growing faster than paychecks.
How Premiums Differ at Small and Large Employers
The size of an employer shapes both what a plan costs and how much of that cost lands on the worker. We compared premiums and worker contributions at small firms, with 10 to 199 workers, and large firms, with 200 or more.
| Firm size | Single premium | Family premium | Worker contribution, family | Worker share of family premium |
|---|---|---|---|---|
| Small firms (10 to 199 workers) | $9,593 | $27,288 | $9,687 | 37% |
| Large firms (200 or more workers) | $9,865 | $28,592 | $6,840 | 25% |
| All firms | $9,804 | $28,303 | $7,471 | 27% |
Source: KFF, 2026 Employer Health Benefits Survey, Section 6 figure data, October 2026.
Source: Healthcare Industry Reviews analysis of KFF Employer Health Benefits Survey data, conducted November 2026.
Key Findings
- Small-firm workers paid $2,847 more toward family coverage than large-firm workers in 2026, even though the small-firm family premium was $1,304 lower. Small employers covered $17,601 of the family premium, compared with $21,752 at large employers.
- Workers at small firms paid 37% of the family premium, compared with 25% at large firms. For single coverage, the shares were much closer: 16% at small firms and 18% at large firms.
- The worker contribution for family coverage at small firms grew from $8,889 in 2025 to $9,687 in 2026. For a small-business worker who adds family members to a plan, that works out to about $807 a month.
Premiums by Plan Type, Region, and Industry
The kind of plan a worker picks, where the employer is located, and the industry it is in all move the average premium. We compared single and family premiums across the four main plan types, the four census regions, and nine industry groups in the 2026 survey.
| Group | Single coverage | Family coverage |
|---|---|---|
| Plan type | ||
| HMO | $9,730 | $28,044 |
| PPO | $10,272 | $29,522 |
| POS | $9,854 | $27,613 |
| HSA-qualified plan | $8,989 | $26,450 |
| Region | ||
| Northeast | $10,806 | $31,378 |
| Midwest | $9,914 | $28,653 |
| South | $9,272 | $26,702 |
| West | $9,749 | $28,082 |
| Industry | ||
| Health care | $10,821 | $30,778 |
| Finance | $10,053 | $29,733 |
| Wholesale | $9,517 | $28,925 |
| State and local government | $10,174 | $28,272 |
| Transportation, communications, and utilities | $9,286 | $28,055 |
| Manufacturing | $9,643 | $27,630 |
| Service | $9,827 | $27,616 |
| Retail | $8,589 | $26,668 |
| Agriculture, mining, and construction | $8,990 | $26,661 |
| All employers | $9,804 | $28,303 |
Source: KFF, 2026 Employer Health Benefits Survey, Section 1 figure data, October 2026. HSA-qualified plans are high-deductible plans that let enrollees open a health savings account.
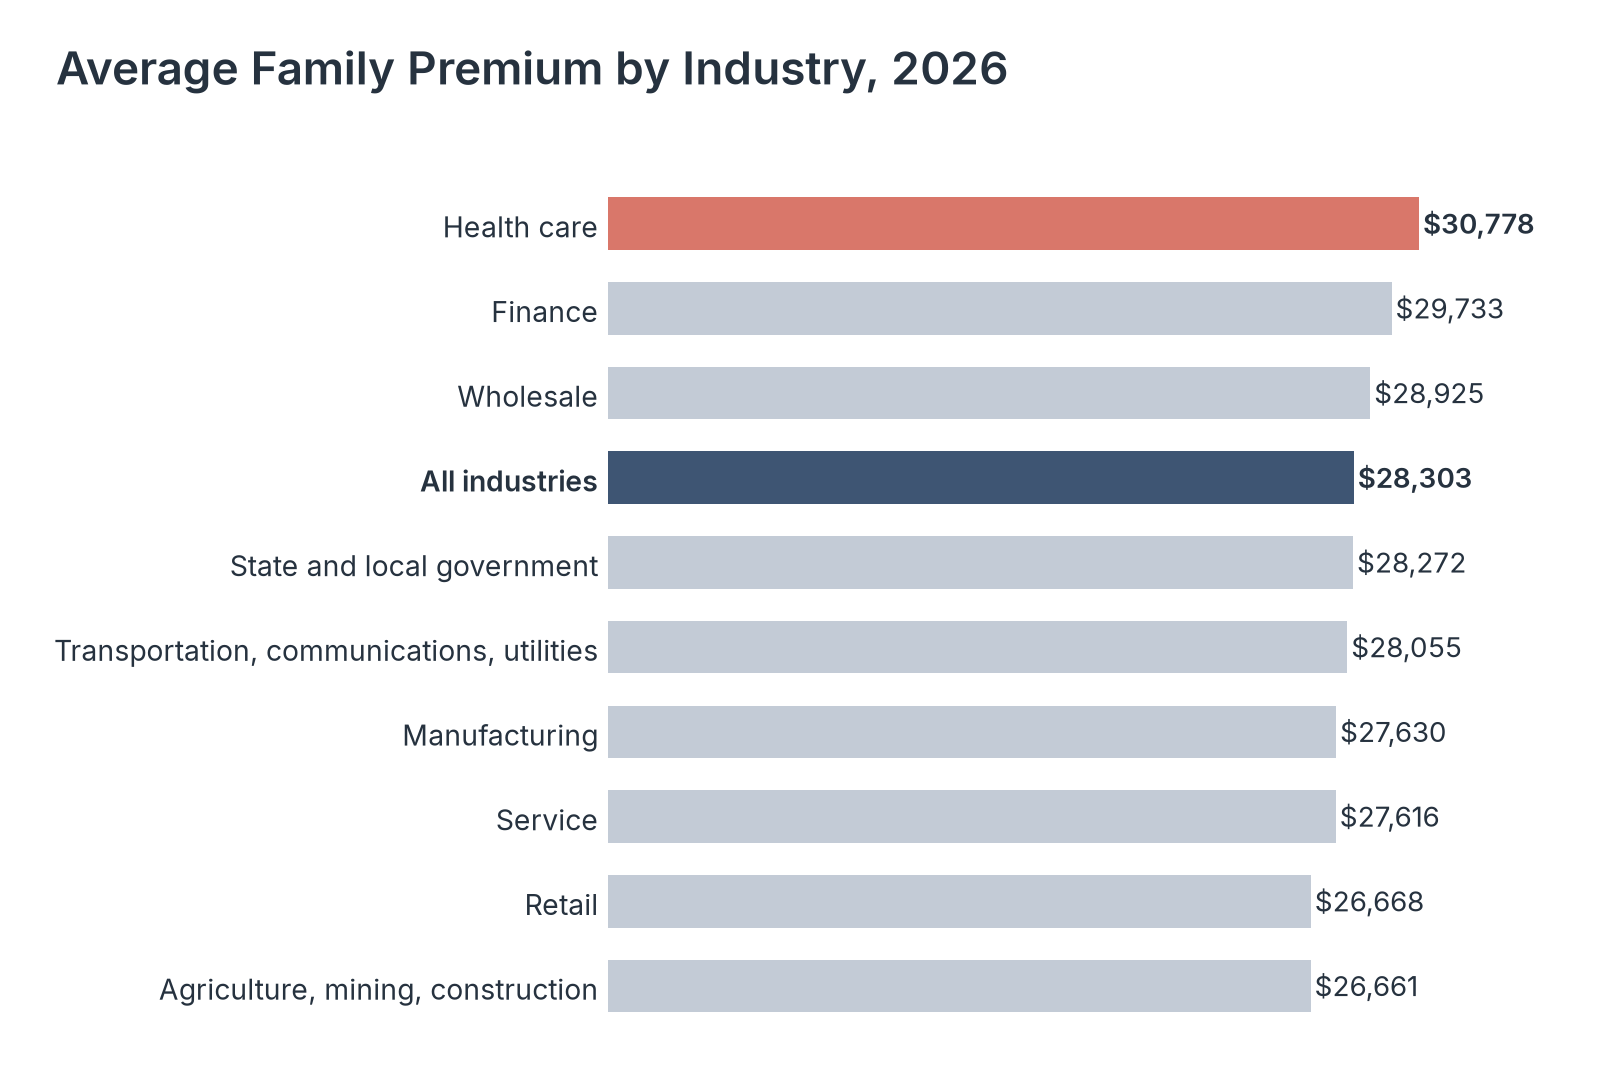
Source: Healthcare Industry Reviews analysis of KFF Employer Health Benefits Survey data, conducted November 2026.
Key Findings
- Health care employers had the highest average family premium of any industry group in 2026, $30,778, followed by finance at $29,733. Retail ($26,668) and agriculture, mining, and construction ($26,661) had the lowest.
- The average family premium in the Northeast was $31,378, $4,676 more than in the South ($26,702). The Midwest ($28,653) and West ($28,082) were close to the national average.
- PPO family coverage averaged $29,522, compared with $26,450 for HSA-qualified plans, a gap of $3,072. HSA-qualified plans carry high deductibles by design, so the lower premium comes with more out-of-pocket cost before coverage begins.
Employer Health Insurance Premiums by State
National averages hide large differences in what employers pay from one state to the next. We used the federal MEPS-IC state tables for 2025 to compare premiums and worker contributions at private-sector employers in every state and the District of Columbia.
| State | Single premium | Family premium | Employee contribution, family | Employee share of family premium |
|---|---|---|---|---|
| United States | $9,025 | $26,281 | $7,314 | 27.8% |
| Alabama | $8,169 | $23,554 | $7,540 | 32.0% |
| Alaska | $10,630 | $30,132 | $6,171 | 20.5% |
| Arizona | $7,734 | $23,143 | $8,493 | 36.7% |
| Arkansas | $7,804 | $22,956 | $7,824 | 34.1% |
| California | $9,162 | $27,057 | $7,847 | 29.0% |
| Colorado | $8,816 | $25,055 | $6,733 | 26.9% |
| Connecticut | $9,987 | $28,700 | $4,979 | 17.3% |
| Delaware | $9,459 | $25,600 | $6,993 | 27.3% |
| District of Columbia | $9,762 | $29,371 | $8,028 | 27.3% |
| Florida | $8,919 | $25,396 | $7,976 | 31.4% |
| Georgia | $8,907 | $26,439 | $7,224 | 27.3% |
| Hawaii | $8,285 | $23,603 | $5,531 | 23.4% |
| Idaho | $8,770 | $25,957 | $6,439 | 24.8% |
| Illinois | $9,724 | $28,248 | $7,838 | 27.7% |
| Indiana | $8,355 | $23,497 | $6,650 | 28.3% |
| Iowa | $8,620 | $25,181 | $7,533 | 29.9% |
| Kansas | $8,657 | $25,493 | $8,222 | 32.3% |
| Kentucky | $8,936 | $24,520 | $5,982 | 24.4% |
| Louisiana | $8,806 | $25,647 | $7,808 | 30.4% |
| Maine | $9,803 | $26,106 | $7,079 | 27.1% |
| Maryland | $8,760 | $24,717 | $6,502 | 26.3% |
| Massachusetts | $10,436 | $29,619 | $7,501 | 25.3% |
| Michigan | $8,230 | $23,800 | $6,437 | 27.0% |
| Minnesota | $8,586 | $25,947 | $7,013 | 27.0% |
| Mississippi | $7,612 | $21,932 | $6,228 | 28.4% |
| Missouri | $8,084 | $25,520 | $6,797 | 26.6% |
| Montana | $8,899 | $21,989 | $4,967 | 22.6% |
| Nebraska | $8,907 | $26,830 | $6,369 | 23.7% |
| Nevada | $8,215 | $23,075 | $7,902 | 34.2% |
| New Hampshire | $9,502 | $28,161 | $7,434 | 26.4% |
| New Jersey | $9,743 | $29,666 | $7,053 | 23.8% |
| New Mexico | $9,447 | $26,482 | $6,761 | 25.5% |
| New York | $10,913 | $29,752 | $7,075 | 23.8% |
| North Carolina | $8,612 | $25,311 | $8,073 | 31.9% |
| North Dakota | $9,318 | $24,903 | $5,586 | 22.4% |
| Ohio | $8,804 | $24,661 | $6,453 | 26.2% |
| Oklahoma | $8,124 | $24,483 | $6,955 | 28.4% |
| Oregon | $9,225 | $27,182 | $9,374 | 34.5% |
| Pennsylvania | $9,421 | $26,623 | $6,720 | 25.2% |
| Rhode Island | $9,388 | $27,361 | $7,028 | 25.7% |
| South Carolina | $8,552 | $25,046 | $8,269 | 33.0% |
| South Dakota | $8,985 | $26,110 | $6,892 | 26.4% |
| Tennessee | $8,667 | $25,123 | $5,972 | 23.8% |
| Texas | $8,543 | $25,053 | $7,913 | 31.6% |
| Utah | $8,448 | $25,122 | $5,567 | 22.2% |
| Vermont | $10,004 | $25,450 | $7,870 | 30.9% |
| Virginia | $8,970 | $27,257 | $8,692 | 31.9% |
| Washington | $8,712 | $27,618 | $8,222 | 29.8% |
| West Virginia | $8,878 | $26,094 | $5,129 | 19.7% |
| Wisconsin | $9,557 | $27,309 | $6,148 | 22.5% |
| Wyoming | $8,997 | $27,084 | $6,830 | 25.2% |
Source: Agency for Healthcare Research and Quality, Medical Expenditure Panel Survey Insurance Component, 2025 state tables, Table II, private-sector rows II.C.1, II.D.1, II.D.2, and II.D.3. Averages per enrolled employee at establishments that offer health insurance.
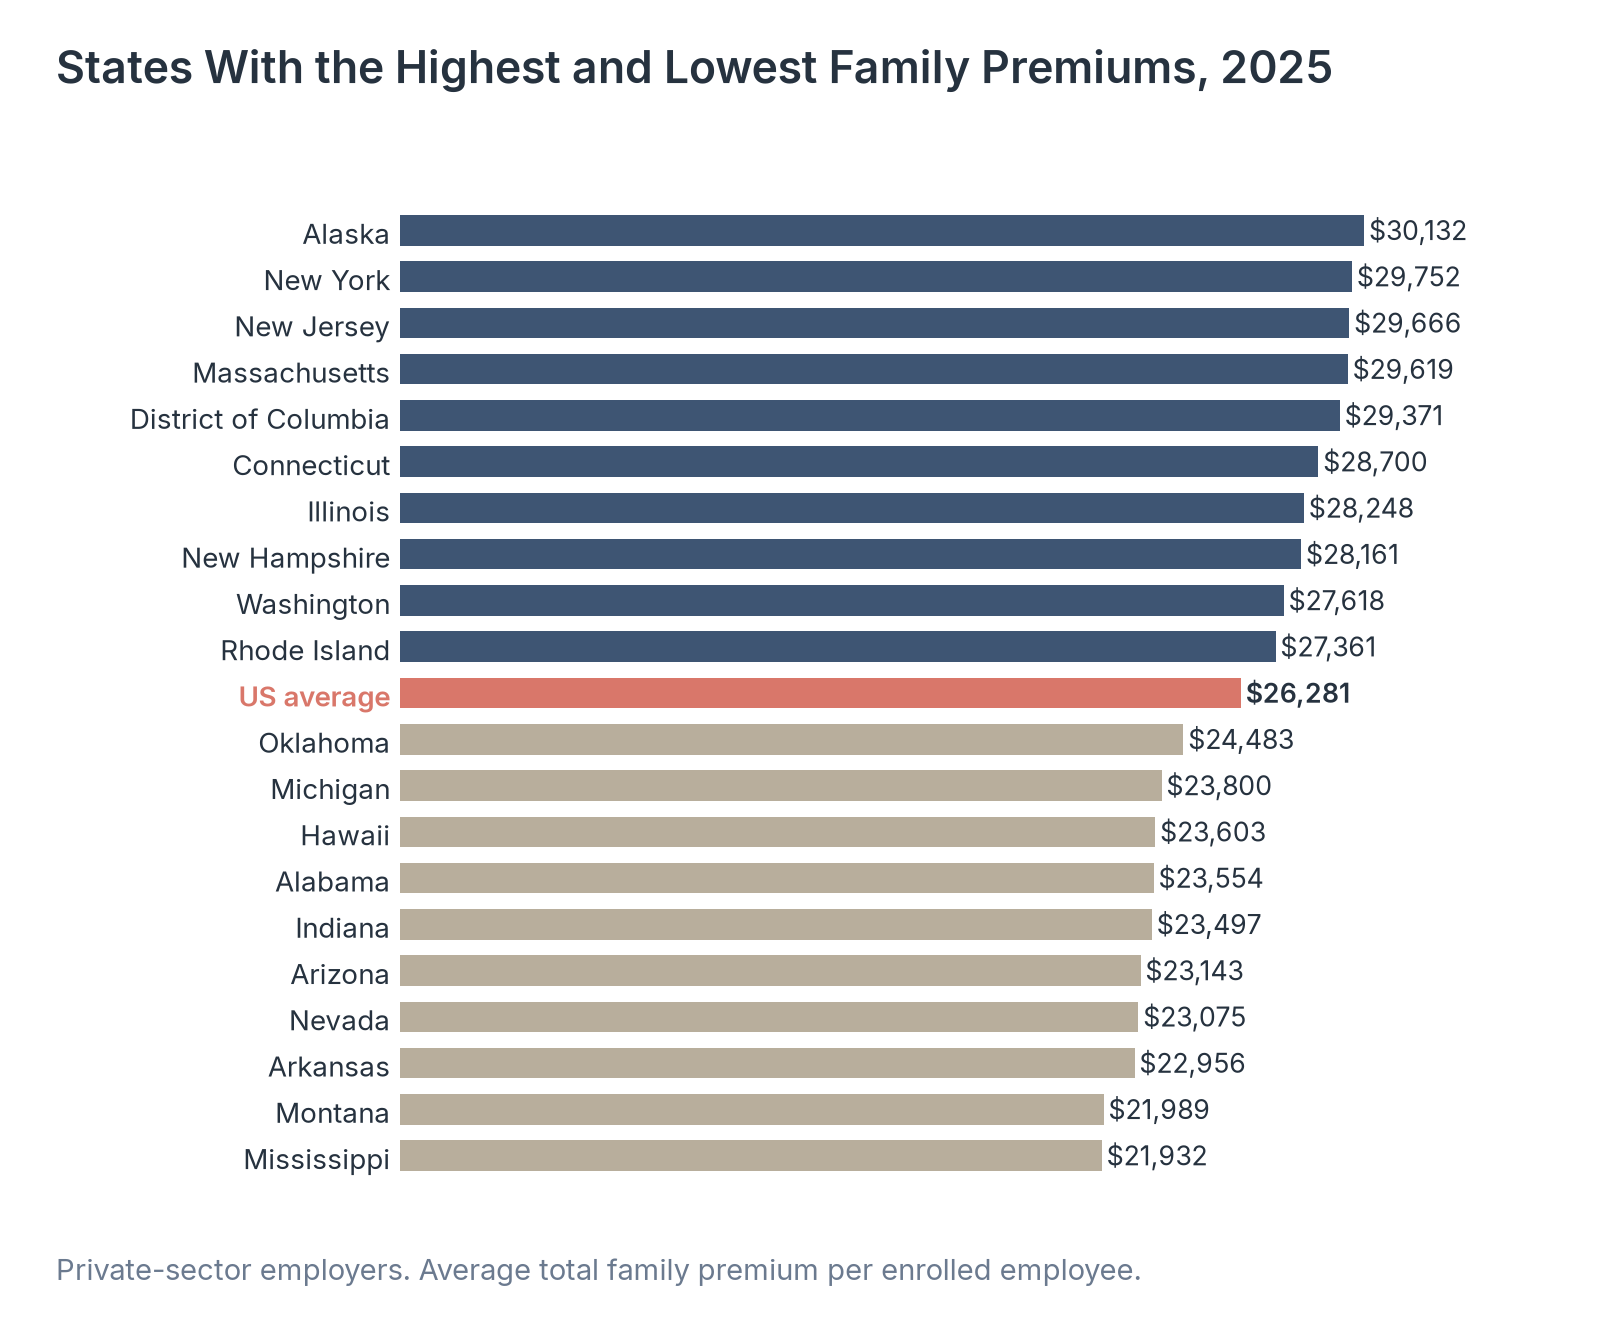
Source: Healthcare Industry Reviews analysis of Medical Expenditure Panel Survey Insurance Component data, conducted November 2026.
Key Findings
- New York ($29,752), New Jersey ($29,666), and Massachusetts ($29,619) followed Alaska with the highest family premiums in 2025. New York also had the highest single premium, $10,913.
- Employees in Arizona paid 36.7% of the family premium, the highest share of any state, compared with 17.3% in Connecticut, the lowest. In dollars, Oregon employees paid the most toward family coverage, $9,374, and Montana employees paid the least, $4,967.
- A low state premium does not always mean a low bill for workers: Arizona's family premium was $3,138 below the national average, but its employees paid $1,179 more than the national average employee contribution. For workers, the employee share can matter as much as the premium itself.
What Rising Premiums Mean for Workers and Employers
For a worker with family coverage, most of the premium never appears on a pay stub. The worker sees a paycheck deduction of about $623 a month on average, while the employer pays nearly three times as much on the worker's behalf.
The national average is only a starting point. Workers at small firms pay far more toward family coverage than workers at large firms, and the average family premium differs by more than $8,000 a year between the highest-cost and lowest-cost states, so a worker at a small firm in a high-premium state can face a bill well above the national figure.
So if you are citing employer premium figures, use the KFF figure for the national average across all employers with 10 or more workers, and the MEPS-IC figure when you need a state comparison for private-sector employers, and give the year for each.
Data Collection and Methodology
National figures come from the KFF Employer Health Benefits Survey, published October 22, 2026, and the figure data tables KFF publishes with it. The 2026 survey covers 1,937 randomly selected private and non-federal public employers with 10 or more workers. Davis Research, LLC conducted the fieldwork between January and July 2026, and the overall response rate was 11%.
Results are weighted to represent covered workers. Figures for 1999 to 2017 come from the Kaiser/HRET Survey of Employer-Sponsored Health Benefits, which KFF reports in the same historical series. Beginning with the 2025 survey, KFF limited its sample to firms with 10 or more workers.
Premiums are the total cost of coverage per covered worker, including the worker and employer contributions; for self-funded plans, KFF measures premium equivalents.
State figures come from the 2025 MEPS-IC state tables published by the Agency for Healthcare Research and Quality. They cover private-sector establishments of all sizes in each state and report averages per enrolled employee at establishments that offer health insurance. Because the two surveys cover different employers, the MEPS-IC national average family premium for 2025 ($26,281) differs from the KFF 2025 figure ($26,993); we do not mix the two series in any table or chart.
All dollar figures are nominal. Yearly percentage changes and five-year growth rates come from KFF as published. We calculated differences, ratios, and multi-year changes from the published values.
Sources
- Healthcare Industry Reviews analysis of KFF Employer Health Benefits Survey premium and contribution data for 1999 to 2026 and Medical Expenditure Panel Survey Insurance Component state premium tables for 2025, conducted November 2026.
- KFF, 2026 Employer Health Benefits Survey. Published October 22, 2026.
- KFF, 2026 Employer Health Benefits Survey figure data tables: Summary of Findings, Section 1, Cost of Health Insurance, and Section 6, Worker and Employer Contributions for Premiums. October 2026.
- Agency for Healthcare Research and Quality, Medical Expenditure Panel Survey Insurance Component, State Tables, 2025. Table II, private-sector data by firm size, for each state and the United States.