Healthcare Workplace Violence Statistics: 2026 Report
Published
Our analysts worked through the Bureau of Labor Statistics' 2023-24 tables on nonfatal workplace injuries, which count 2,983,110 private-sector injury and illness cases over the two years that led to time off, restricted duty, or a job transfer, including 78,340 caused by violent acts. We compared them with the agency's 2021-22 figures to show how often health care workers are hurt by violence on the job, and in which settings and jobs, as of Q4 2026.
Key Findings
- Health care and social assistance workers had 55,980 violent-act injuries that led to time off, restricted duty, or a job transfer in 2023-24, 71.5% of all such cases in private industry.
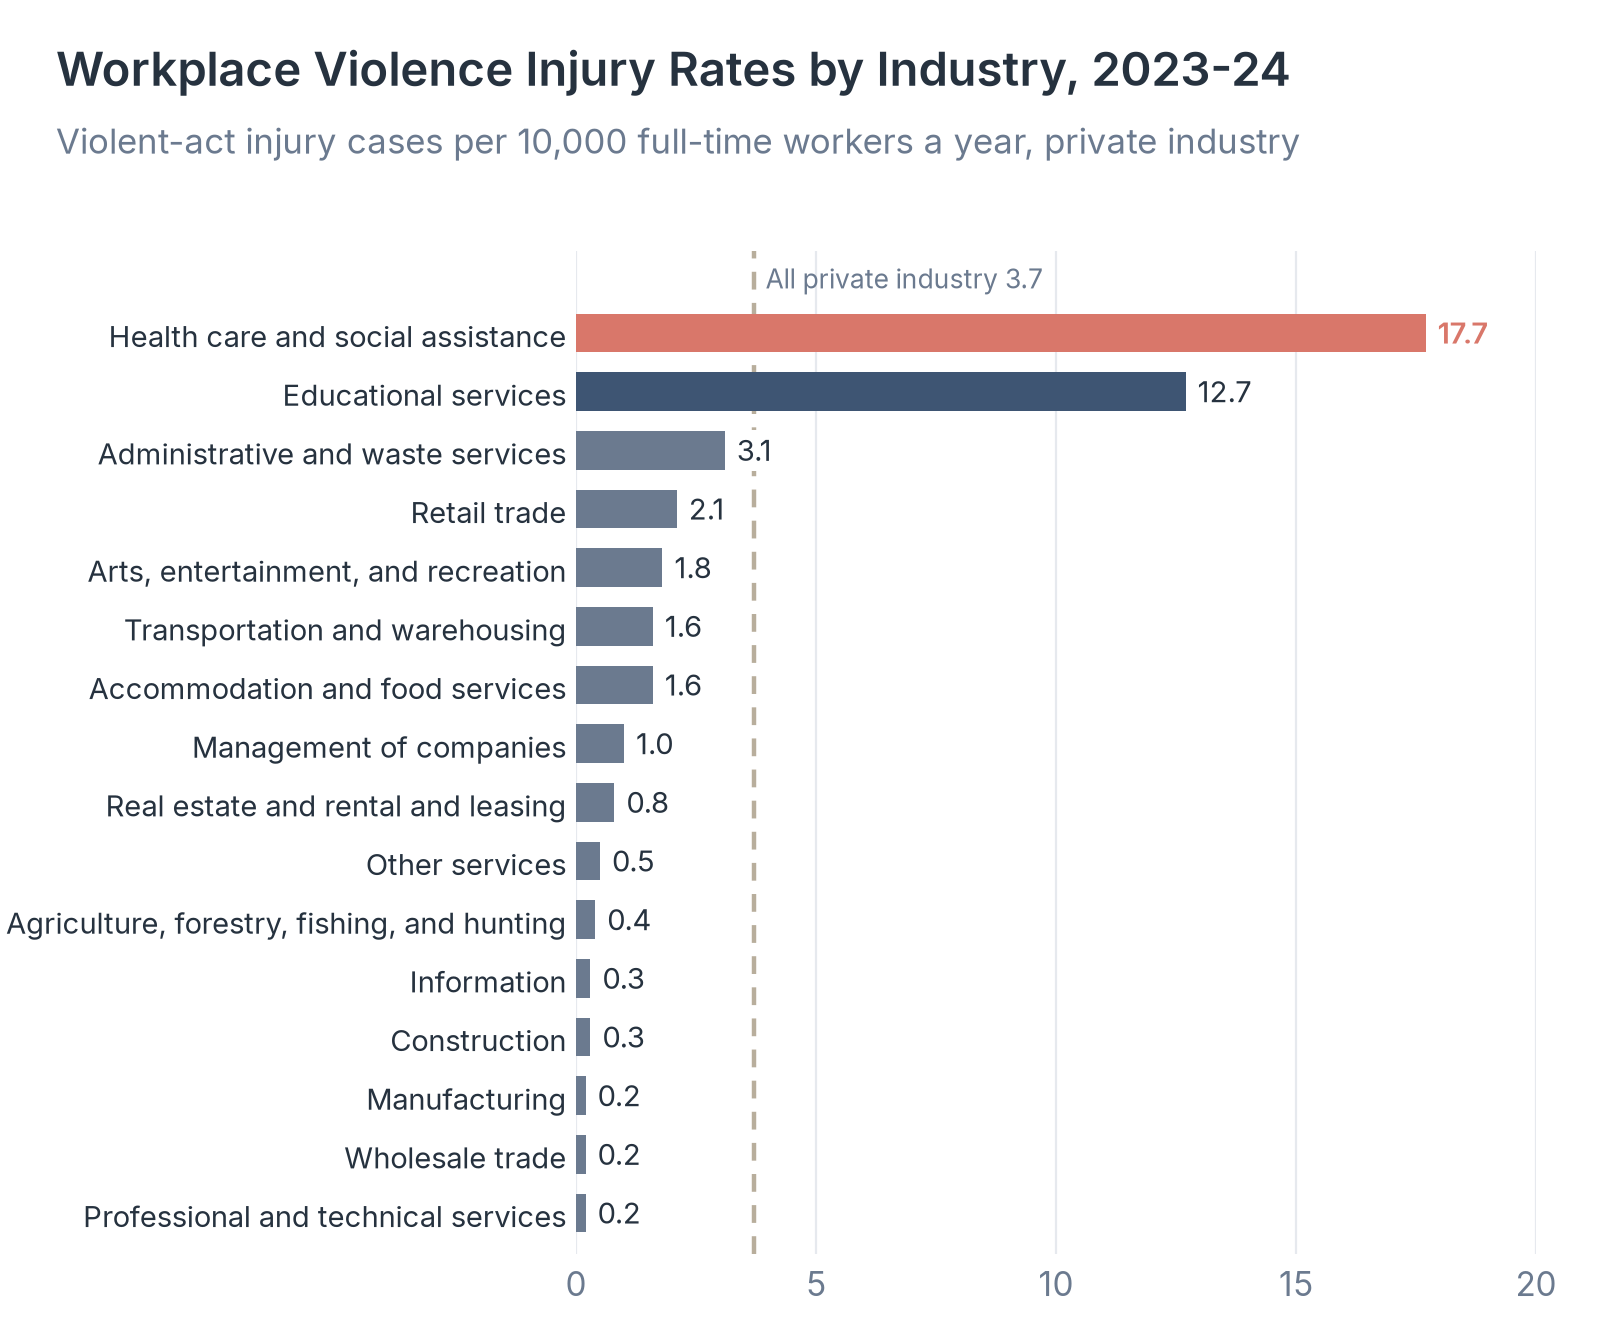
- The sector's violence injury rate was 17.7 cases per 10,000 full-time workers a year in 2023-24, 4.8 times the private-industry rate of 3.7.
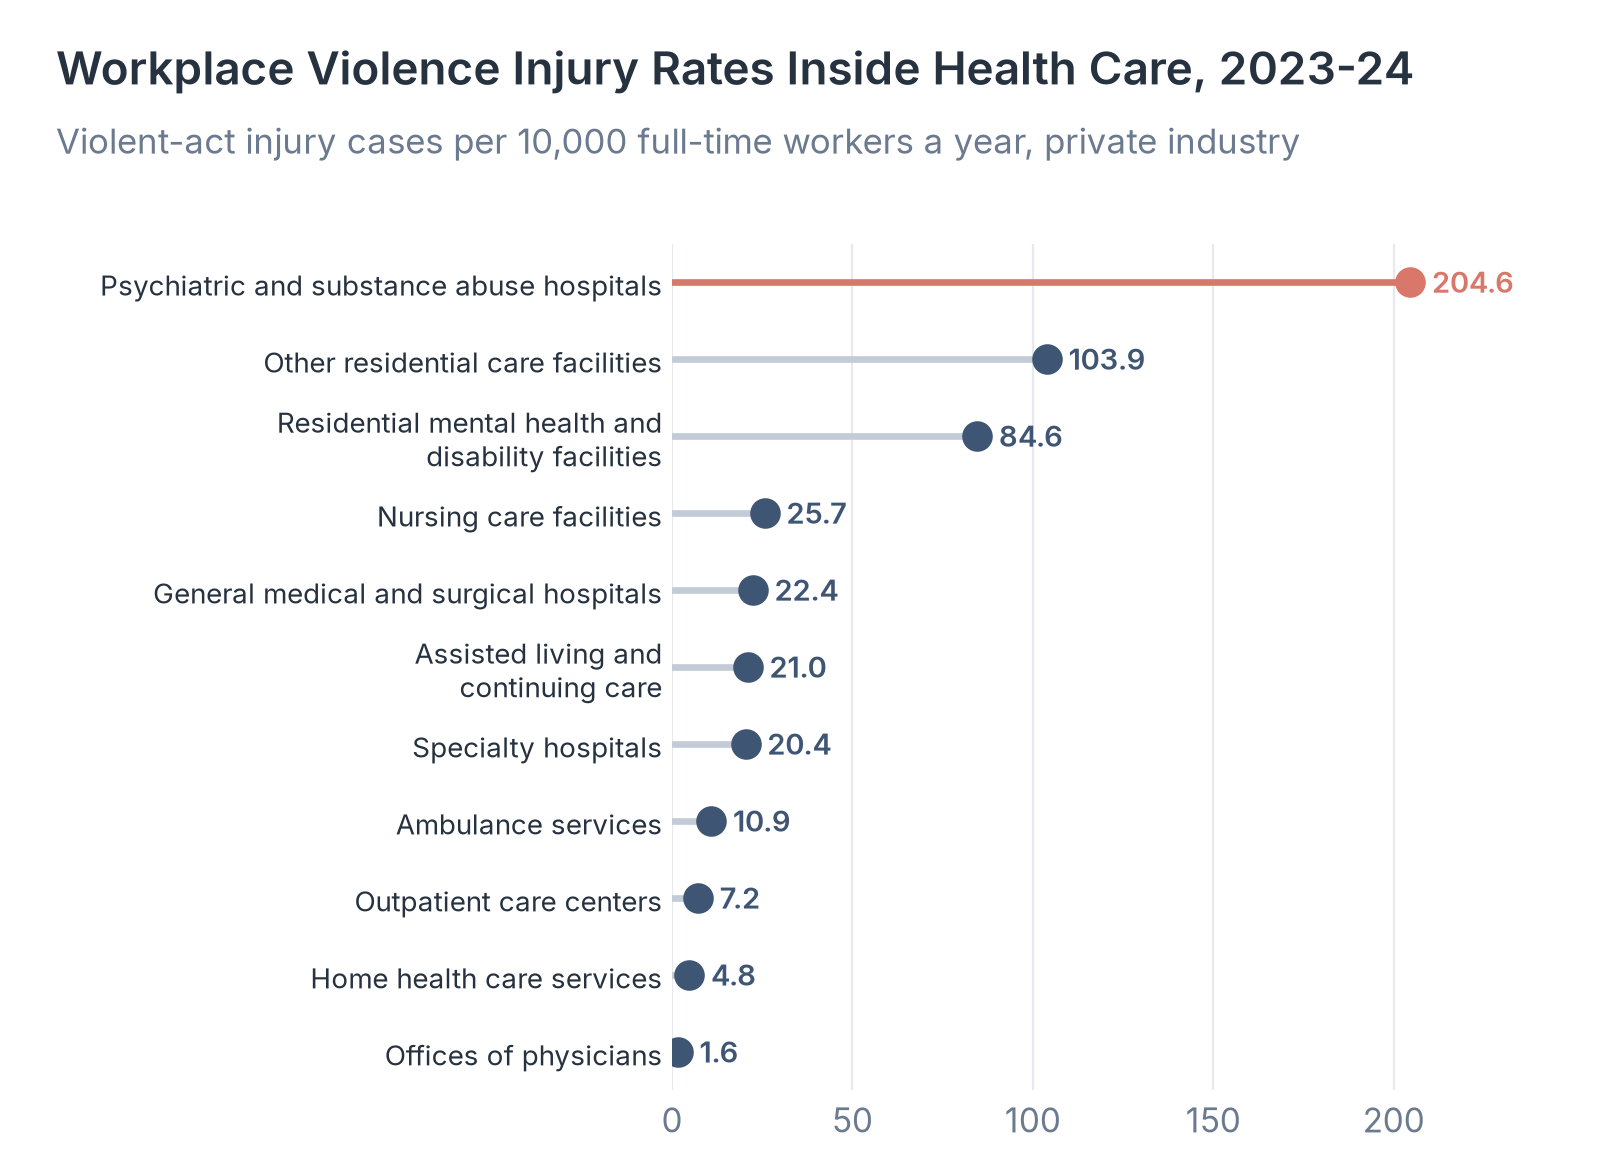
- Psychiatric and substance abuse hospitals had a rate of 204.6 per 10,000 full-time workers, and violent acts caused 55.2% of all their injury cases with time off or restricted duty.
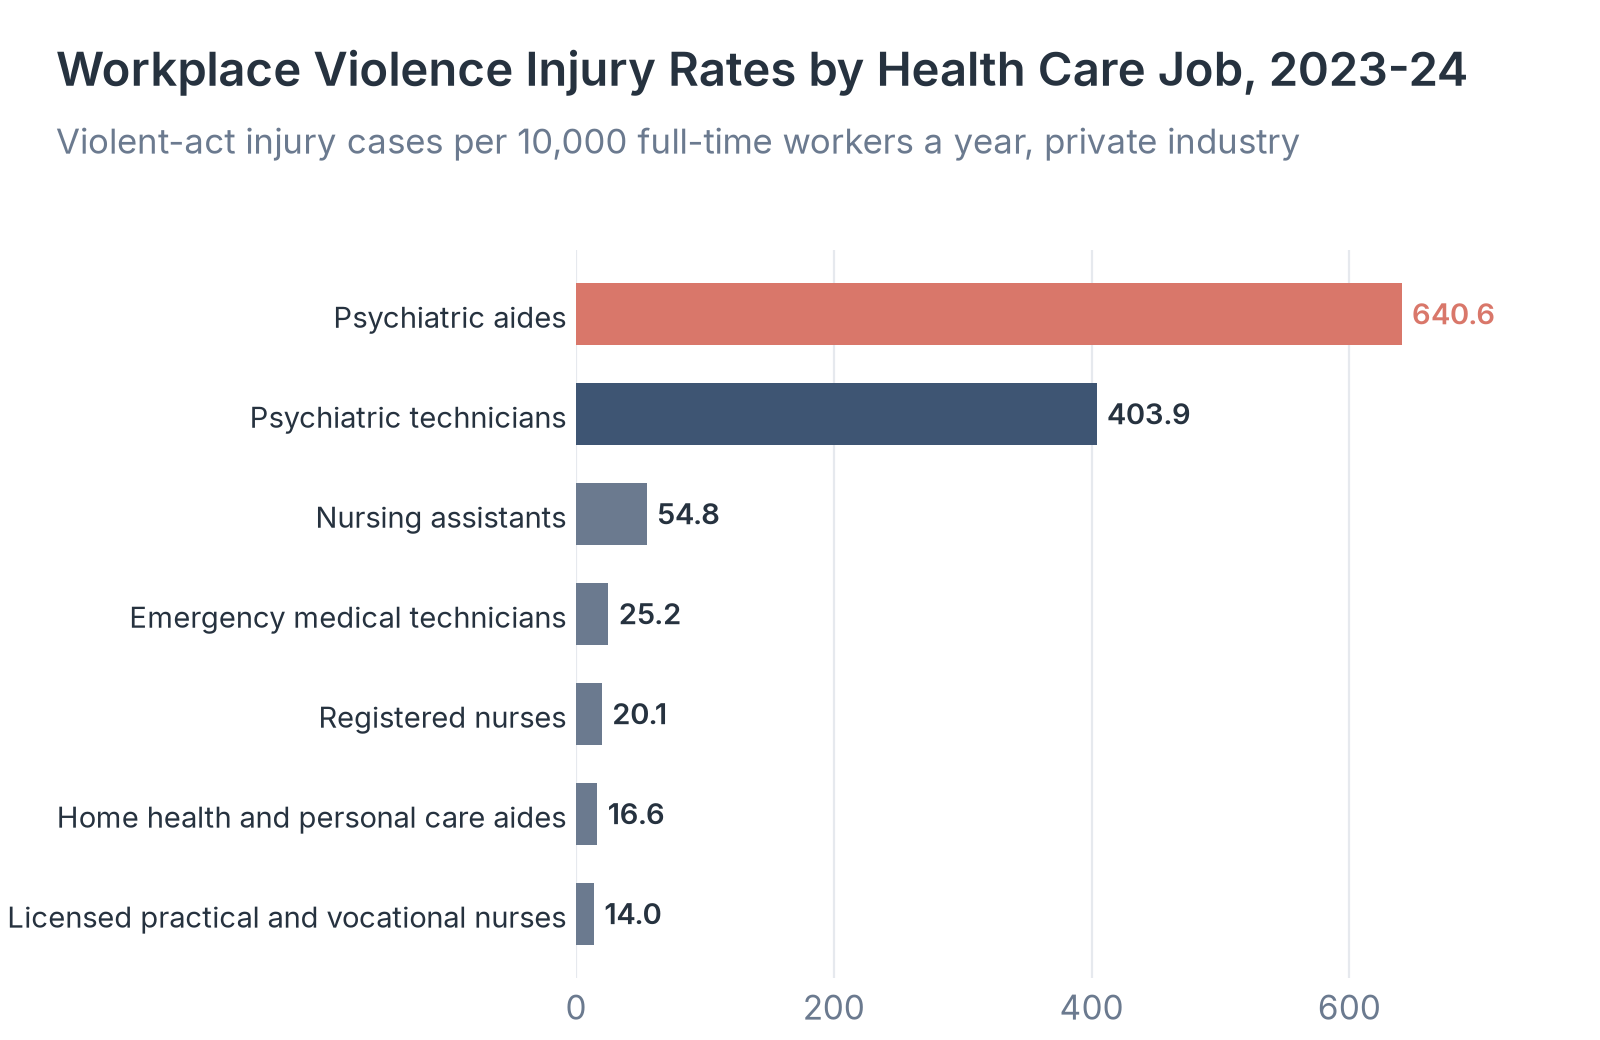
- Psychiatric aides had a violence injury rate of 640.6 per 10,000 full-time workers, the highest of any occupation in the 2023-24 tables.
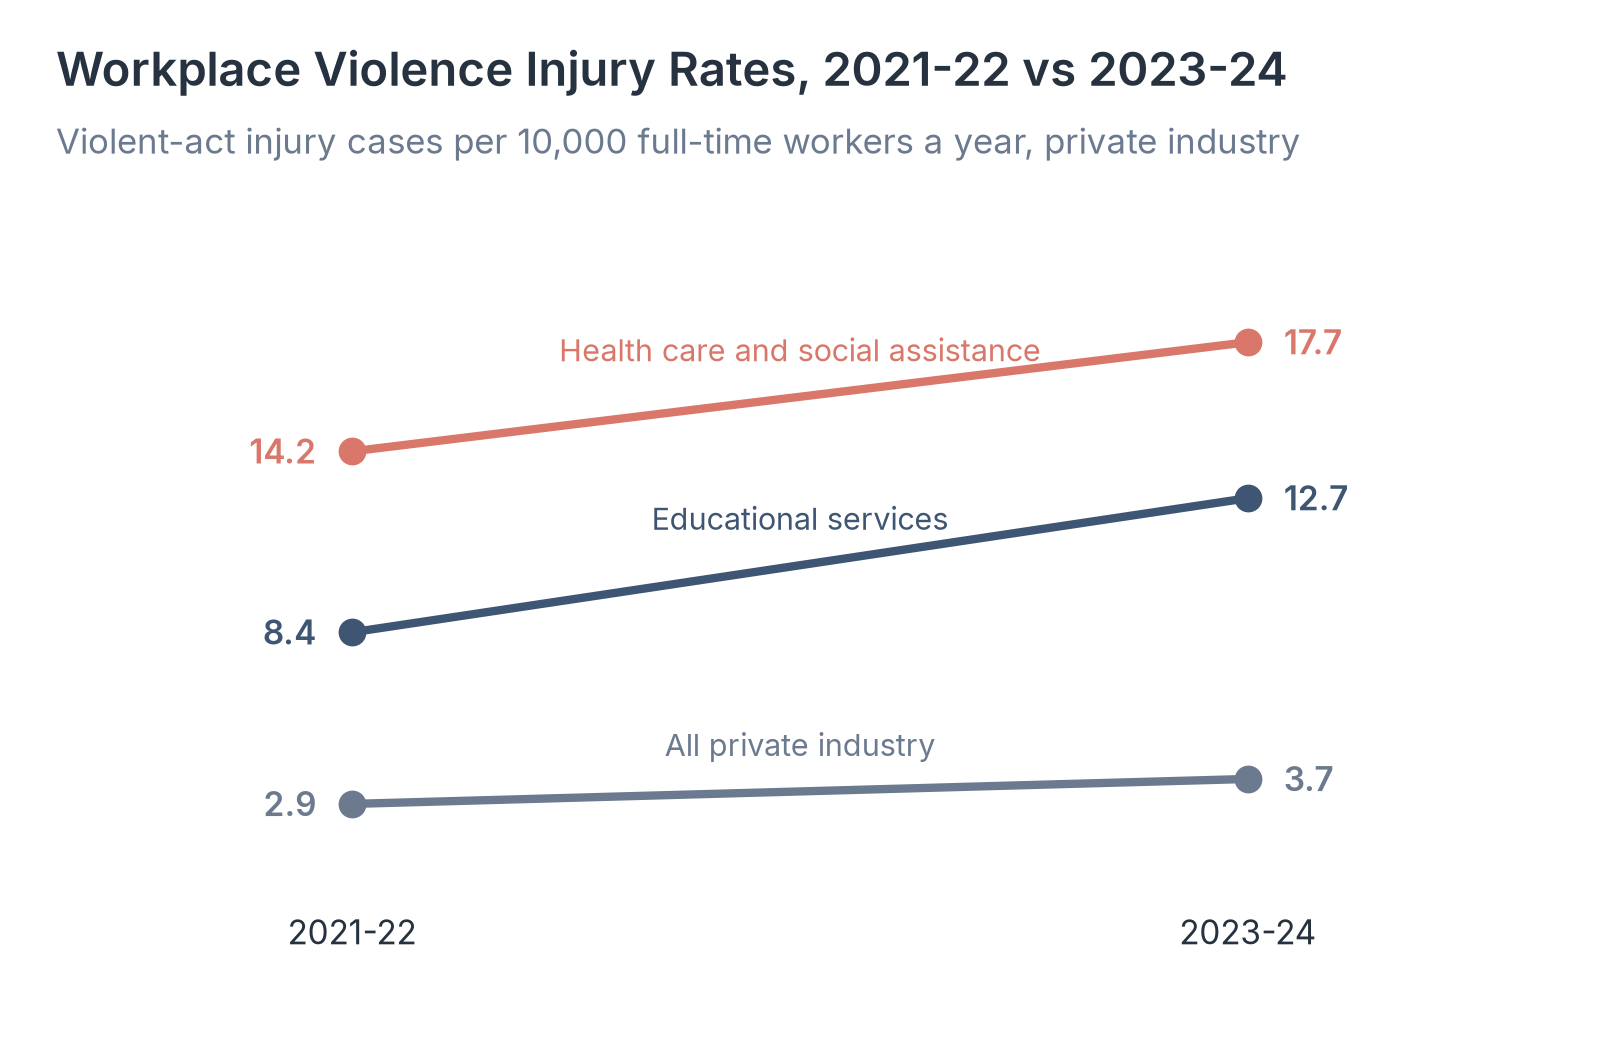
- The health care and social assistance rate rose from 14.2 in 2021-22 to 17.7 in 2023-24, under a revised injury coding system.
Health care is the private industry where workers are most often hurt by violence on the job. In its 2021-22 fact sheet, the Bureau of Labor Statistics (BLS) found that health care and social assistance had the highest count and rate of workplace violence injuries of any private industry sector. Women made up 78.2% of the sector's workers, and across all private industry they were hurt by workplace violence at more than three times the rate of men, 5.0 cases per 10,000 full-time workers against 1.4. In January 2026, BLS published the same detail for 2023 and 2024. We wanted to see whether the pattern held and where inside health care the risk is highest.
Our analysts used the BLS Survey of Occupational Injuries and Illnesses case and demographic tables for 2023-24. We pulled counts and rates of violent-act injuries by detailed industry from tables R4 and R8, by occupation from tables R12 and R100, and by length of time away from work from table R70. The figures cover private employers only and count cases that led to days away from work, restricted duty, or a job transfer. Rates are annual averages per 10,000 full-time workers.
In the following sections, we compare health care with other industries, rates in hospitals, nursing homes, and other care settings, the health care jobs with the highest rates, the change from 2021-22, and how long injured workers stay off the job.
How Health Care Compares With Other Industries
A comparison across industries shows whether health care workers face more violence than other workers or simply make up a large part of the workforce. Rates adjust for the number of people in each industry, so they are the fairer comparison.
| Industry | Cases, 2023-24 | Rate per 10,000 full-time workers | Share of all injury cases |
|---|---|---|---|
| Health care and social assistance | 55,980 | 17.7 | 10.0% |
| Educational services | 5,530 | 12.7 | 15.8% |
| Administrative and waste services | 3,430 | 3.1 | 2.7% |
| Retail trade | 4,660 | 2.1 | 1.1% |
| Arts, entertainment, and recreation | 520 | 1.8 | 0.8% |
| Transportation and warehousing | 1,860 | 1.6 | 0.4% |
| Accommodation and food services | 2,850 | 1.6 | 1.3% |
| Management of companies | 500 | 1.0 | 3.4% |
| Real estate and rental and leasing | 350 | 0.8 | 0.8% |
| Other services | 320 | 0.5 | 0.5% |
| Agriculture, forestry, fishing, and hunting | 80 | 0.4 | 0.2% |
| Information | 150 | 0.3 | 0.5% |
| Construction | 400 | 0.3 | 0.2% |
| Manufacturing | 600 | 0.2 | 0.1% |
| Wholesale trade | 260 | 0.2 | 0.1% |
| Professional and technical services | 490 | 0.2 | 0.9% |
| All private industry | 78,340 | 3.7 | 2.6% |
Source: US Bureau of Labor Statistics, Survey of Occupational Injuries and Illnesses, case and demographic tables for 2023-24 (tables R4 and R8), January 2026. Cases cover the two years combined; rates are annual.
Source: Healthcare Industry Reviews analysis of US Bureau of Labor Statistics Survey of Occupational Injuries and Illnesses tables for 2023-24, January 2026.
Key Findings
- Violent acts caused 10.0% of all injury cases with time off or restricted duty in health care and social assistance, compared with 2.6% across private industry. Put another way, about one in ten health care injuries serious enough to need time off or restricted duty came from a violent act.
- Educational services had the second-highest rate at 12.7, and no other sector reached the private-industry rate of 3.7. Together, health care and education accounted for 78.5% of all violent-act injury cases.
- Because health care makes up such a large share of these injuries, national workplace violence figures mostly describe what happens in hospitals, nursing homes, and other care settings. Employers outside health care get a more useful benchmark from their own sector's row in the table.
Workplace Violence Rates in Hospitals, Nursing Homes, and Other Care Settings
Health care covers very different workplaces, from physician offices and home health visits to inpatient psychiatric units. We broke the sector into its main settings to see where violence is concentrated.
| Setting | Cases, 2023-24 | Rate per 10,000 full-time workers | Share of all injury cases |
|---|---|---|---|
| Ambulatory health care services | 5,970 | 4.6 | 5.7% |
| Home health care services | 1,070 | 4.8 | 4.2% |
| Outpatient care centers | 1,230 | 7.2 | 5.7% |
| Ambulance services | 300 | 10.9 | 2.6% |
| Offices of physicians | 760 | 1.6 | 3.6% |
| Hospitals | 22,640 | 27.2 | 12.4% |
| General medical and surgical hospitals | 17,260 | 22.4 | 10.4% |
| Psychiatric and substance abuse hospitals | 4,590 | 204.6 | 55.2% |
| Specialty hospitals | 800 | 20.4 | 8.6% |
| Nursing and residential care facilities | 20,610 | 41.6 | 10.3% |
| Nursing care facilities | 5,610 | 25.7 | 5.3% |
| Residential mental health, disability, and substance use facilities | 9,350 | 84.6 | 30.3% |
| Assisted living and continuing care communities | 2,960 | 21.0 | 5.3% |
| Other residential care facilities | 2,680 | 103.9 | 40.0% |
| Social assistance | 6,750 | 12.7 | 9.5% |
Source: US Bureau of Labor Statistics, Survey of Occupational Injuries and Illnesses, case and demographic tables for 2023-24 (tables R4 and R8), January 2026. Indented rows are part of the setting above them.
Source: Healthcare Industry Reviews analysis of US Bureau of Labor Statistics Survey of Occupational Injuries and Illnesses tables for 2023-24, January 2026.
Key Findings
- Hospitals had 22,640 violent-act injury cases and nursing and residential care facilities had 20,610, together 77.3% of the health care and social assistance total. Nursing and residential care had the higher rate, 41.6 against 27.2 for hospitals.
- Psychiatric and substance abuse hospitals had the highest rate at 204.6, followed by other residential care facilities at 103.9 and residential facilities for people with intellectual and developmental disabilities, mental illness, or substance use disorders at 84.6. These three settings had 16,620 cases, 29.7% of the sector total.
- General medical and surgical hospitals had a rate of 22.4, about six times the private-industry rate, and 17,260 cases, the most of any single setting. That rate is lower than on psychiatric units but above the rate of every other private industry sector.
Which Health Care Jobs Face the Highest Rates of Violence
Injury risk also depends on the job a person does, since aides, nurses, technicians, and emergency crews spend their shifts in different kinds of contact with patients. We compared the main direct-care occupations, counting injuries to people in these jobs across all private employers.
| Occupation | Cases, 2023-24 | Rate per 10,000 full-time workers | Share of all injury cases |
|---|---|---|---|
| Psychiatric aides | 1,660 | 640.6 | 63.8% |
| Psychiatric technicians | 6,840 | 403.9 | 54.9% |
| Nursing assistants | 10,520 | 54.8 | 9.9% |
| Emergency medical technicians | 520 | 25.2 | 5.7% |
| Registered nurses | 8,610 | 20.1 | 11.3% |
| Home health and personal care aides | 9,180 | 16.6 | 14.3% |
| Licensed practical and vocational nurses | 1,230 | 14.0 | 6.0% |
Source: US Bureau of Labor Statistics, Survey of Occupational Injuries and Illnesses, case and demographic tables for 2023-24 (tables R12 and R100), January 2026.
Source: Healthcare Industry Reviews analysis of US Bureau of Labor Statistics Survey of Occupational Injuries and Illnesses tables for 2023-24, January 2026.
Key Findings
- Psychiatric aides (640.6) and psychiatric technicians (403.9) had rates more than 100 times the private-industry rate. Violent acts caused 64% of all injury cases with time off or restricted duty among psychiatric aides and 55% among psychiatric technicians.
- Nursing assistants had 10,520 cases, the most of any health care job, at a rate of 54.8. Registered nurses had 8,610 cases at a rate of 20.1, and home health and personal care aides had 9,180 cases at 16.6.
- Aides and technicians accounted for 28,200 of the 38,560 cases across these seven jobs, nearly three times as many as registered and licensed practical nurses combined. Safety programs built around nursing staff alone would leave out most of the injured direct-care workers in these figures.
How Workplace Violence in Health Care Changed From 2021-22 to 2023-24
BLS publishes this level of detail every two years, so the 2021-22 release is the closest comparison. The agency changed its injury coding system for the 2023 data, and the older release counted injuries caused intentionally by another person, while the newer one counts violent acts, so the two periods line up closely but not exactly.
| Measure | 2021-22 | 2023-24 | Change |
|---|---|---|---|
| All private industry, cases | 57,610 | 78,340 | +36.0% |
| All private industry, rate | 2.9 | 3.7 | +0.8 |
| Health care and social assistance, cases | 41,960 | 55,980 | +33.4% |
| Health care and social assistance, rate | 14.2 | 17.7 | +3.5 |
| Health care and social assistance, share of all cases | 72.8% | 71.5% | -1.3 points |
| Educational services, rate | 8.4 | 12.7 | +4.3 |
| Psychiatric aides, rate | 543.6 | 640.6 | +97.0 |
Source: US Bureau of Labor Statistics, Workplace Violence 2021-2022 fact sheet. US Bureau of Labor Statistics, Survey of Occupational Injuries and Illnesses, case and demographic tables for 2023-24 (tables R4, R8, and R100), January 2026.
Source: Healthcare Industry Reviews analysis of US Bureau of Labor Statistics Survey of Occupational Injuries and Illnesses tables for 2023-24, January 2026.
Key Findings
- Violent-act injury cases in health care and social assistance rose 33% between the two periods, from 41,960 to 55,980, and the rate rose from 14.2 to 17.7. Cases across all private industry rose 36%, so health care's share of the total stayed close to seven in ten.
- The rate for psychiatric aides rose from 543.6 to 640.6 per 10,000 full-time workers. Educational services rose from 8.4 to 12.7, a larger increase than in health care.
- In 2023-24, 67.5% of health care's violent-act injury cases led to at least one day away from work, compared with 69.0% in 2021-22. The next BLS release, covering 2025 and 2026, will show whether the higher rates continue under the new coding system.
How Long Workers Stay Off the Job After a Violent Injury
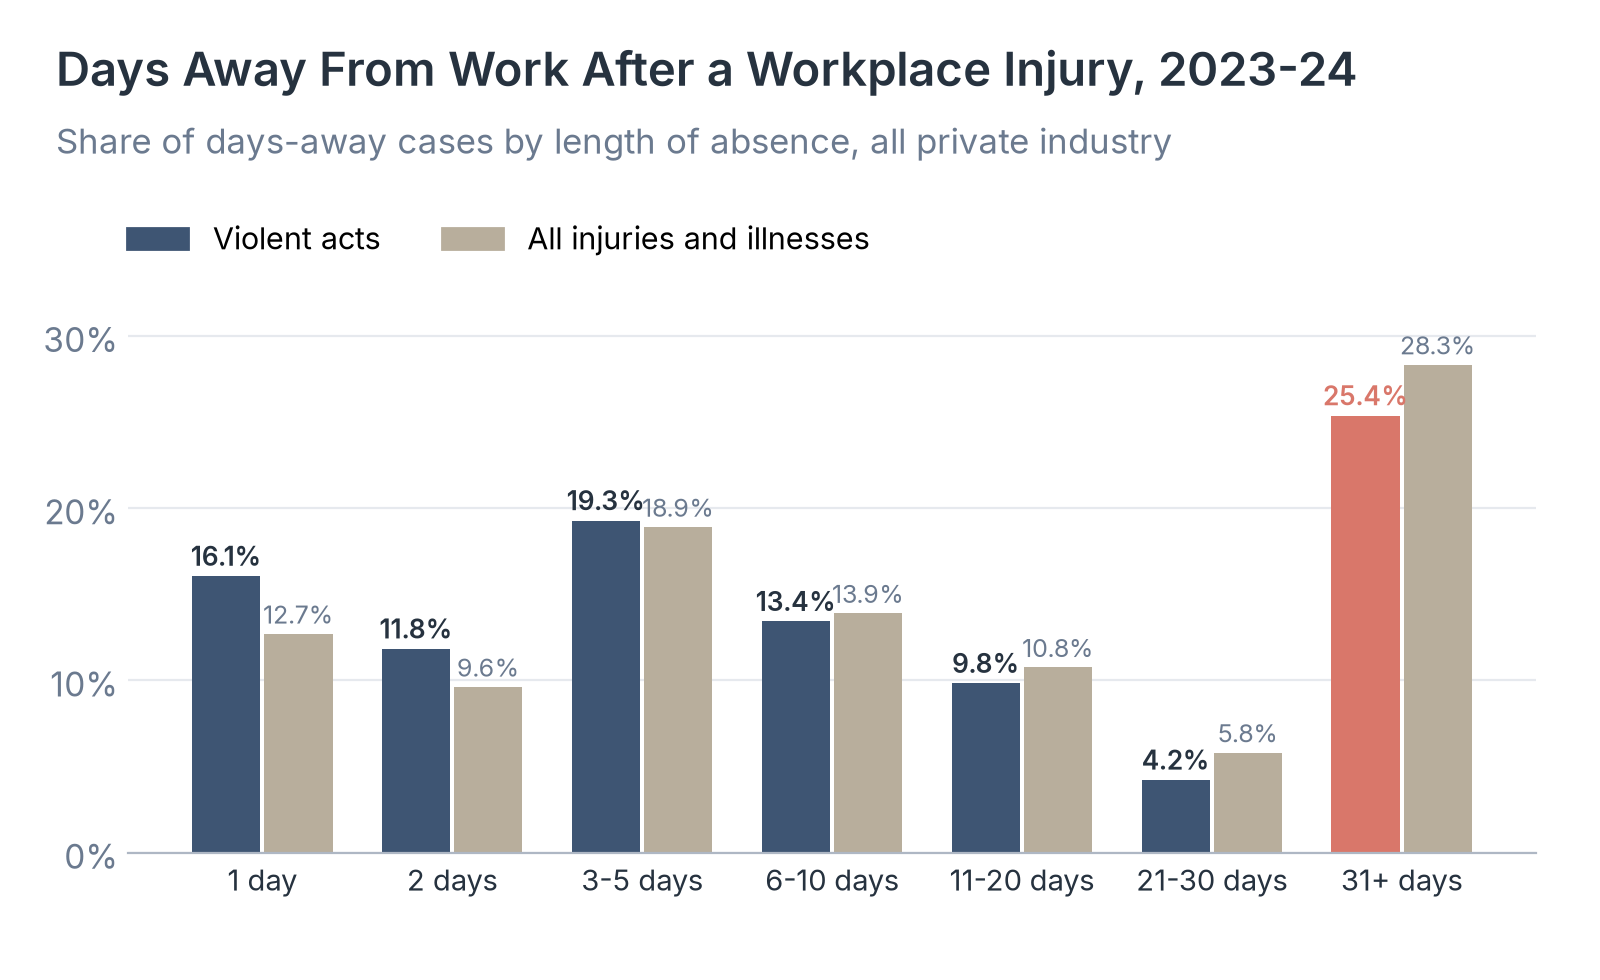
Time away from work is the clearest measure of how badly a worker was hurt, and it is a direct cost for employers who have to cover the shift. BLS reports the length of absence by type of injury for all private industry, and health care accounts for most of the violent-act cases in these figures.
| Days away | Violent-act cases | Share of violent-act cases | Share of all injury and illness cases |
|---|---|---|---|
| 1 day | 8,750 | 16.1% | 12.7% |
| 2 days | 6,450 | 11.8% | 9.6% |
| 3 to 5 days | 10,510 | 19.3% | 18.9% |
| 6 to 10 days | 7,320 | 13.4% | 13.9% |
| 11 to 20 days | 5,360 | 9.8% | 10.8% |
| 21 to 30 days | 2,300 | 4.2% | 5.8% |
| 31 or more days | 13,830 | 25.4% | 28.3% |
| Median days away | 6 | 8 |
Source: US Bureau of Labor Statistics, Survey of Occupational Injuries and Illnesses, case and demographic tables for 2023-24 (table R70), January 2026. Median days also from BLS Table 2. Case counts are rounded by BLS and may not add to the total.
Source: Healthcare Industry Reviews analysis of US Bureau of Labor Statistics Survey of Occupational Injuries and Illnesses tables for 2023-24, January 2026.
Key Findings
- 13,830 violent-act injury cases, 25.4% of those with time away, kept workers off the job for 31 days or more in 2023-24. The median absence after a violent injury was 6 days, compared with 8 days for all injuries and illnesses.
- Violent injuries were more likely than other injuries to involve a short absence: 27.9% of violent-act cases with time away lasted one or two days, compared with 22.3% for all cases. Cases with only restricted duty or a job transfer had a median of 13 days for violent acts, according to BLS.
- Health care had 37,760 violent-act cases with days away from work over the two years. If they follow the all-industry pattern, an estimated 9,600 of them kept a worker off the job for a month or more.
What Healthcare Workplace Violence Statistics Mean for Care Teams
For the people who work in health care, the numbers describe a job risk that most other workers rarely face. A psychiatric aide is hurt by violence at about five times the rate of a correctional officer, 640.6 against 129.4 per 10,000 full-time workers, and nursing assistants and registered nurses together had 19,130 cases in two years.
The 2023-24 figures show violence injuries rising in health care at about the same pace as in private industry overall, after a change in how BLS codes them. The federal series counts only injuries serious enough to require time off or restricted duty, at private employers, so it leaves out public hospitals and the many incidents that do not lead to time away.
So if you cite a healthcare workplace violence rate, give the setting or job it describes, because the 2023-24 rate ranges from 1.6 per 10,000 full-time workers in physician offices to 640.6 for psychiatric aides.
Data Collection and Methodology
All 2023-24 figures come from the US Bureau of Labor Statistics (BLS) Survey of Occupational Injuries and Illnesses (SOII) biennial case and demographic tables for calendar years 2023 and 2024, last modified January 22, 2026, which we downloaded and analyzed on November 3, 2026. We used table R4 (number of cases by detailed industry and event or exposure), table R8 (annualized incidence rates by detailed industry and event), table R12 (number by detailed occupation and event), table R100 (rates by detailed occupation and event), and table R70 (cases by event and number of days away from work). Median days come from BLS Table 2 for 2023-24.
The figures count nonfatal cases that involved days away from work, restricted work activity, or a job transfer (DART cases) at private employers. They do not include state and local government workers, so public hospitals are not covered, and they do not include incidents that did not lead to time away or restricted duty. Case counts are totals for the two years combined, rounded by BLS. Rates are annualized incidence rates per 10,000 full-time workers. "Violent acts" is the event category in BLS's Occupational Injury and Illness Classification System version 3, used for the 2023 data onward. Occupation figures count workers in each job across all private industries. Industry codes follow the North American Industry Classification System. Sectors where BLS did not publish a violent-act figure (utilities, mining, and finance and insurance) are not shown, and only occupations with at least 500 violent-act cases are shown in the occupation table.
The 2021-22 comparison figures come from the BLS Workplace Violence 2021-2022 fact sheet, which counted DART cases due to intentional injury by other person under the earlier coding system, so the change between periods is approximate. The days-away distribution covers all private industry; BLS does not publish it for health care alone in these tables. We calculated products, differences, and ratios from the published values.
Sources
- Healthcare Industry Reviews, Healthcare Workplace Violence Study: analysis of BLS Survey of Occupational Injuries and Illnesses tables for 2023-24 covering 2,983,110 private-industry injury and illness cases, including 78,340 violent-act cases, by industry, health care setting, occupation, and days away from work, compared with 2021-22, conducted November 2026.
- US Bureau of Labor Statistics. Biennial Case and Demographic Characteristics for Work-related Injuries and Illnesses Involving Days Away From Work, Restricted Activity, or Job Transfer, Calendar Year 2023-2024 Survey Results. January 22, 2026. Tables R4, R8, R12, R100, and R70.
- US Bureau of Labor Statistics. Number, annualized incidence rate, and median days of nonfatal occupational injuries and illnesses involving DART, DAFW, and DJTR by selected event or exposure, private industry, 2023-24 (Table 2).
- US Bureau of Labor Statistics. Workplace Violence 2021-2022. Fact sheet.