Home Health Agency Statistics: 2026 Report
Published
Our analysts reviewed MedPAC data on Medicare home health agencies, patients, payments, and margins from 2019 to 2024, then counted all 12,409 agencies in the October 2026 CMS file by state, ownership, services, and star rating to show how many home health agencies operate in the US, who owns them, and how they perform, as of Q4 2026.
Key Findings
- 12,234 home health agencies participated in Medicare in 2024, up 7.7% from 2019, while the number outside California fell 5.1%.
- California had 3,196 certified home health agencies in October 2026, 25.8% of the national total and 46.3 per 100,000 residents aged 65 and older, against a national rate of 19.1.
- Medicare paid home health agencies $16.0 billion for 2.7 million fee-for-service patients in 2024, and payment per visit rose 36.1% from 2019 while in-person visits per 30-day period fell from 10.2 to 8.4.
- Freestanding home health agencies earned a 21.2% Medicare margin in 2024, and MedPAC has recommended a 7% cut to the 2026 base payment rate for 2027.
- Of 8,126 agencies with a CMS quality of patient care rating, 34.7% earned 4 stars or more, and the average rating was 3.25 stars.
Home health agencies send nurses, therapists, and aides to treat patients in their homes, many of them older adults covered by Medicare. Medicare covers this care for patients who are homebound and need skilled nursing or therapy, with no copayment or deductible, and pays agencies a set amount for each 30-day period of care, adjusted for the patient's condition.2 The number of agencies has grown since 2019, but nearly all of that growth has come from one state, and Medicare now pays more for each visit while patients receive fewer visits.
Our analysts compiled MedPAC's March 2026 figures on Medicare home health agencies, users, visits, payments, and profit margins for 2019 through 2024.2 We then counted all 12,409 agencies in the CMS October 2026 home health agency file by state, ownership, services offered, and quality star rating, and divided each state's count by its population aged 65 and older from Census Bureau estimates.3,4
In the following sections, we cover the number of agencies, where they are located, who owns them and what they offer, how many patients they serve and what Medicare pays them, how profitable they are, and how they score on quality.
How Many Home Health Agencies Participate in Medicare
The count of Medicare-certified agencies is the standard measure of supply. Because one state now drives the national trend, we show California and the rest of the country separately.
| Year | All agencies | Agencies outside California | Agencies in California | California share |
|---|---|---|---|---|
| 2019 | 11,356 | 9,823 | 1,533 | 13.5% |
| 2020 | 11,386 | 9,691 | 1,695 | 14.9% |
| 2021 | 11,506 | 9,665 | 1,841 | 16.0% |
| 2022 | 11,657 | 9,257 | 2,400 | 20.6% |
| 2023 | 12,057 | 9,412 | 2,645 | 21.9% |
| 2024 | 12,234 | 9,320 | 2,914 | 23.8% |
Source: Medicare Payment Advisory Commission (MedPAC), Report to the Congress: Medicare Payment Policy, Chapter 8, Home Health Care Services, March 2026.
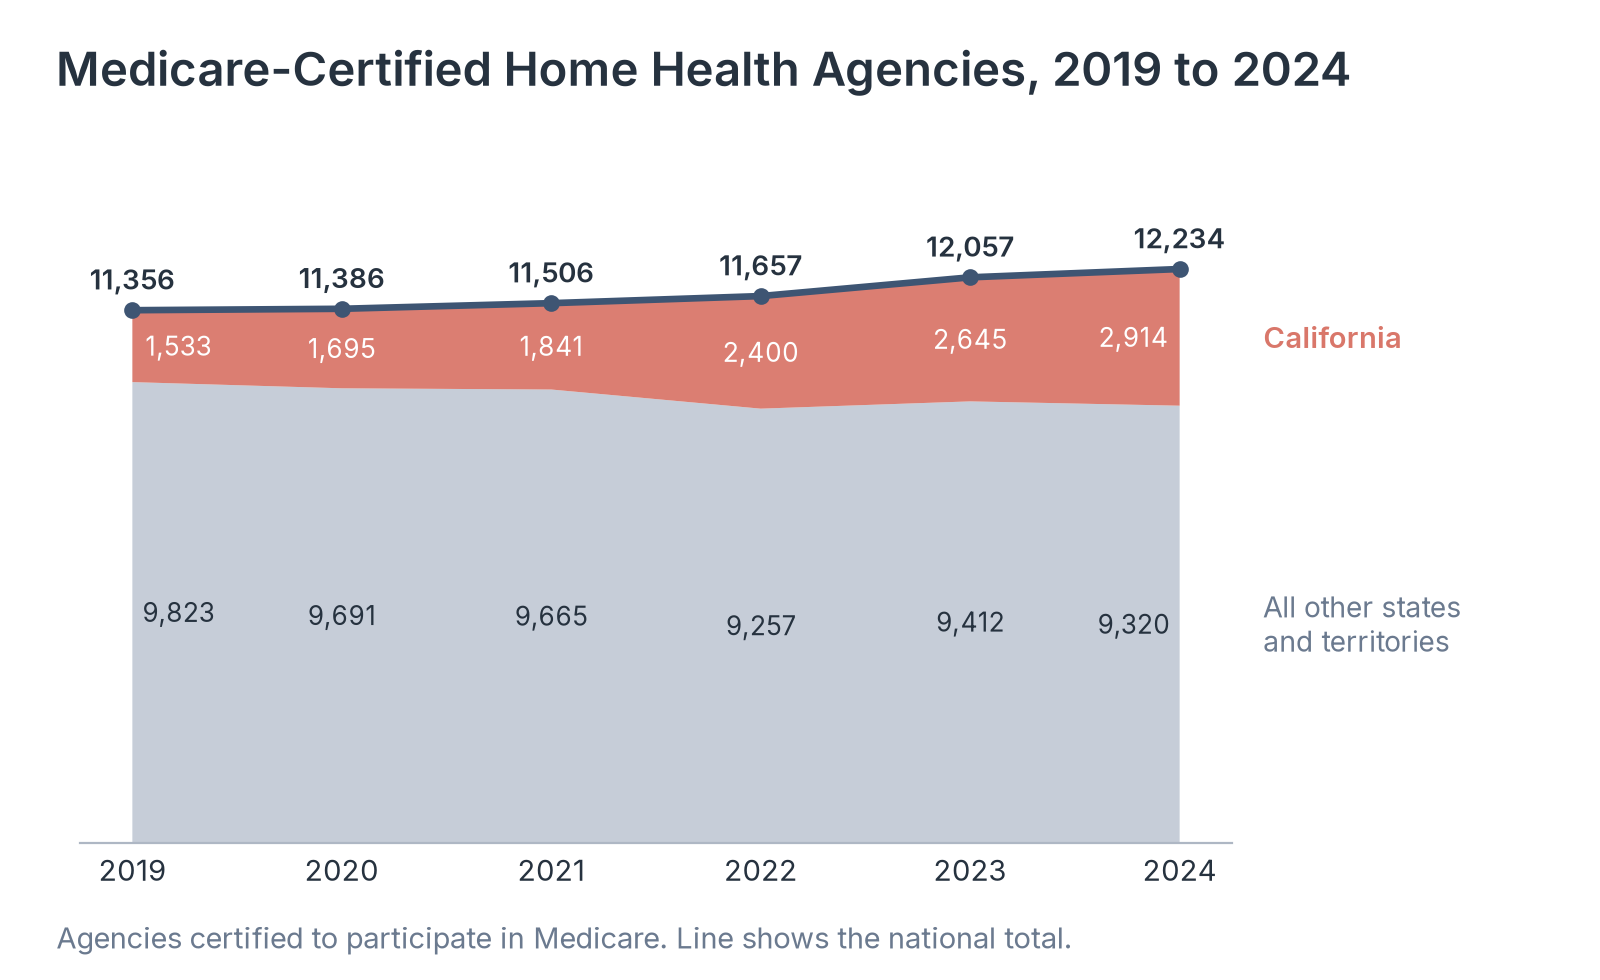
Source: Healthcare Industry Reviews analysis of MedPAC home health agency data, conducted November 2026.
Key Findings
- The number of agencies in California rose 90.1% from 2019 to 2024, to 2,914, while agencies in the rest of the country fell 5.1%, to 9,320. MedPAC reported that the highest growth was in Los Angeles County.
- In 2024, Los Angeles County accounted for $1.4 billion, about 9% of Medicare fee-for-service home health spending, with about 2% of fee-for-service beneficiaries. About 16% of fee-for-service beneficiaries in the county used home health care, more than double the national average.
- Without California, the national agency count would show a steady decline, so national growth figures say little about access in most states. MedPAC cited the California state auditor and other stakeholders who say agency growth in Los Angeles County raises program integrity concerns.
Where Home Health Agencies Are Located
Most home health patients are 65 or older, so we compared each state's count of certified agencies with its population in that age group.
| State | Rank | Agencies, October 2026 | Residents aged 65 and older, 2025 | Agencies per 100,000 residents aged 65 and older |
|---|---|---|---|---|
| California | 1 | 3,196 | 6,901,168 | 46.3 |
| Texas | 2 | 1,831 | 4,711,381 | 38.9 |
| Nevada | 3 | 227 | 599,211 | 37.9 |
| District of Columbia | 4 | 34 | 94,423 | 36.0 |
| Ohio | 5 | 826 | 2,398,129 | 34.4 |
| Oklahoma | 6 | 211 | 741,085 | 28.5 |
| Wyoming | 7 | 31 | 121,648 | 25.5 |
| Illinois | 8 | 531 | 2,379,145 | 22.3 |
| Colorado | 9 | 228 | 1,029,188 | 22.2 |
| Florida | 10 | 1,157 | 5,346,788 | 21.6 |
| Louisiana | 11 | 176 | 868,225 | 20.3 |
| Massachusetts | 12 | 287 | 1,421,793 | 20.2 |
| Iowa | 13 | 123 | 649,656 | 18.9 |
| Kansas | 14 | 104 | 561,319 | 18.5 |
| Michigan | 15 | 370 | 2,076,467 | 17.8 |
| Utah | 16 | 81 | 460,179 | 17.6 |
| Nebraska | 17 | 61 | 368,331 | 16.6 |
| New Mexico | 18 | 70 | 448,253 | 15.6 |
| Arkansas | 19 | 91 | 591,966 | 15.4 |
| Pennsylvania | 20 | 415 | 2,799,790 | 14.8 |
| Virginia | 21 | 237 | 1,633,891 | 14.5 |
| North Dakota | 22 | 20 | 143,139 | 14.0 |
| Indiana | 23 | 173 | 1,284,435 | 13.5 |
| Idaho | 24 | 49 | 379,157 | 12.9 |
| Alaska | 25 | 15 | 116,192 | 12.9 |
| South Dakota | 26 | 23 | 181,082 | 12.7 |
| Minnesota | 27 | 138 | 1,113,573 | 12.4 |
| Alabama | 28 | 116 | 1,009,814 | 11.5 |
| Arizona | 29 | 178 | 1,571,773 | 11.3 |
| West Virginia | 30 | 43 | 398,189 | 10.8 |
| Kentucky | 31 | 88 | 868,019 | 10.1 |
| Missouri | 32 | 118 | 1,230,134 | 9.6 |
| Connecticut | 33 | 72 | 751,845 | 9.6 |
| Rhode Island | 34 | 22 | 233,061 | 9.4 |
| Tennessee | 35 | 128 | 1,360,588 | 9.4 |
| Delaware | 36 | 22 | 241,321 | 9.1 |
| New Hampshire | 37 | 27 | 325,383 | 8.3 |
| Montana | 38 | 21 | 253,772 | 8.3 |
| North Carolina | 39 | 165 | 2,119,438 | 7.8 |
| Mississippi | 40 | 42 | 571,344 | 7.4 |
| Wisconsin | 41 | 87 | 1,241,547 | 7.0 |
| Vermont | 42 | 9 | 155,289 | 5.8 |
| South Carolina | 43 | 67 | 1,173,259 | 5.7 |
| Georgia | 44 | 105 | 1,884,140 | 5.6 |
| Hawaii | 45 | 18 | 324,150 | 5.6 |
| Maine | 46 | 19 | 347,617 | 5.5 |
| Oregon | 47 | 49 | 898,568 | 5.5 |
| Washington | 48 | 72 | 1,460,563 | 4.9 |
| Maryland | 49 | 51 | 1,149,859 | 4.4 |
| New York | 50 | 98 | 3,860,551 | 2.5 |
| New Jersey | 51 | 38 | 1,767,250 | 2.2 |
| United States (50 states and DC) | 12,360 | 64,617,088 | 19.1 |
Source: Centers for Medicare & Medicaid Services (CMS), Home Health Care Agencies data, Provider Data Catalog, October 2026 release; US Census Bureau, Vintage 2025 state population estimates by age and sex (civilian population).
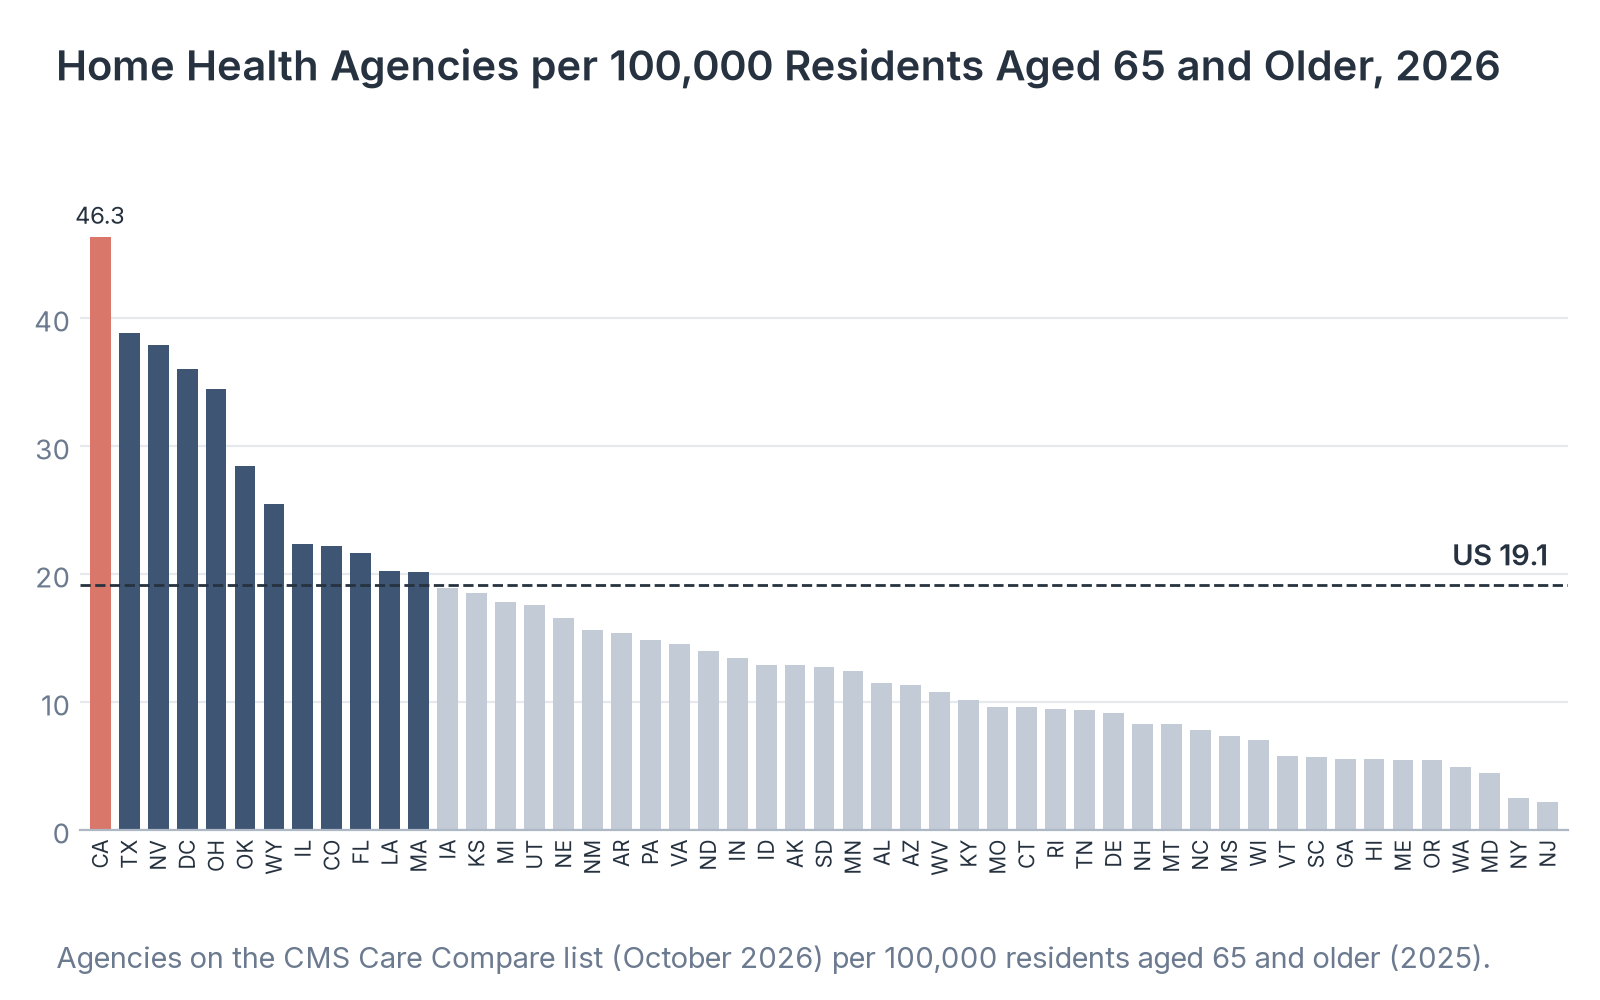
Source: Healthcare Industry Reviews analysis of CMS and Census Bureau data, conducted November 2026.
Key Findings
- California (46.3), Texas (38.9), Nevada (37.9), the District of Columbia (36.0), and Ohio (34.4) had the most agencies per 100,000 residents aged 65 and older. Texas had 1,831 agencies, the second-largest count after California.
- New Jersey (2.2), New York (2.5), Maryland (4.4), and Washington (4.9) had the fewest agencies per 100,000 residents aged 65 and older. New York had 98 agencies for 3.9 million older residents, while Ohio had 826 for 2.4 million.
- Only 12 of 51 jurisdictions were at or above the national rate of 19.1, because a few states with very large counts pull the average up. Comparisons of access between states should use agency capacity or patient counts as well as agency counts.
Who Owns Home Health Agencies and What Services They Offer
The CMS file reports each agency's ownership type and the services it offers, and those services decide which patients an agency can take.
| Category | Agencies | Share of agencies |
|---|---|---|
| Ownership: For profit | 8,954 | 72.2% |
| Ownership: Nonprofit | 1,049 | 8.5% |
| Ownership: Government | 239 | 1.9% |
| Ownership: Ownership not reported | 2,167 | 17.5% |
| Offers skilled nursing | 10,208 | 99.7% |
| Offers physical therapy | 9,768 | 95.4% |
| Offers occupational therapy | 9,347 | 91.3% |
| Offers speech pathology | 8,620 | 84.4% |
| Offers home health aide | 9,008 | 88.0% |
| Offers medical social services | 7,960 | 78.0% |
Source: Centers for Medicare & Medicaid Services (CMS), Home Health Care Agencies data, Provider Data Catalog, October 2026 release. Service shares are of agencies that reported the service as offered or not offered.
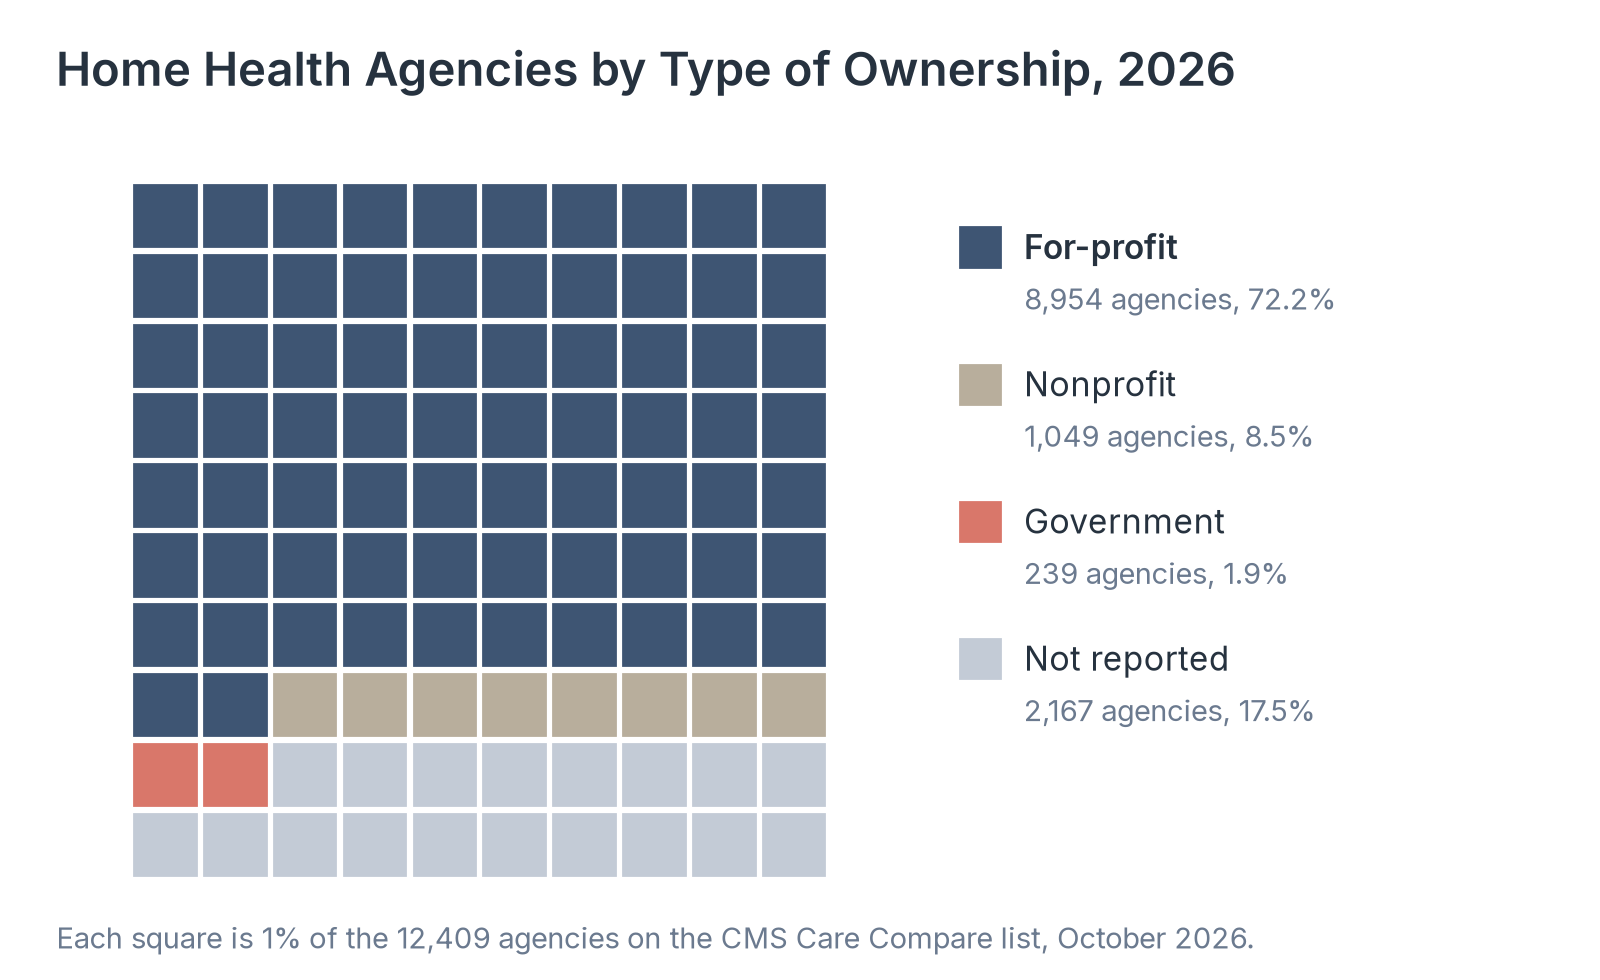
Source: Healthcare Industry Reviews analysis of CMS home health agency data, conducted November 2026.
Key Findings
- For-profit companies owned 8,954 agencies, 72.2% of all certified agencies and 87.4% of the 10,242 that reported an ownership type. Nonprofits owned 1,049 (8.5%), and governments operated 239 (1.9%).
- Almost every reporting agency (99.7%) offered skilled nursing, and 95.4% offered physical therapy. Medical social services were the least common, offered by 78.0%, followed by speech pathology at 84.4%.
- MedPAC counted for-profit agencies as 93% of freestanding agencies and 86% of 30-day periods in 2024. Patients who need speech therapy or social work at home have fewer agencies to choose from than patients who need nursing or physical therapy.
How Many Medicare Patients Use Home Health and What Medicare Pays
MedPAC tracks Medicare fee-for-service home health users, visits, and payments, which show how demand and pricing have moved since Medicare began paying agencies by 30-day period in 2020.
| Measure | 2019 | 2020 | 2021 | 2022 | 2023 | 2024 |
|---|---|---|---|---|---|---|
| Fee-for-service users (millions) | 3.3 | 3.1 | 3.0 | 2.8 | 2.7 | 2.7 |
| Share of fee-for-service beneficiaries using home health | 8.5% | 8.1% | 8.3% | 8.0% | 7.9% | 7.9% |
| Total Medicare payments (billions) | $17.9 | $17.1 | $16.9 | $16.2 | $15.9 | $16.0 |
| Payment per user | $5,437 | $5,591 | $5,587 | $5,703 | $5,839 | $6,031 |
| Payment per visit | $180 | $211 | $220 | $232 | $237 | $245 |
| In-person visits (millions) | 99.7 | 81.1 | 76.8 | 69.5 | 66.8 | 65.4 |
| Visits per full 30-day period | 10.2 | 9.2 | 8.8 | 8.6 | 8.5 | 8.4 |
| Hospital discharges going first to home health | 15.8% | 20.1% | 19.6% | 18.6% | 18.1% | 18.0% |
| Hospital discharges going first to a skilled nursing facility | 18.7% | 15.9% | 16.6% | 17.4% | 17.3% | 17.3% |
Source: Medicare Payment Advisory Commission (MedPAC), Report to the Congress: Medicare Payment Policy, Chapter 8, Home Health Care Services, March 2026. Discharge shares for 2024 cover the first 10 months of the year.
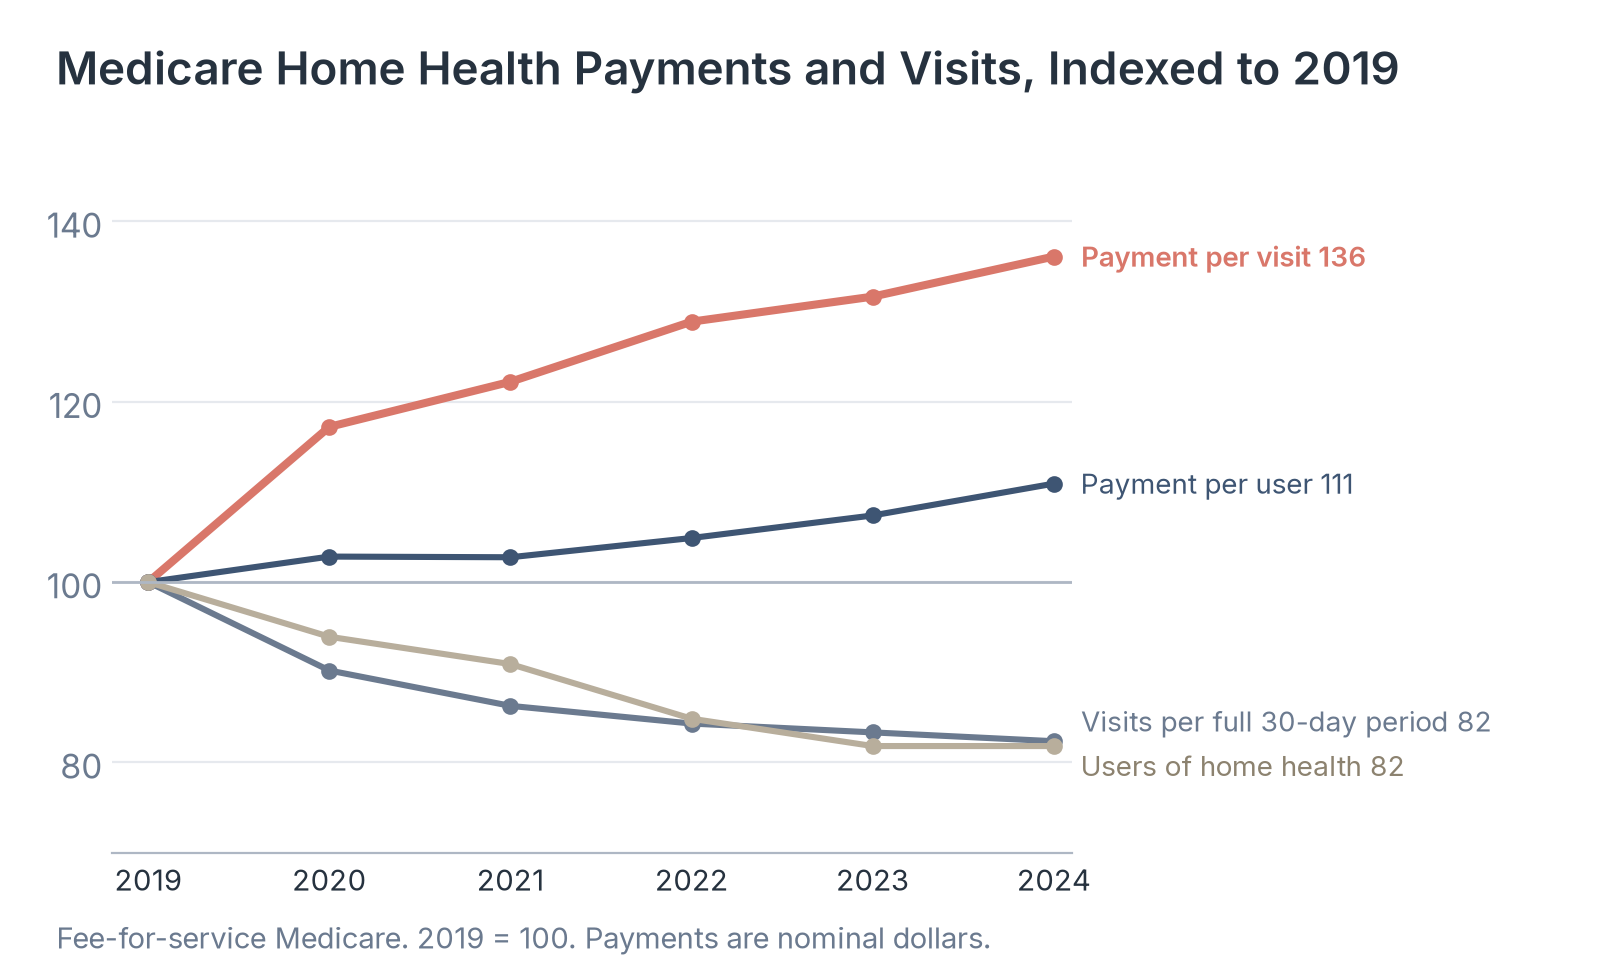
Source: Healthcare Industry Reviews analysis of MedPAC home health data, conducted November 2026.
Key Findings
- Medicare fee-for-service home health users fell from 3.3 million in 2019 to 2.7 million in 2024, and total payments fell from $17.9 billion to $16.0 billion.
- In-person visits fell 34.4%, from 99.7 million to 65.4 million, and visits per full 30-day period fell from 10.2 to 8.4. Over the same years, Medicare's payment per visit rose from $180 to $245, and payment per user rose 10.9%, to $6,031.
- Home health overtook skilled nursing facilities as the more common first setting after a hospital stay in 2020 and stayed ahead through 2024, at 18.0% of discharges against 17.3%. Agencies are therefore receiving a larger share of post-hospital patients while sending clinicians on fewer visits per patient.
How Profitable Home Health Agencies Are Under Medicare
MedPAC measures profitability as the Medicare margin, the share of Medicare payments left after an agency's Medicare costs. It reports margins by type of agency for freestanding agencies, which are not owned by a hospital or other facility and made up about 95% of agencies in 2024.
| Type of agency | 2019 | 2020 | 2021 | 2022 | 2023 | 2024 | Share of agencies, 2024 | Share of 30-day periods, 2024 |
|---|---|---|---|---|---|---|---|---|
| All agencies | 15.4% | 20.2% | 24.9% | 22.2% | 19.8% | 21.2% | 100% | 100% |
| For profit | 17.4% | 22.7% | 26.1% | 23.6% | 21.2% | 23.1% | 93% | 86% |
| Nonprofit | 11.4% | 12.4% | 20.2% | 16.4% | 13.3% | 12.2% | 7% | 14% |
| Majority urban | 16.1% | 20.0% | 24.8% | 22.3% | 20.0% | 21.3% | 86% | 87% |
| Majority rural | 14.2% | 21.6% | 25.2% | 22.0% | 18.6% | 20.5% | 14% | 13% |
| Smallest fifth by volume | 9.7% | 11.6% | 14.0% | 13.7% | 12.5% | 14.4% | 20% | 3% |
| Largest fifth by volume | 17.5% | 22.4% | 28.3% | 24.8% | 22.1% | 23.2% | 20% | 60% |
Source: Medicare Payment Advisory Commission (MedPAC), Report to the Congress: Medicare Payment Policy, Chapter 8, Home Health Care Services, March 2026. Volume fifths group agencies by number of 30-day periods.
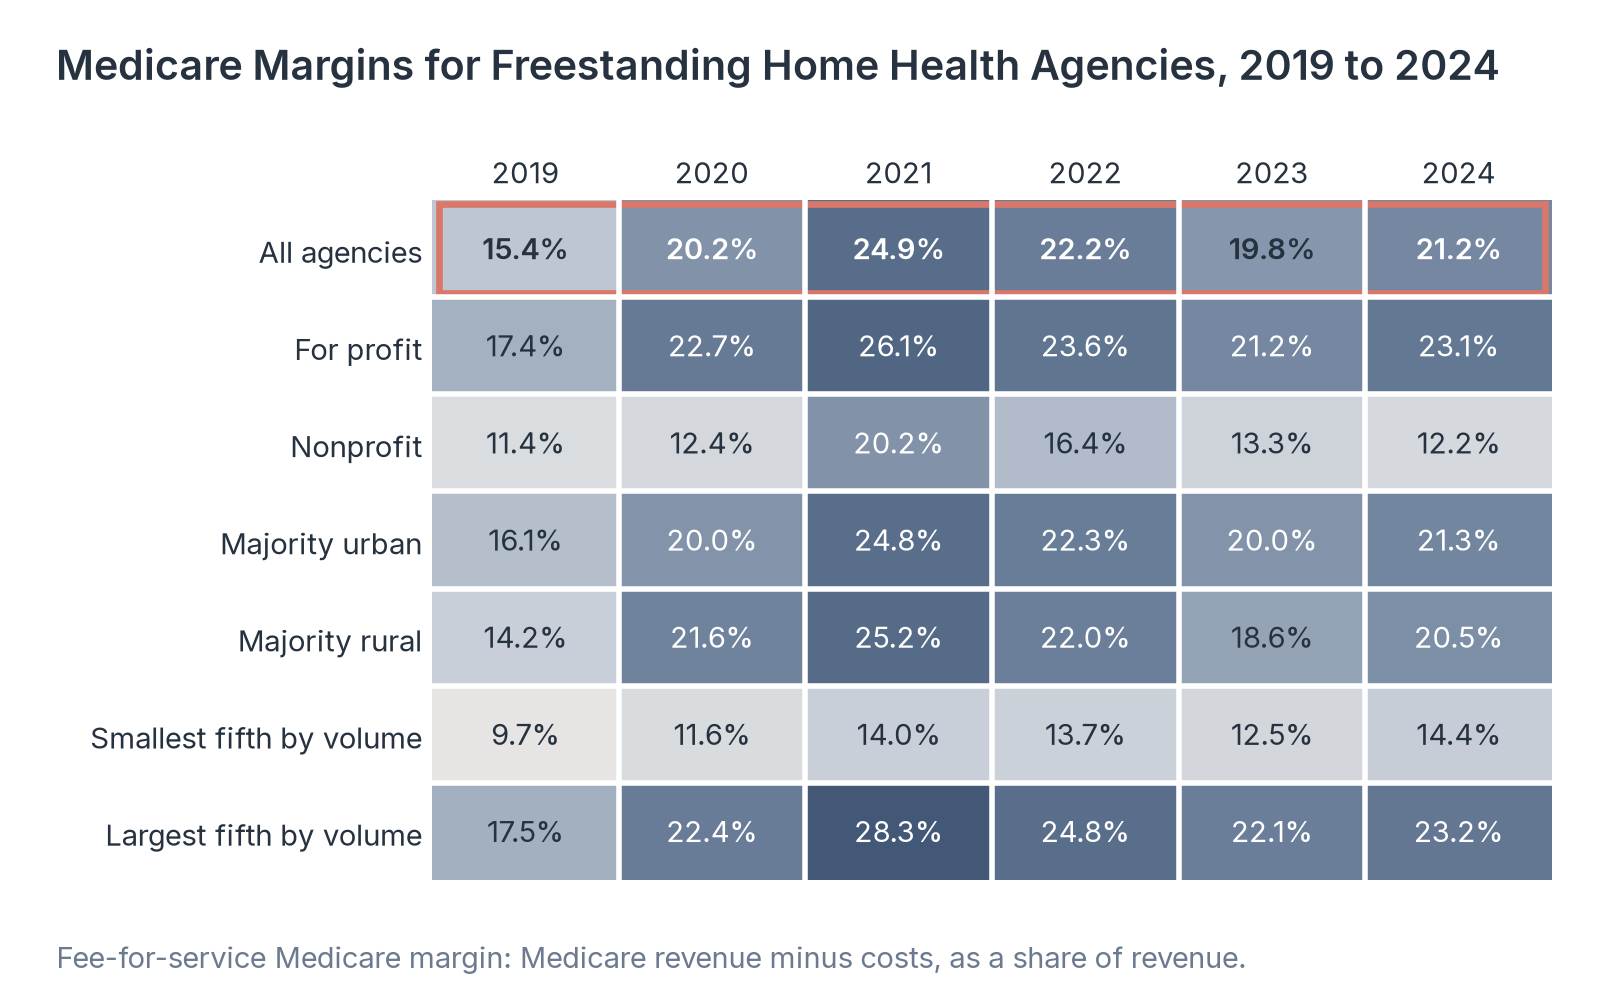
Source: Healthcare Industry Reviews analysis of MedPAC home health margin data, conducted November 2026.
Key Findings
- The Medicare margin for freestanding agencies was 21.2% in 2024, peaked at 24.9% in 2021, and has stayed above 15% in every year since 2019. MedPAC reported an average margin of 17.2% from 2001 to 2023 and projected 19% for 2026.
- For-profit agencies earned 23.1% in 2024, and nonprofits earned 12.2%. The largest fifth of agencies by volume earned 23.2% and handled 60% of 30-day periods, while the smallest fifth earned 14.4%.
- Across all payers, freestanding agencies earned 5.0% in 2024, and hospital-based agencies had a Medicare margin of -15.2%. Because Medicare payments are well above agencies' costs, MedPAC recommended that Congress cut the 2026 base payment rate by 7% for 2027.
How Home Health Agencies Score on Quality
CMS gives each agency with enough patients a quality of patient care rating from 1 to 5 stars, in half-star steps. MedPAC adds outcome measures for patients after they leave home health care.
| Rating | Agencies | Share of rated agencies |
|---|---|---|
| 1 star | 166 | 2.0% |
| 1.5 stars | 595 | 7.3% |
| 2 stars | 787 | 9.7% |
| 2.5 stars | 1,028 | 12.7% |
| 3 stars | 1,367 | 16.8% |
| 3.5 stars | 1,360 | 16.7% |
| 4 stars | 1,247 | 15.3% |
| 4.5 stars | 1,117 | 13.7% |
| 5 stars | 459 | 5.6% |
| Average rating, all rated agencies | 3.25 stars | |
| Average rating, for profit agencies | 3.27 stars | 6,071 rated |
| Average rating, nonprofit agencies | 3.36 stars | 907 rated |
| Average rating, government agencies | 2.82 stars | 199 rated |
Source: Centers for Medicare & Medicaid Services (CMS), Home Health Care Agencies data, Provider Data Catalog, October 2026 release. Agencies with too few patients for a rating are excluded.
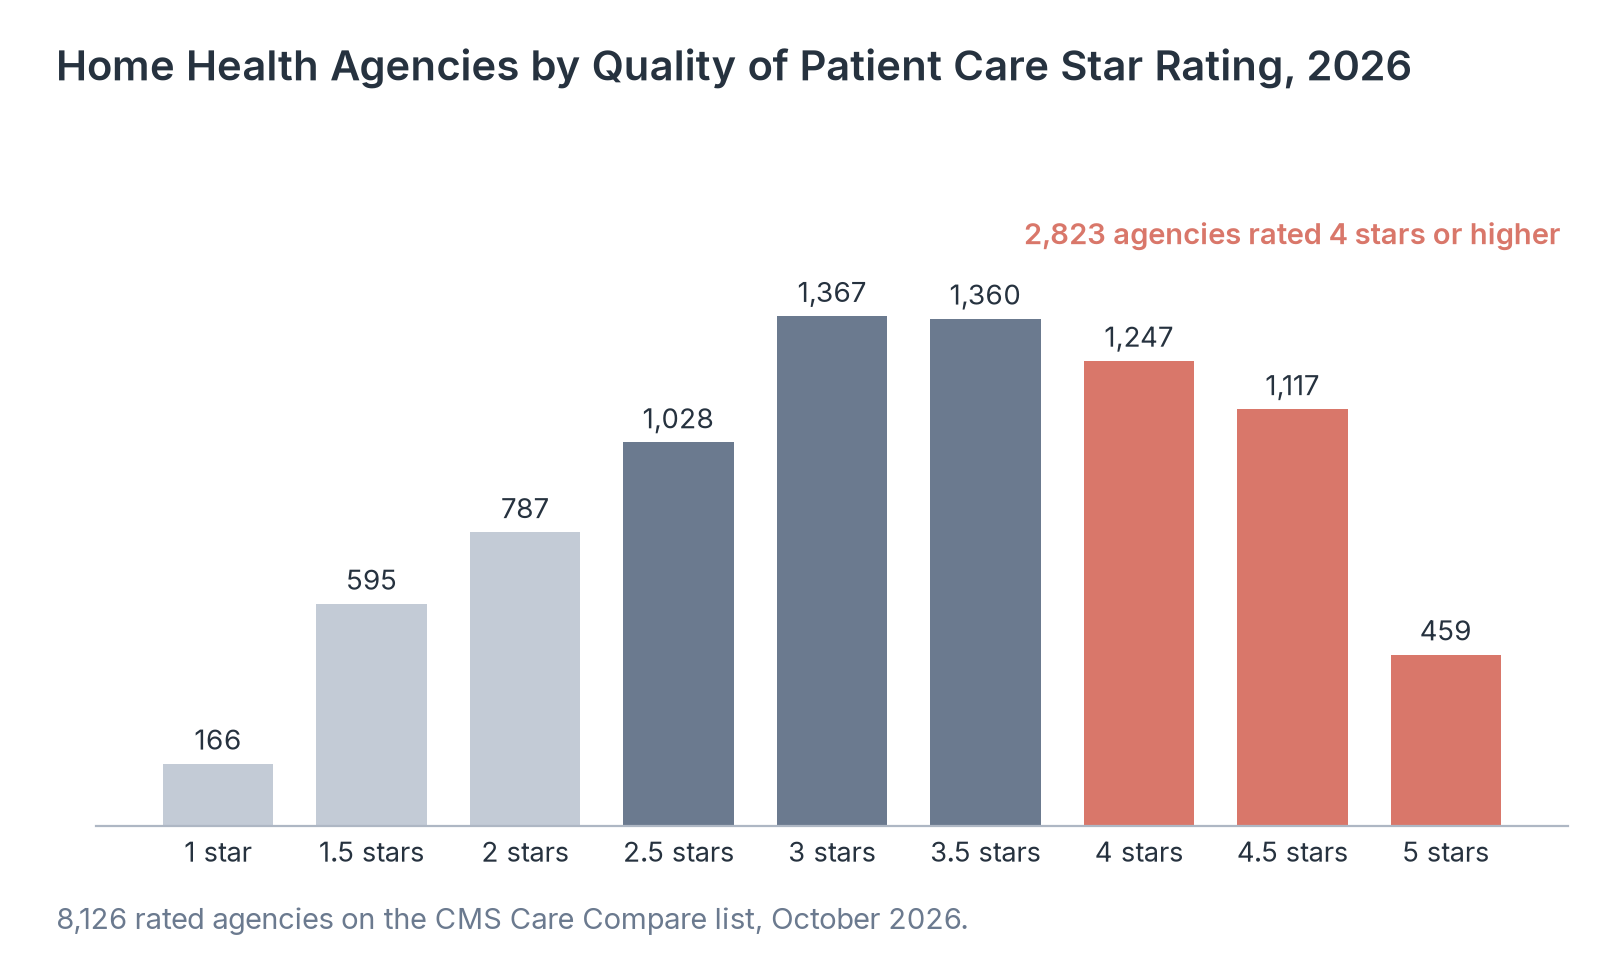
Source: Healthcare Industry Reviews analysis of CMS home health agency data, conducted November 2026.
Key Findings
- CMS rated 8,126 of 12,409 agencies (65.5%). Of those, 2,823 (34.7%) earned 4 stars or more, and 1,548 (19.0%) earned 2 stars or fewer.
- Nonprofit agencies averaged 3.36 stars, for-profit agencies 3.27, and government agencies 2.82. MedPAC reported a median risk-adjusted rate of discharge to the community of 80.6% for 2022 to 2023 and a median potentially preventable readmission rate of 3.8%.
- In patient surveys, 85% of home health patients rated their agency 9 or 10 out of 10 in 2024, and 79% said they would definitely recommend it. Families choosing an agency can compare star ratings within their area, since the spread between agencies is wider than the spread between ownership types.
What the Home Health Agency Figures Mean for Patients and Policymakers
For patients, the number of agencies in a state says little about the care they will get. In 2024, 97% of fee-for-service Medicare beneficiaries lived in a ZIP code served by two or more agencies. Outside California the agency count has slowly declined, and star ratings vary widely between agencies in the same market.
For Medicare, the figures show high payments per visit, fewer visits per patient, and margins above 20% for most of the past six years. Those numbers are the basis for MedPAC's recommended cut and for the scrutiny of agency growth in Los Angeles County.
So if you are writing about home health supply or spending, separate California from the rest of the country and use visits and payments per patient alongside agency counts, because the national totals combine two very different trends.
Data Collection and Methodology
Agency counts, users, visits, payments, discharge destinations, patient survey results, and margins for 2019 to 2024 come from MedPAC's March 2026 report, which uses Medicare cost reports, claims, and provider enrollment data. Users, visits, and payments cover Medicare fee-for-service only and exclude Medicare Advantage. Margins are fee-for-service Medicare margins for freestanding agencies, calculated as Medicare payments minus Medicare-allowable costs, divided by Medicare payments.
State, ownership, service, and star rating figures are our count of every agency in the CMS Home Health Care Agencies file released in October 2026. State rates divide agencies in the 50 states and DC by the Census Bureau's Vintage 2025 civilian population aged 65 and older; agencies in US territories are excluded from state rates but included in national totals. Ownership shares use all agencies, including those with no reported ownership type. Average star ratings use agencies with a quality of patient care rating. We calculated shares, changes, and averages from the published values.
Sources
- Healthcare Industry Reviews analysis of MedPAC home health data for 2019 to 2024, the CMS home health agency file for October 2026, and Census Bureau population estimates for 2025, conducted November 2026.
- Medicare Payment Advisory Commission. Report to the Congress: Medicare Payment Policy, Chapter 8, Home Health Care Services. March 2026.
- Centers for Medicare & Medicaid Services. Home Health Care Agencies, Provider Data Catalog. October 2026 release.
- US Census Bureau. Annual Estimates of the Civilian Population for States by Single Year of Age and Sex, Vintage 2025.