Hospital-Acquired Infection Statistics: 2026 Report
Published
Our analysts reviewed nine years of CDC infection data reported by more than 3,700 US acute care hospitals, covering seven types of hospital-acquired infections from 2016 to 2024, to show how often patients get infections in the hospital, which infections are rising or falling, and how states and hospitals compare, as of Q4 2026.
Key Findings
- On any given day, about 1 in 38 US patients and 1 in 43 nursing home residents has at least one infection linked to their health care, according to the CDC.
- US acute care hospitals reported 18,165 central line-associated bloodstream infections (CLABSIs) in 2024, 34% fewer than predicted from 2015 rates.
- C. difficile had the lowest infection ratio of any tracked type in 2024: hospitals reported 31,595 hospital-onset cases, 62.5% fewer than predicted, and the ratio fell 11% from 2023.
- Ventilator-associated events remained 10.5% above the 2015 baseline in 2024, with 26,509 events reported, after peaking at 46% above baseline in 2021.
- The infection ratio for surgical site infections after abdominal hysterectomy rose 8% from 2023 to 2024, the only tracked infection type to increase.
A hospital-acquired infection is an infection a patient picks up while being treated in a hospital for something else. Many start with a medical device. A central line placed in a large vein can let germs into the bloodstream, a urinary catheter can carry germs into the bladder and kidneys, and a breathing tube on a ventilator can lead to pneumonia.
Others follow surgery, and some come from germs such as C. difficile and MRSA. Hospitals report these infections to the CDC's National Healthcare Safety Network (NHSN), and the CDC compares each year's count with the number it would expect based on 2015 rates. Most infection types are now well below that 2015 level.
But a few are not.
Our analysts compiled national standardized infection ratios (SIRs) for seven infection types in US acute care hospitals from the CDC's yearly progress reports for 2016 to 2024, along with the 2024 counts of reported and predicted infections, state ratios, and hospital-level comparisons.2,3,4
An SIR below 1.0 means hospitals reported fewer infections than predicted from 2015 data after adjusting for patient and hospital risk factors, and an SIR above 1.0 means they reported more. The 2024 figures come from 3,739 acute care hospitals reporting CLABSI data, with similar numbers for the other infection types.
In the following sections, we cover how infection ratios have changed since 2015, which infections rose or fell in 2024, how many infections hospitals reported, how states compare with the 2015 baseline, infection ratios in each state, and how many hospitals have higher ratios than the national ratio.
How Hospital-Acquired Infection Rates Have Changed Since 2015
The CDC measures every year against the same 2015 baseline, so the yearly ratios show whether hospitals are preventing more infections over time. We tracked the national ratio for each infection type from 2016 to 2024.
| Year | CLABSI | CAUTI | VAE | MRSA | C. difficile | Colon SSI | Hysterectomy SSI |
|---|---|---|---|---|---|---|---|
| 2024 | 0.66 | 0.559 | 1.105 | 0.703 | 0.375 | 0.845 | 1.112 |
| 2023 | 0.724 | 0.621 | 1.131 | 0.755 | 0.42 | 0.879 | 1.031 |
| 2022 | 0.836 | 0.697 | 1.188 | 0.904 | 0.484 | 0.858 | 0.951 |
| 2021 | 0.921 | 0.795 | 1.461 | 1.07 | 0.501 | 0.831 | 0.993 |
| 2020 | 0.857 | 0.754 | 1.301 | 0.941 | 0.518 | 0.81 | 0.892 |
| 2019 | 0.689 | 0.741 | 0.967 | 0.817 | 0.583 | 0.855 | 0.979 |
| 2018 | 0.739 | 0.809 | 0.947 | 0.84 | 0.711 | 0.887 | 0.938 |
| 2017 | 0.814 | 0.880 | 0.952 | 0.862 | 0.804 | 0.906 | 0.89 |
| 2016 | 0.891 | 0.93 | 0.979 | 0.935 | 0.921 | 0.933 | 0.874 |
Source: CDC, National and State HAI Progress Report SIR data tables, 2016 to 2024. US acute care hospitals. The 2015 baseline ratio is 1.0. CLABSI is central line-associated bloodstream infection, CAUTI is catheter-associated urinary tract infection, VAE is ventilator-associated event, MRSA is hospital-onset methicillin-resistant Staphylococcus aureus bloodstream infection, and SSI is surgical site infection.
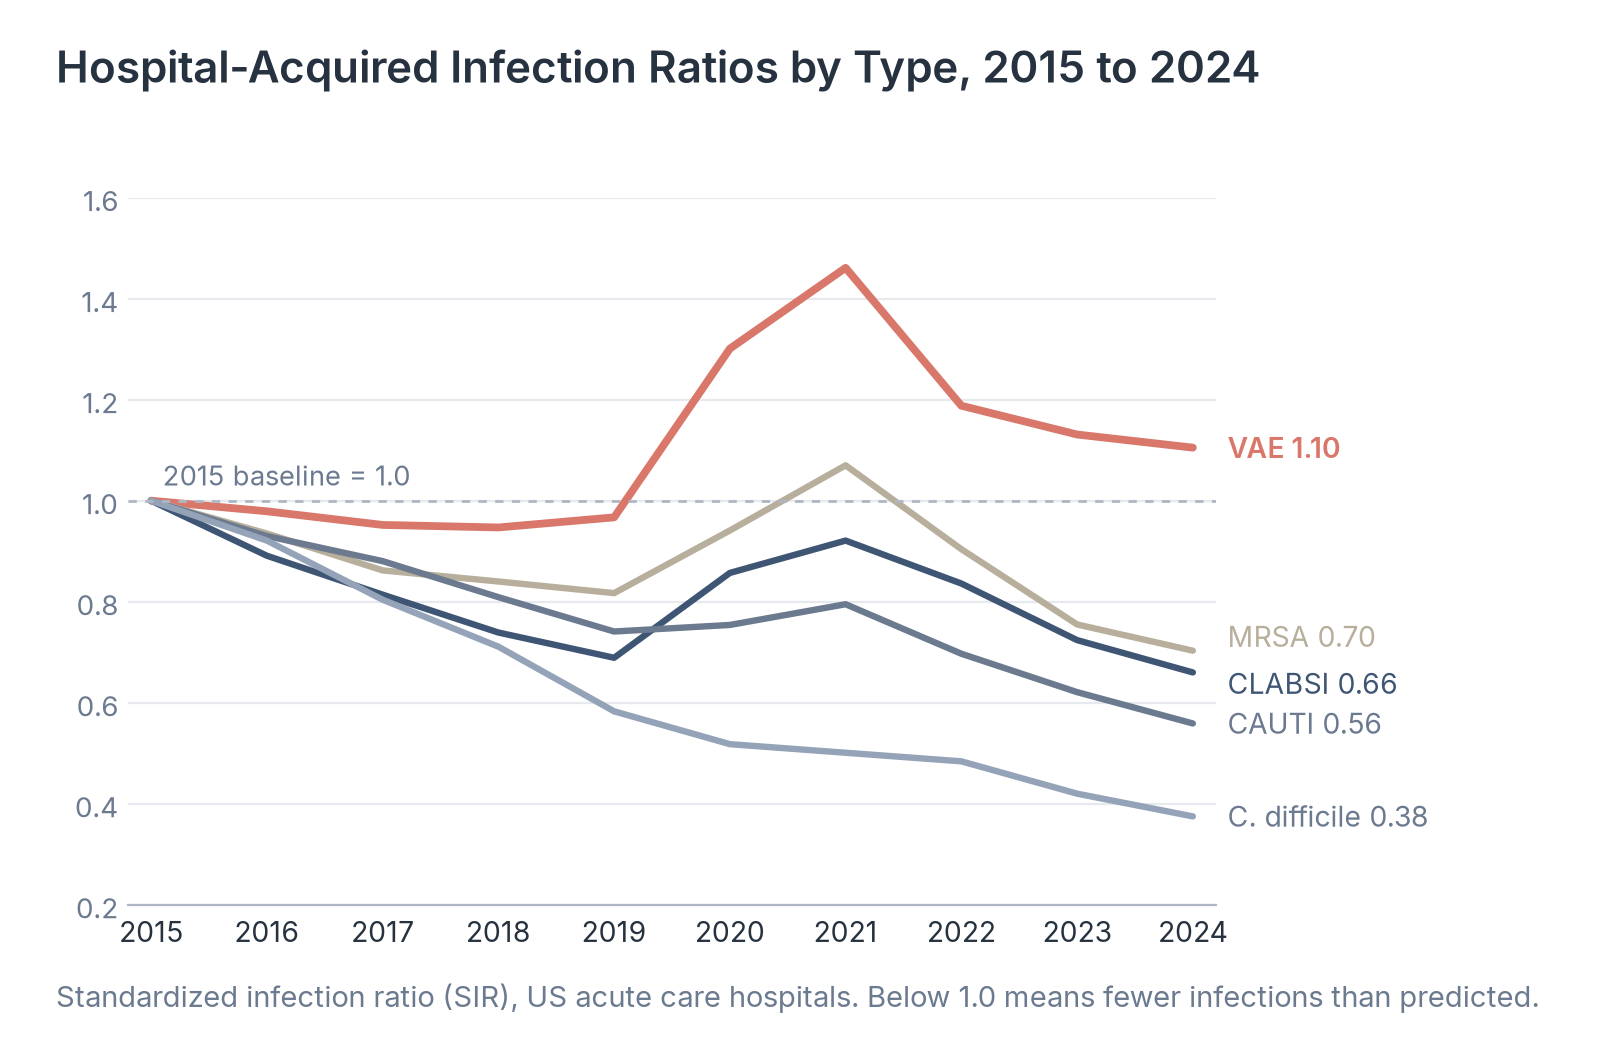
Source: Healthcare Industry Reviews analysis of CDC National Healthcare Safety Network data, conducted November 2026.
Key Findings
- The CLABSI, CAUTI, MRSA, and C. difficile ratios fell every year from 2016 to 2019. In 2020 and 2021, during the COVID-19 pandemic, the CLABSI ratio rose from 0.689 to 0.921, the MRSA ratio rose from 0.817 to 1.07, and the VAE ratio rose from 0.967 to 1.461.
- By 2024, the CLABSI ratio (0.66) and the MRSA ratio (0.703) were below their 2019 levels of 0.689 and 0.817. The CAUTI ratio fell every year from 2021 to 2024, to 0.559.
- Two infection types were above the 2015 baseline in 2024: ventilator-associated events (1.105) and surgical site infections after abdominal hysterectomy (1.112). For patients on ventilators and patients having a hysterectomy, hospitals reported more of these infections than 2015 rates predict.
Which Hospital Infections Rose or Fell in 2024
The change from one year to the next shows whether recent prevention work is holding. We compared each national ratio in 2024 with the same ratio in 2023.
| Infection type | SIR, 2023 | SIR, 2024 | Change |
|---|---|---|---|
| C. difficile infection | 0.42 | 0.375 | −10.7% |
| CAUTI | 0.621 | 0.559 | −10.0% |
| CLABSI | 0.724 | 0.66 | −8.8% |
| MRSA bloodstream infection | 0.755 | 0.703 | −6.9% |
| Colon surgery SSI | 0.879 | 0.845 | −3.9% |
| VAE | 1.131 | 1.105 | −2.3% |
| Abdominal hysterectomy SSI | 1.031 | 1.112 | +7.9% |
Source: Centers for Disease Control and Prevention, 2024 National and State Healthcare-Associated Infections Progress Report, July 15, 2026; CDC, 2024 National and State HAI Progress Report SIR Data, Acute Care Hospitals, July 2026.
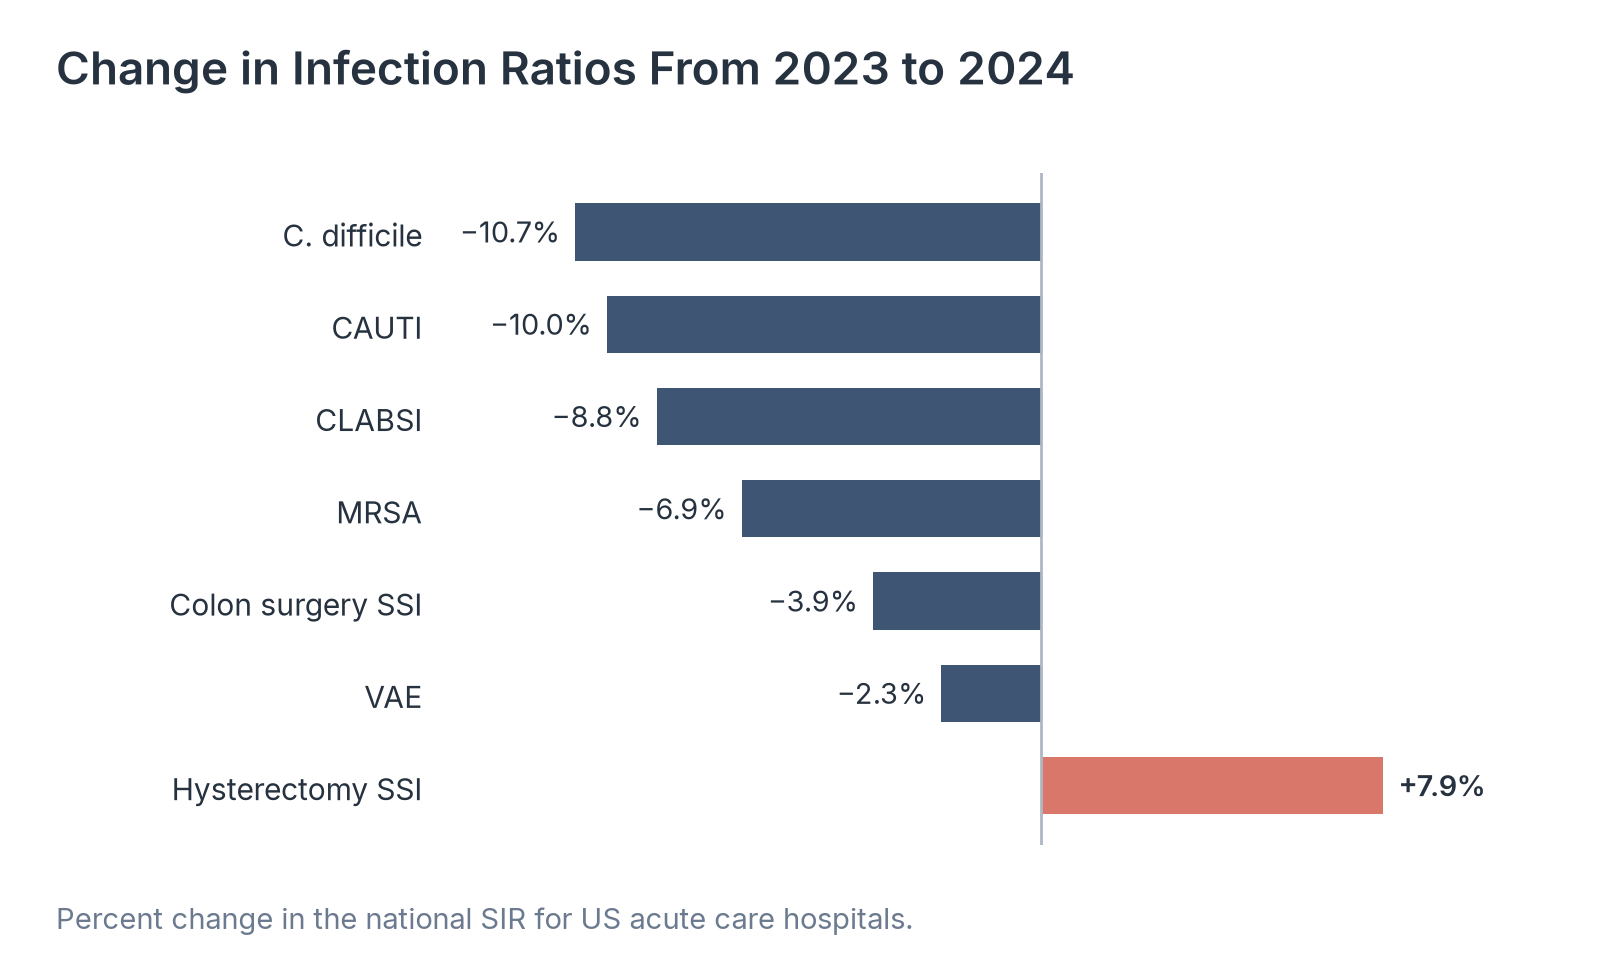
Source: Healthcare Industry Reviews analysis of CDC National Healthcare Safety Network data, conducted November 2026.
Key Findings
- Six of the seven infection types fell in 2024. The C. difficile ratio fell 10.7%, the CAUTI ratio fell 10.0%, and the CLABSI ratio fell 8.8%.
- The CDC reported larger declines in intensive care units than on regular wards for catheter-associated urinary tract infections in 2024, 15% compared with 8%. For CLABSI, the declines were 10% in ICUs and 9% on wards.
- The ratio for surgical site infections after abdominal hysterectomy rose from 1.031 to 1.112. Hospitals reported 1,851 of these infections in 2024, compared with 1,665 predicted.
How Many Infections US Hospitals Reported in 2024
Ratios show progress, but reporters and patients often want the number of infections. We compared the number of infections hospitals reported in 2024 with the number the CDC predicted from 2015 rates.
| Infection type | Hospitals reporting | Reported infections | Predicted infections | Difference |
|---|---|---|---|---|
| C. difficile infection | 3,677 | 31,595 | 84,331 | −52,736 |
| VAE | 1,829 | 26,509 | 23,995 | +2,514 |
| CLABSI | 3,739 | 18,165 | 27,529 | −9,364 |
| CAUTI | 3,782 | 15,347 | 27,473 | −12,126 |
| MRSA bloodstream infection | 3,690 | 7,605 | 10,815 | −3,210 |
| Colon surgery SSI | 3,025 | 7,411 | 8,773 | −1,362 |
| Abdominal hysterectomy SSI | 2,707 | 1,851 | 1,665 | +186 |
Source: CDC, 2024 National and State HAI Progress Report SIR Data, Acute Care Hospitals, July 2026. Hospital-onset events for MRSA and C. difficile. Surgical site infections are for adults.
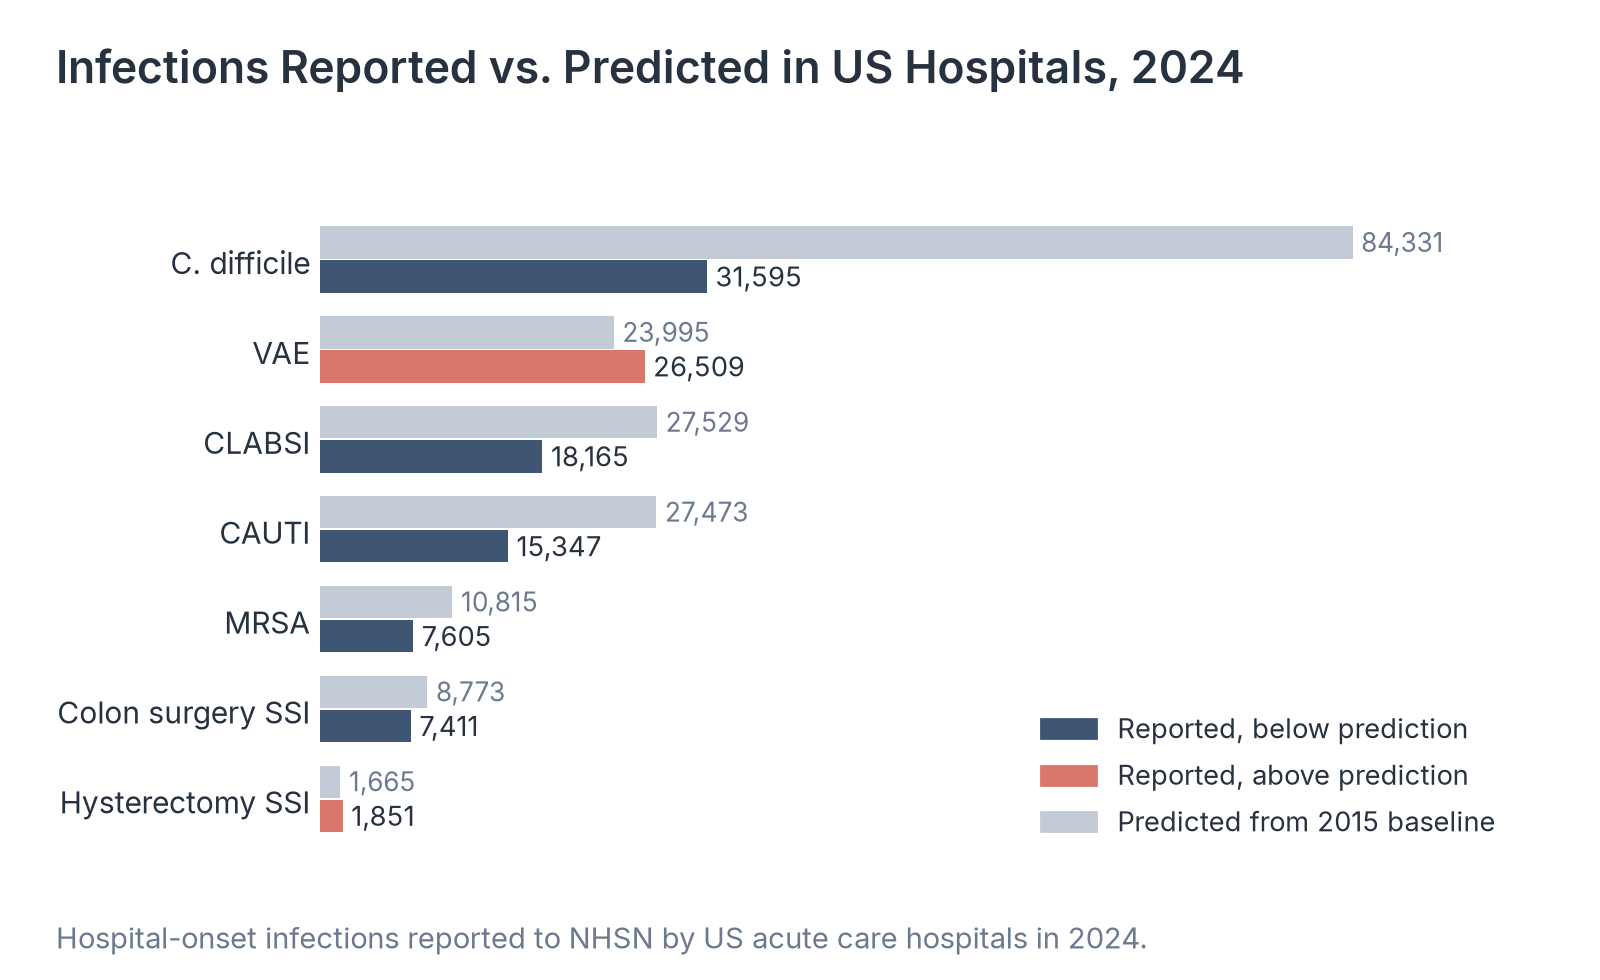
Source: Healthcare Industry Reviews analysis of CDC National Healthcare Safety Network data, conducted November 2026.
Key Findings
- Hospitals reported 31,595 hospital-onset C. difficile infections in 2024, about 52,736 fewer than predicted. In 2016, they reported 95,530.
- Hospitals reported 15,347 catheter-associated urinary tract infections and 7,605 hospital-onset MRSA bloodstream infections in 2024, compared with 19,398 and 8,131 in 2019.
- Ventilator-associated events were the second most common infection type reported, at 26,509, about 2,514 more than predicted. These counts cover acute care hospitals and do not include infections in nursing homes, outpatient clinics, or other facilities.
How States Compare With the 2015 Baseline
The CDC also tests whether each state's hospitals have significantly more or fewer infections than predicted from 2015 rates. We collected those counts for acute care hospitals, inpatient rehabilitation facilities, and long-term acute care hospitals.
| Infection type | Acute care hospitals, better | Acute care hospitals, worse | Rehabilitation facilities, better | Rehabilitation facilities, worse | Long-term acute care, better | Long-term acute care, worse |
|---|---|---|---|---|---|---|
| CLABSI | 46 | 1 | 8 | 0 | 11 | 4 |
| CAUTI | 46 | 0 | 4 | 7 | 12 | 0 |
| VAE | 11 | 24 | n/a | n/a | 9 | 0 |
| SSI, abdominal hysterectomy | 3 | 6 | n/a | n/a | n/a | n/a |
| SSI, colon surgery | 21 | 1 | n/a | n/a | n/a | n/a |
| MRSA bloodstream infection | 42 | 0 | 3 | 0 | 5 | 1 |
| C. difficile infection | 51 | 0 | 44 | 0 | 26 | 0 |
Source: Centers for Disease Control and Prevention, 2024 National and State Healthcare-Associated Infections Progress Report, July 15, 2026. Counts of states and territories whose SIR was significantly lower (better) or higher (worse) than 1.0. n/a means the infection is not reported for that facility type.
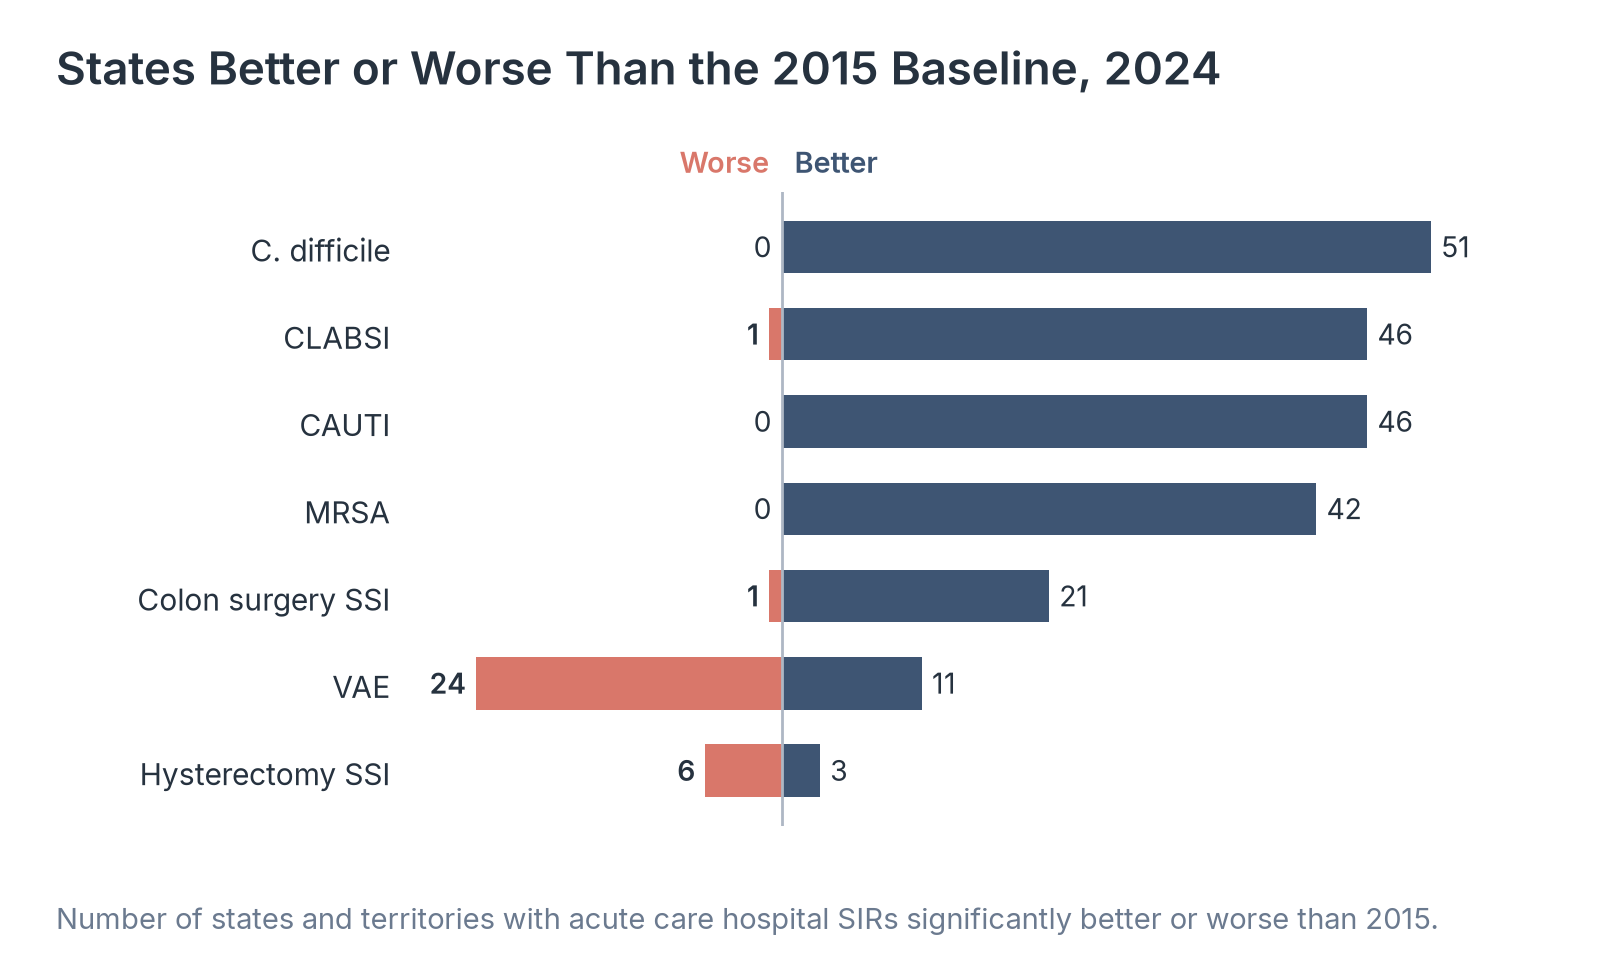
Source: Healthcare Industry Reviews analysis of CDC National Healthcare Safety Network data, conducted November 2026.
Key Findings
- Hospitals in 51 states and territories had significantly fewer C. difficile infections than predicted from 2015 rates, and none had more. For CLABSI and CAUTI, 46 states and territories were better than the baseline.
- Ventilator-associated events were the exception: hospitals in 24 states and territories were worse than the 2015 baseline, and 11 were better. Abdominal hysterectomy surgical site infections were worse than baseline in 6 states and better in 3.
- In inpatient rehabilitation facilities, 7 states were worse than the 2015 baseline for CAUTI. In long-term acute care hospitals, 4 states were worse for CLABSI, so progress in acute care hospitals has not reached every type of facility.
How Infection Ratios Differ From State to State
State ratios let readers compare hospitals in their own state with the national figure for four common infections. We listed the 2024 acute care hospital ratio for each state and DC.
| State | CLABSI | CAUTI | MRSA | C. difficile |
|---|---|---|---|---|
| United States | 0.66 | 0.559 | 0.703 | 0.375 |
| Alabama | 0.73 | 0.53 | 0.867 | 0.465 |
| Alaska | 0.759 | 0.813 | 1.01 | 0.337 |
| Arizona | 0.54 | 0.458 | 0.564 | 0.388 |
| Arkansas | 0.66 | 0.469 | 1.094 | 0.335 |
| California | 0.622 | 0.622 | 0.639 | 0.416 |
| Colorado | 0.626 | 0.545 | 0.53 | 0.321 |
| Connecticut | 0.537 | 0.417 | 0.541 | 0.359 |
| District of Columbia | 0.926 | 0.34 | 0.881 | 0.553 |
| Delaware | 0.709 | 0.621 | 0.686 | 0.428 |
| Florida | 0.57 | 0.425 | 0.774 | 0.249 |
| Georgia | 0.693 | 0.538 | 0.778 | 0.317 |
| Hawaii | 0.597 | 0.782 | 0.596 | 0.451 |
| Idaho | 0.537 | 0.513 | 0.522 | 0.416 |
| Illinois | 0.667 | 0.616 | 0.542 | 0.402 |
| Indiana | 0.645 | 0.534 | 0.582 | 0.404 |
| Iowa | 0.704 | 0.553 | 0.636 | 0.448 |
| Kansas | 0.635 | 0.507 | 0.464 | 0.30 |
| Kentucky | 0.857 | 0.643 | 0.958 | 0.334 |
| Louisiana | 0.665 | 0.51 | 1.099 | 0.375 |
| Maine | 0.526 | 1.019 | 0.588 | 0.292 |
| Maryland | 0.737 | 0.627 | 0.582 | 0.455 |
| Massachusetts | 0.596 | 0.656 | 0.625 | 0.531 |
| Michigan | 0.781 | 0.498 | 0.763 | 0.391 |
| Minnesota | 0.638 | 0.704 | 0.438 | 0.425 |
| Mississippi | 0.705 | 0.569 | 0.923 | 0.362 |
| Missouri | 0.726 | 0.625 | 0.76 | 0.384 |
| Montana | 0.716 | 0.441 | 0.506 | 0.389 |
| Nebraska | 0.501 | 0.477 | 0.612 | 0.44 |
| Nevada | 0.555 | 0.365 | 0.61 | 0.249 |
| New Hampshire | 0.625 | 0.838 | 0.329 | 0.588 |
| New Jersey | 0.542 | 0.575 | 0.665 | 0.335 |
| New Mexico | 0.614 | 0.706 | 0.715 | 0.616 |
| New York | 0.752 | 0.548 | 0.755 | 0.38 |
| North Carolina | 0.757 | 0.555 | 0.666 | 0.308 |
| North Dakota | 0.578 | 0.488 | 0.467 | 0.31 |
| Ohio | 0.67 | 0.505 | 0.806 | 0.442 |
| Oklahoma | 0.481 | 0.466 | 0.815 | 0.246 |
| Oregon | 0.546 | 0.897 | 0.663 | 0.481 |
| Pennsylvania | 0.675 | 0.712 | 0.725 | 0.501 |
| Rhode Island | 0.671 | 0.729 | 0.591 | 0.304 |
| South Carolina | 0.582 | 0.591 | 0.706 | 0.344 |
| South Dakota | 0.406 | 0.656 | 0.582 | 0.504 |
| Tennessee | 0.64 | 0.464 | 0.975 | 0.274 |
| Texas | 0.601 | 0.44 | 0.622 | 0.277 |
| Utah | 0.553 | 0.541 | 0.52 | 0.397 |
| Vermont | 0.78 | 1.014 | 0.316 | 0.644 |
| Virginia | 0.591 | 0.466 | 0.734 | 0.289 |
| Washington | 0.662 | 0.775 | 0.524 | 0.47 |
| West Virginia | 0.729 | 0.578 | 0.799 | 0.562 |
| Wisconsin | 0.618 | 0.593 | 0.529 | 0.574 |
| Wyoming | 0.68 | 0.733 | 0.984 | 0.394 |
Source: CDC, 2024 National and State HAI Progress Report SIR Data, Acute Care Hospitals, July 2026. Acute care hospitals, all locations. n/a means the CDC did not calculate a ratio.
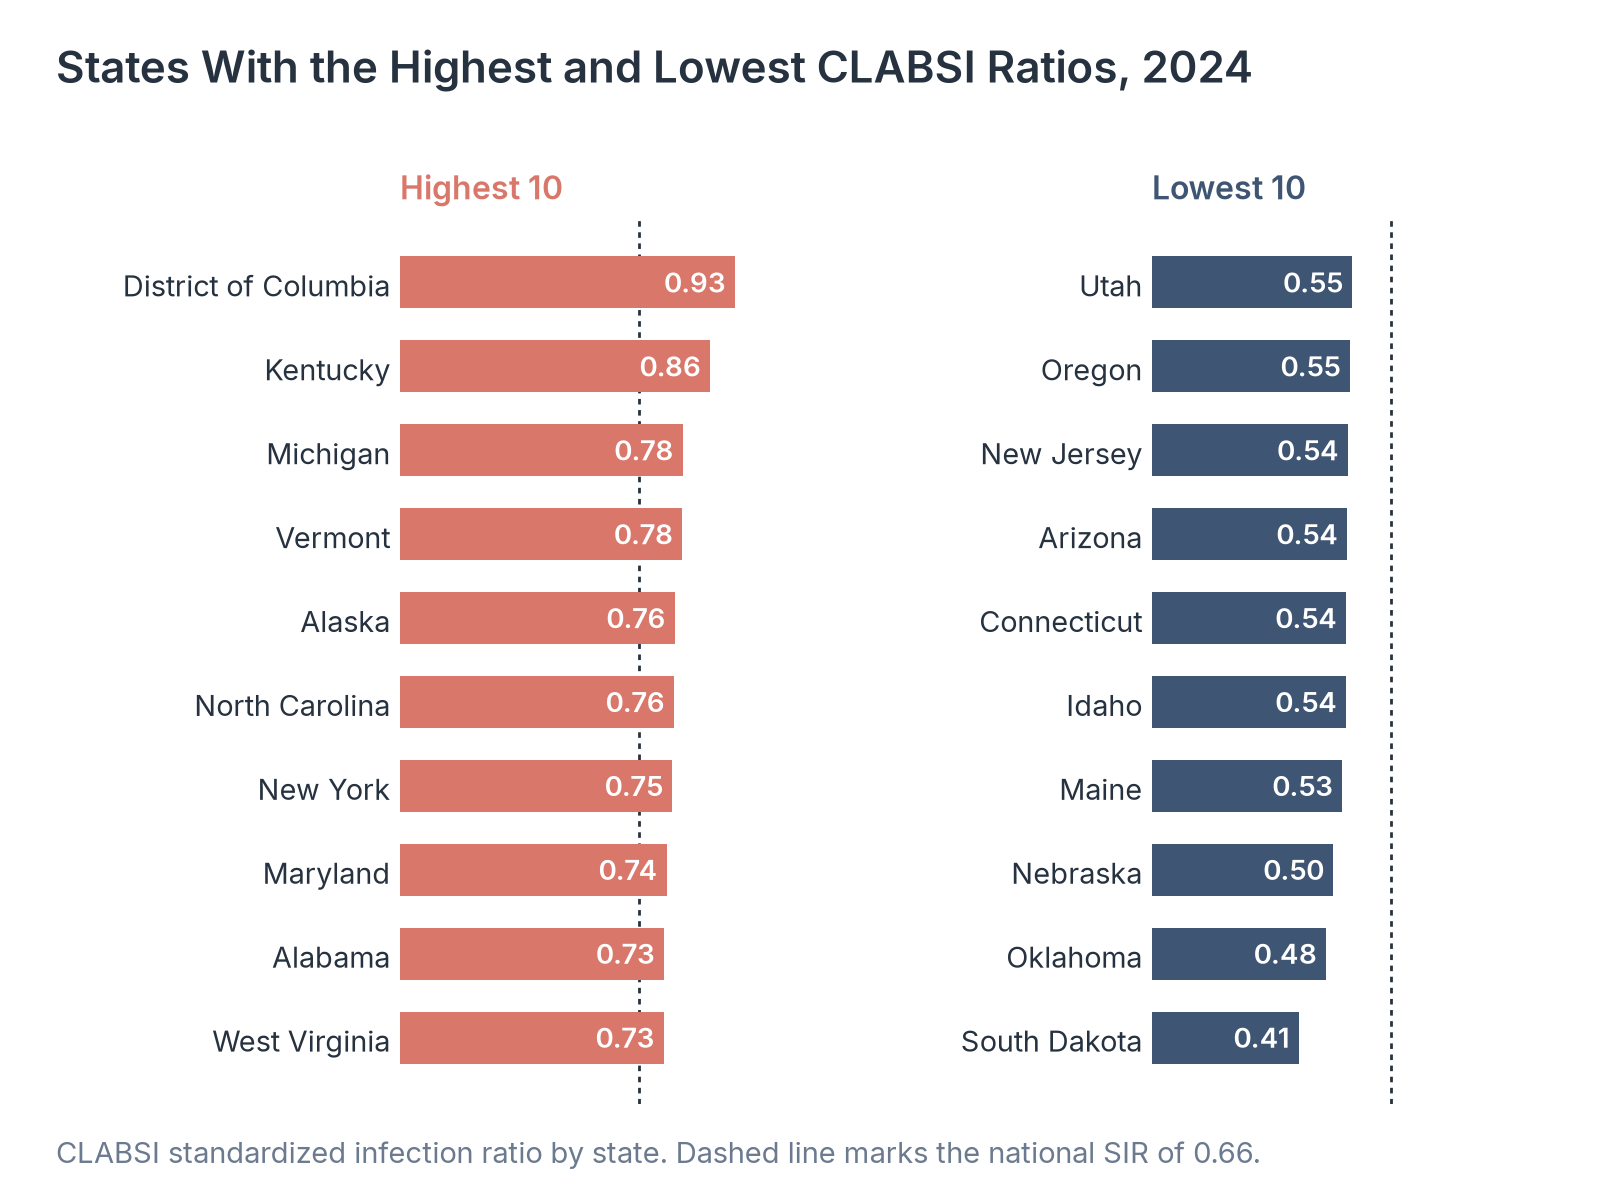
Source: Healthcare Industry Reviews analysis of CDC National Healthcare Safety Network data, conducted November 2026.
Key Findings
- The District of Columbia had the highest CLABSI ratio in 2024, 0.926, followed by Kentucky (0.857). South Dakota had the lowest, 0.406, compared with the national ratio of 0.66.
- C. difficile ratios ranged from 0.246 in Oklahoma to 0.644 in Vermont. Every state was below the 2015 baseline of 1.0 for C. difficile.
- State ratios combine every reporting hospital, so a state with a low ratio can still have individual hospitals with high infection rates. Hospital-level results are published on the CMS Care Compare website.
How Many Hospitals Have Higher Infection Ratios Than the National Ratio
National and state ratios can hide hospitals that perform much worse than average. We counted how many hospitals had ratios significantly higher or lower than the national ratio for each infection type in 2024.
| Infection type | Hospitals with an SIR | Significantly higher | Share higher | Significantly lower | Share lower |
|---|---|---|---|---|---|
| VAE | 1,402 | 340 | 24.3% | 319 | 22.8% |
| C. difficile infection | 3,118 | 342 | 11.0% | 442 | 14.2% |
| CAUTI | 2,536 | 206 | 8.1% | 211 | 8.3% |
| Colon surgery SSI | 1,754 | 124 | 7.1% | 75 | 4.3% |
| CLABSI | 2,365 | 159 | 6.7% | 185 | 7.8% |
| Abdominal hysterectomy SSI | 521 | 33 | 6.3% | 11 | 2.1% |
| MRSA bloodstream infection | 1,926 | 103 | 5.3% | 50 | 2.6% |
Source: CDC, 2024 National and State HAI Progress Report SIR Data, Acute Care Hospitals, July 2026. Hospitals with at least one predicted infection, for which an SIR is calculated.
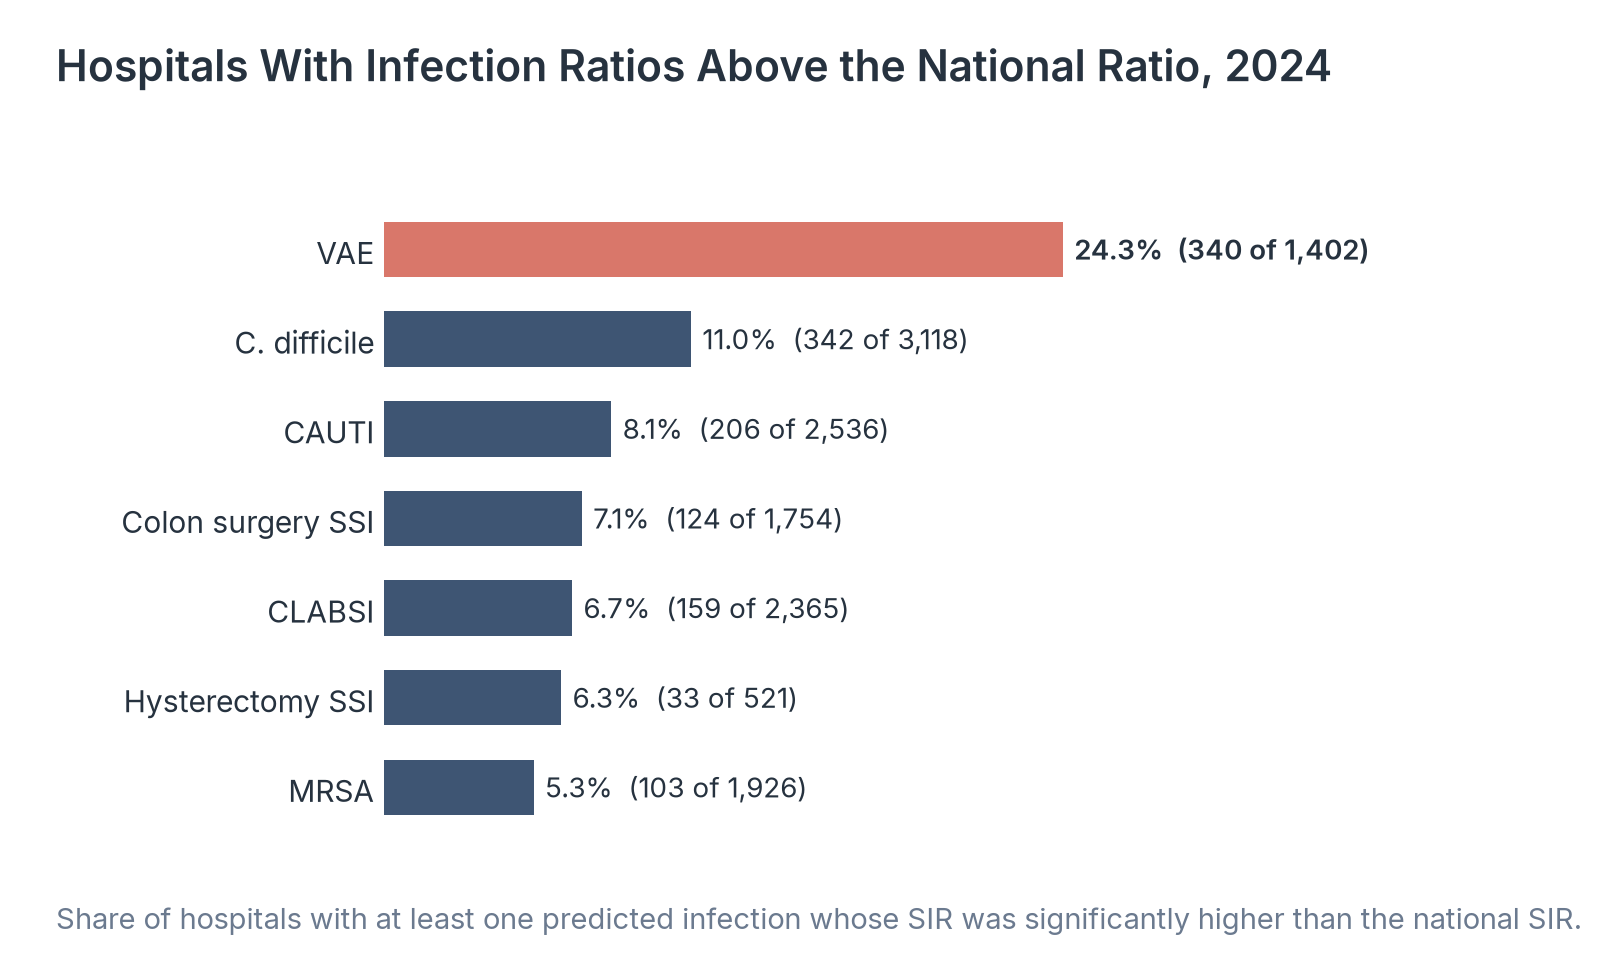
Source: Healthcare Industry Reviews analysis of CDC National Healthcare Safety Network data, conducted November 2026.
Key Findings
- 340 of 1,402 hospitals, 24.3%, had a ventilator-associated event ratio significantly higher than the national ratio in 2024, and 319 were significantly lower.
- For C. difficile, 342 of 3,118 hospitals (11.0%) were significantly higher than the national ratio. For CLABSI, 159 of 2,365 (6.7%) were.
- MRSA had the smallest share of hospitals above the national ratio, 5.3%. For abdominal hysterectomy surgical site infections, 33 of 521 hospitals (6.3%) were.
What Hospital-Acquired Infection Statistics Show
US hospitals have cut most common infections well below 2015 levels and recovered the ground lost in 2020 and 2021. Each infection prevented is one fewer patient who needs treatment for an illness they did not come into the hospital with.
The progress is uneven. Infections tied to ventilators and to hysterectomy surgery are still above their 2015 levels, rehabilitation and long-term acute care facilities lag behind acute care hospitals in several states, and about one in four hospitals that report ventilator events has a ratio significantly higher than the national ratio.
So if you are citing hospital-acquired infection statistics, give the infection type, the year, and whether the figure is a count of infections or a ratio compared with 2015.
Data Collection and Methodology
All figures come from the CDC's National and State Healthcare-Associated Infections Progress Reports, which use data that hospitals report to the National Healthcare Safety Network. We used the acute care hospital SIR data tables for each data year from 2016 to 2024; the 2024 tables were published in July 2026.
National ratios and counts come from the national tables for device-associated infections, laboratory-identified MRSA and C. difficile events, and adult surgical site infections. State ratios come from the state tables for all locations. Counts of states better or worse than the 2015 baseline, the 2023 to 2024 changes by unit type, and the daily prevalence of 1 in 38 patients come from the 2024 report.
The standardized infection ratio (SIR) divides the number of infections reported by the number predicted from the 2015 national baseline, adjusting for patient and facility risk factors. The CDC does not calculate an SIR when fewer than one infection is predicted. Hospital comparisons with the national ratio count hospitals whose SIR was significantly higher or lower than the national SIR, among hospitals with at least one predicted infection.
Surgical site infection figures cover adults. MRSA and C. difficile figures are hospital-onset events. Reporting requirements differ by state and by infection type, and the number of hospitals reporting varies from year to year.
We calculated percentage changes and differences from the published values.
Sources
- Healthcare Industry Reviews analysis of CDC National Healthcare Safety Network standardized infection ratios and infection counts for US acute care hospitals, 2016 to 2024, conducted November 2026.
- Centers for Disease Control and Prevention. 2024 National and State Healthcare-Associated Infections Progress Report. July 15, 2026.
- Centers for Disease Control and Prevention. 2024 National and State HAI Progress Report SIR Data, Acute Care Hospitals. July 2026.
- Centers for Disease Control and Prevention, National Healthcare Safety Network. HAI Progress Reports, SIR data tables for 2016 to 2023.