Long-Term Care Cost Statistics: 2026 Report
Published
Our analysts reviewed Genworth and CareScout Cost of Care Survey results for 10 survey years from 2004 to 2025, including 2025 prices from about 16,000 surveys of long-term care providers in all 50 states, to show what nursing homes, assisted living, and home care cost, how fast those costs have risen, and who pays for them, as of Q4 2026.
Key Findings
- The national median cost of a private nursing home room was $129,575 a year in 2025, or $10,798 a month. A semi-private room cost $114,975 a year.
- Assisted living cost a median of $6,200 a month in 2025 ($74,400 a year), up 5% from 2024. A non-medical home caregiver cost $35 an hour, or $80,080 a year at 44 hours a week.
- From 2004 to 2025, the annual cost of a private nursing home room rose 99% and the cost of assisted living rose 158%, compared with 70% growth in consumer prices.
- Annual nursing home costs ranged from $91,250 in Missouri and Texas to $221,372 in Oregon in 2025, a gap of 2.4 times.
- Medicaid paid 45.6% of the $563.7 billion spent on long-term services and supports in 2023, and people paid $81.0 billion (14.4%) out of pocket.
Long-term care is help with everyday activities, such as bathing, dressing, eating, and getting around, for people who can no longer manage them alone because of age, illness, or disability. It can come from an aide who visits the home, from an assisted living community, or from a nursing home that provides round-the-clock nursing care.
Medicare pays mainly for short skilled nursing stays and home health services. Medicaid, the largest payer, is limited to people with low incomes and few assets, so families who need ongoing help often pay for it themselves.7 That makes the price of care a central number in retirement planning, caregiving, and state Medicaid budgets.
But the price depends heavily on the type of care and the state where it is delivered.
Our analysts compiled national median costs from the Genworth and CareScout Cost of Care Survey across 10 survey years from 2004 to 2025.2,3,4,5,6 We compared 2025 costs by state and type of care, measured growth against consumer prices, and used Congressional Research Service figures to show who pays.7
In the following sections, we cover how long-term care costs have changed since 2004, what each type of care costs in 2025, nursing home costs by state, assisted living costs by state, home care rates by state, and who pays for long-term services and supports.
How Long-Term Care Costs Have Changed Since 2004
A long price history shows how much the cost of a year of care has grown over two decades. We tracked the annual national cost of a private nursing home room, assisted living, and a home care aide across 10 survey years from 2004 to 2025.
| Year | Nursing home, private room | Assisted living | Home care aide, 44 hours a week |
|---|---|---|---|
| 2025 | $129,575 | $74,400 | $80,080 |
| 2024 | $127,750 | $70,800 | $77,792 |
| 2023 | $116,800 | $64,200 | $75,504 |
| 2021 | $108,405 | $54,000 | $61,776 |
| 2020 | $105,850 | $51,600 | $54,912 |
| 2019 | $102,200 | $48,612 | $52,624 |
| 2016 | $92,378 | $43,536 | $46,332 |
| 2012 | $81,030 | $39,600 | $43,472 |
| 2008 | $76,460 | $36,090 | $43,472 |
| 2004 | $65,185 | $28,800 | $42,168 |
Source: Genworth, Cost of Care Trends and Insights, 2004 to 2020; Genworth, Cost of Care Survey 2021; CareScout, 2024 Cost of Care Survey Summary; Genworth, 2024 survey results, February 2025; CareScout, Cost of Care Survey 2025. Figures for 2004 and 2008 are averages and later years are medians. Home care is the home health aide rate through 2024 and the non-medical caregiver rate in 2025.
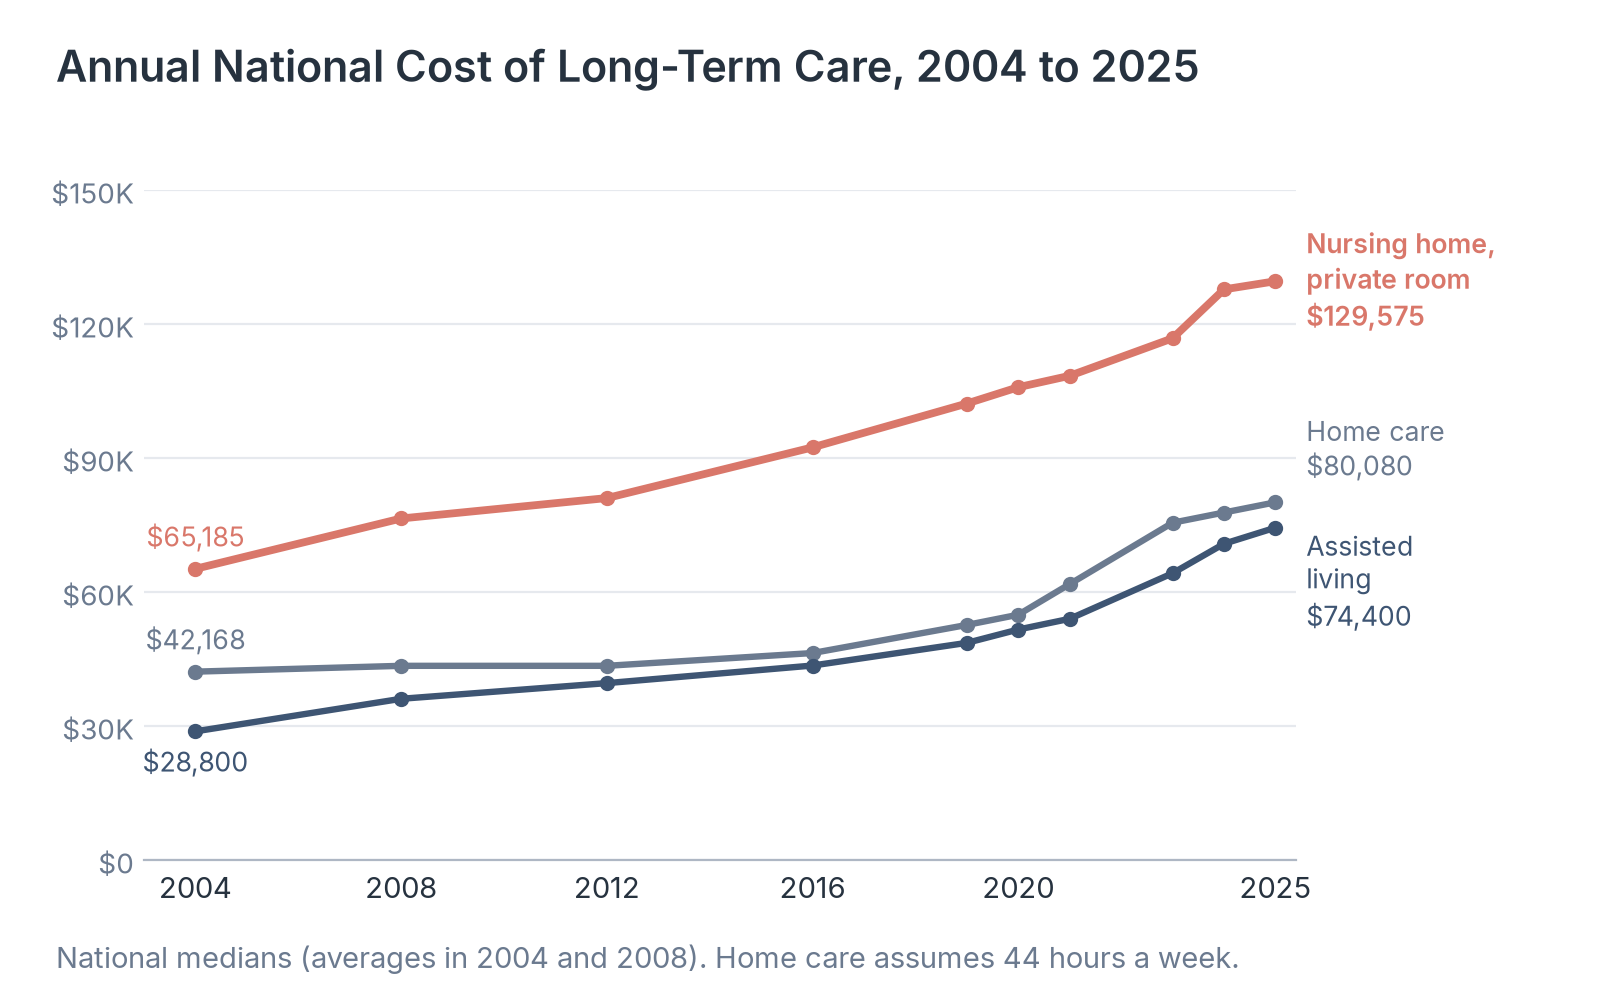
Source: Healthcare Industry Reviews analysis of Genworth and CareScout Cost of Care Survey data, conducted November 2026.
Key Findings
- A private nursing home room cost $64,390 more a year in 2025 than in 2004. Assisted living more than doubled over the same period, from $28,800 to $74,400.
- The largest one-year increase in the series came in 2024, when the annual cost of a private nursing home room rose 9% to $127,750 and assisted living rose 10% to $70,800.
- From 2020 to 2025, the cost of a private nursing home room rose 22%, slightly less than the 24% rise in consumer prices, while assisted living rose 44% and home care rose 46%. For families planning ahead, the faster recent growth has been in assisted living and home care, the lower-cost alternatives to a nursing home.
What Each Type of Long-Term Care Costs in 2025
Providers price care in different units, by the hour for home care, by the day for adult day programs, and by the month for assisted living and nursing homes. We set the 2025 national medians side by side with the 2024 figures and converted each to an annual cost.
| Type of care (rate) | 2025 median | 2024 median | Change | 2025 annual cost |
|---|---|---|---|---|
| Nursing home, private room (monthly) | $10,798 | $10,646 | 1% | $129,575 |
| Nursing home, semi-private room (monthly) | $9,581 | $9,277 | 3% | $114,975 |
| Assisted living community (monthly) | $6,200 | $5,900 | 5% | $74,400 |
| Non-medical caregiver (hourly) | $35 | $34 | 3% | $80,080 |
| Adult day health care (daily) | $95 | $100 | -5% | $24,700 |
| Skilled nursing in the home (hourly) | $90 | Not reported | Not reported | $4,680 |
Source: CareScout, Cost of Care Survey 2025, national median values and Median Cost Data Tables. Annual costs assume 365 days of nursing home care, 12 months of assisted living, 44 hours a week of non-medical care, 5 days a week of adult day care, and 1 hour a week of skilled nursing in the home.
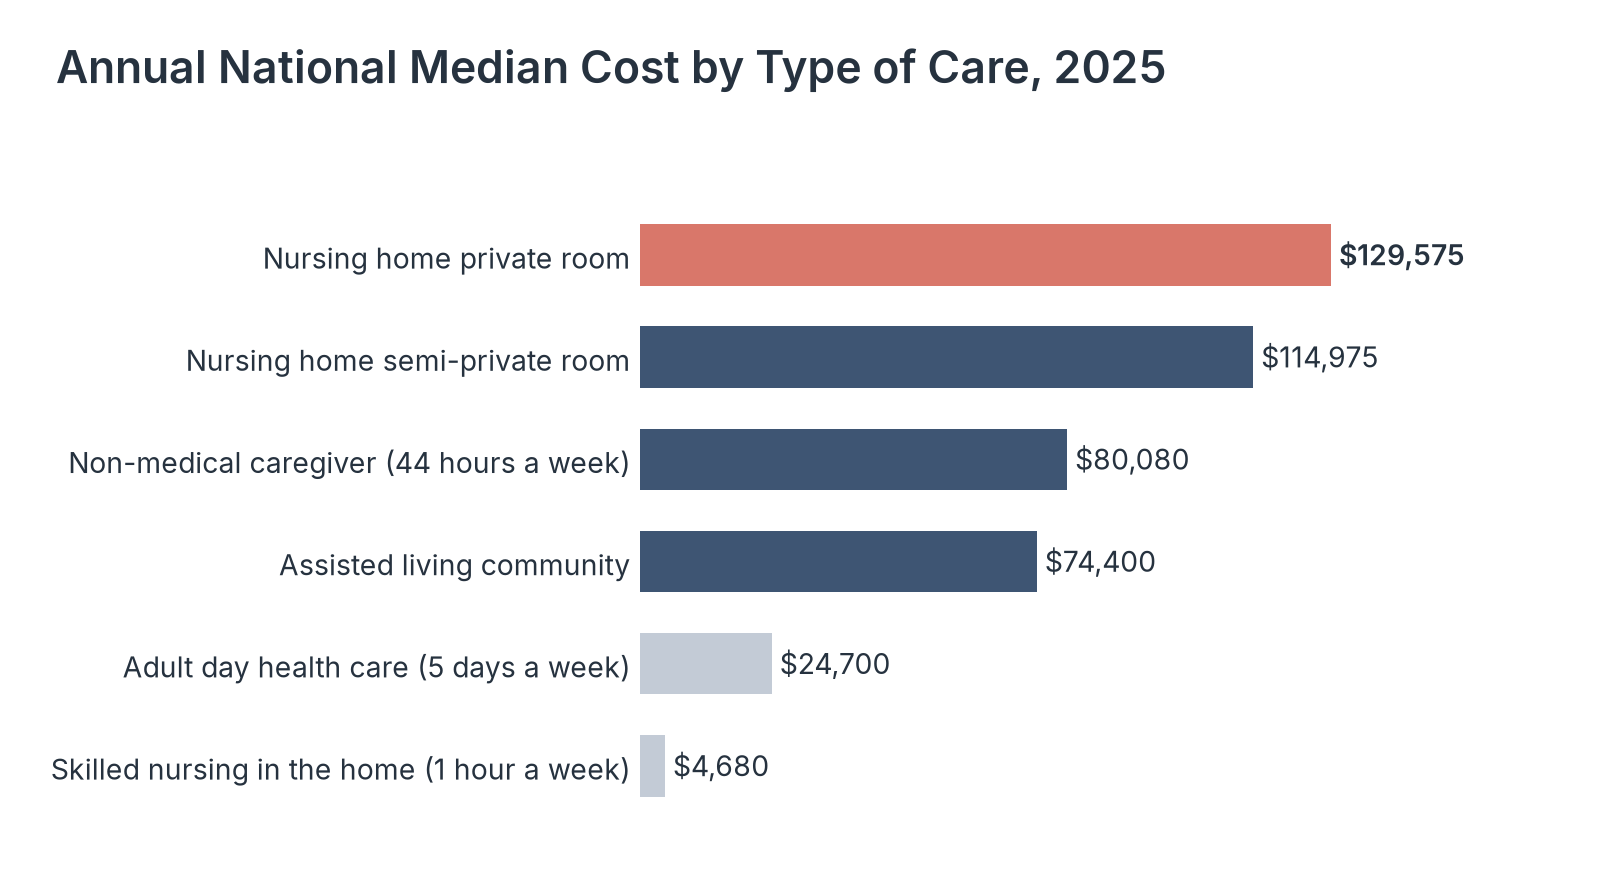
Source: Healthcare Industry Reviews analysis of Genworth and CareScout Cost of Care Survey data, conducted November 2026.
Key Findings
- A month in a private nursing home room cost 1.7 times as much as a month in assisted living in 2025. The daily nursing home rate was $355 for a private room and $315 for a semi-private room.
- Adult day health care was the only type of care whose national median fell in 2025, from $100 to $95 a day. At five days a week, it cost about a third as much as assisted living.
- Skilled nursing in the home, provided by a licensed practical nurse or registered nurse, cost a median $90 an hour in 2025, about two and a half times the $35 rate for a non-medical caregiver. In 2025, CareScout merged homemaker and home health aide services into one non-medical caregiver rate because the two had converged in price.
How Much Nursing Home Care Costs in Each State
Nursing home prices vary widely across the country, so the national median can be far from what a family pays in its own state. We compared the 2025 median annual cost of private and semi-private nursing home rooms in every state with enough survey responses.
| State | Private room, annual | Private room, monthly | Semi-private room, annual |
|---|---|---|---|
| United States (median) | $129,575 | $10,798 | $114,975 |
| Oregon | $221,372 | $18,448 | $201,115 |
| Connecticut | $200,750 | $16,729 | $182,500 |
| New York | $200,750 | $16,729 | $186,332 |
| Hawaii | $196,735 | $16,395 | $185,679 |
| Washington | $191,625 | $15,969 | $157,859 |
| Massachusetts | $189,800 | $15,817 | $173,375 |
| Vermont | $186,332 | $15,528 | $169,360 |
| California | $182,135 | $15,178 | $146,000 |
| Delaware | $181,588 | $15,132 | $173,922 |
| Maine | $178,850 | $14,904 | $167,718 |
| Nevada | $173,558 | $14,463 | $141,438 |
| New Jersey | $173,375 | $14,448 | $153,300 |
| Maryland | $173,375 | $14,448 | $155,125 |
| Minnesota | $166,440 | $13,870 | $127,750 |
| Pennsylvania | $164,250 | $13,688 | $143,445 |
| New Hampshire | $161,330 | $13,444 | $146,912 |
| Rhode Island | $160,600 | $13,383 | $145,270 |
| West Virginia | $159,140 | $13,262 | $154,030 |
| Wisconsin | $147,825 | $12,319 | $127,750 |
| North Dakota | $147,642 | $12,304 | $138,335 |
| Colorado | $146,182 | $12,182 | $121,910 |
| Idaho | $146,000 | $12,167 | $125,925 |
| Florida | $146,000 | $12,167 | $124,100 |
| Michigan | $143,628 | $11,969 | $135,050 |
| Virginia | $140,160 | $11,680 | $123,005 |
| Arizona | $137,240 | $11,437 | $100,375 |
| Kentucky | $135,050 | $11,254 | $116,618 |
| Wyoming | $131,081 | $10,923 | $118,990 |
| North Carolina | $129,575 | $10,798 | $116,800 |
| Utah | $127,750 | $10,646 | $104,025 |
| New Mexico | $127,597 | $10,633 | $109,500 |
| Ohio | $124,666 | $10,389 | $110,230 |
| Indiana | $123,918 | $10,326 | $107,310 |
| South Dakota | $122,275 | $10,190 | $113,332 |
| Tennessee | $120,450 | $10,038 | $113,150 |
| Iowa | $120,450 | $10,038 | $111,325 |
| Mississippi | $118,625 | $9,885 | $114,975 |
| South Carolina | $115,340 | $9,612 | $108,405 |
| Montana | $114,975 | $9,581 | $107,675 |
| Georgia | $113,150 | $9,429 | $105,850 |
| Illinois | $110,595 | $9,216 | $99,645 |
| Nebraska | $110,595 | $9,216 | $100,521 |
| Kansas | $108,770 | $9,064 | $104,025 |
| Alabama | $105,441 | $8,787 | $100,010 |
| Louisiana | $96,908 | $8,076 | $91,250 |
| Arkansas | $96,725 | $8,060 | $89,425 |
| Oklahoma | $93,075 | $7,756 | $84,315 |
| Missouri | $91,250 | $7,604 | $80,893 |
| Texas | $91,250 | $7,604 | $67,525 |
| Alaska | Not reported | Not reported | $333,975 |
Source: CareScout, Cost of Care Survey 2025, Ranked Median Costs by State Data Tables. States ordered by the annual cost of a private room. Alaska had too few private-room responses to report.
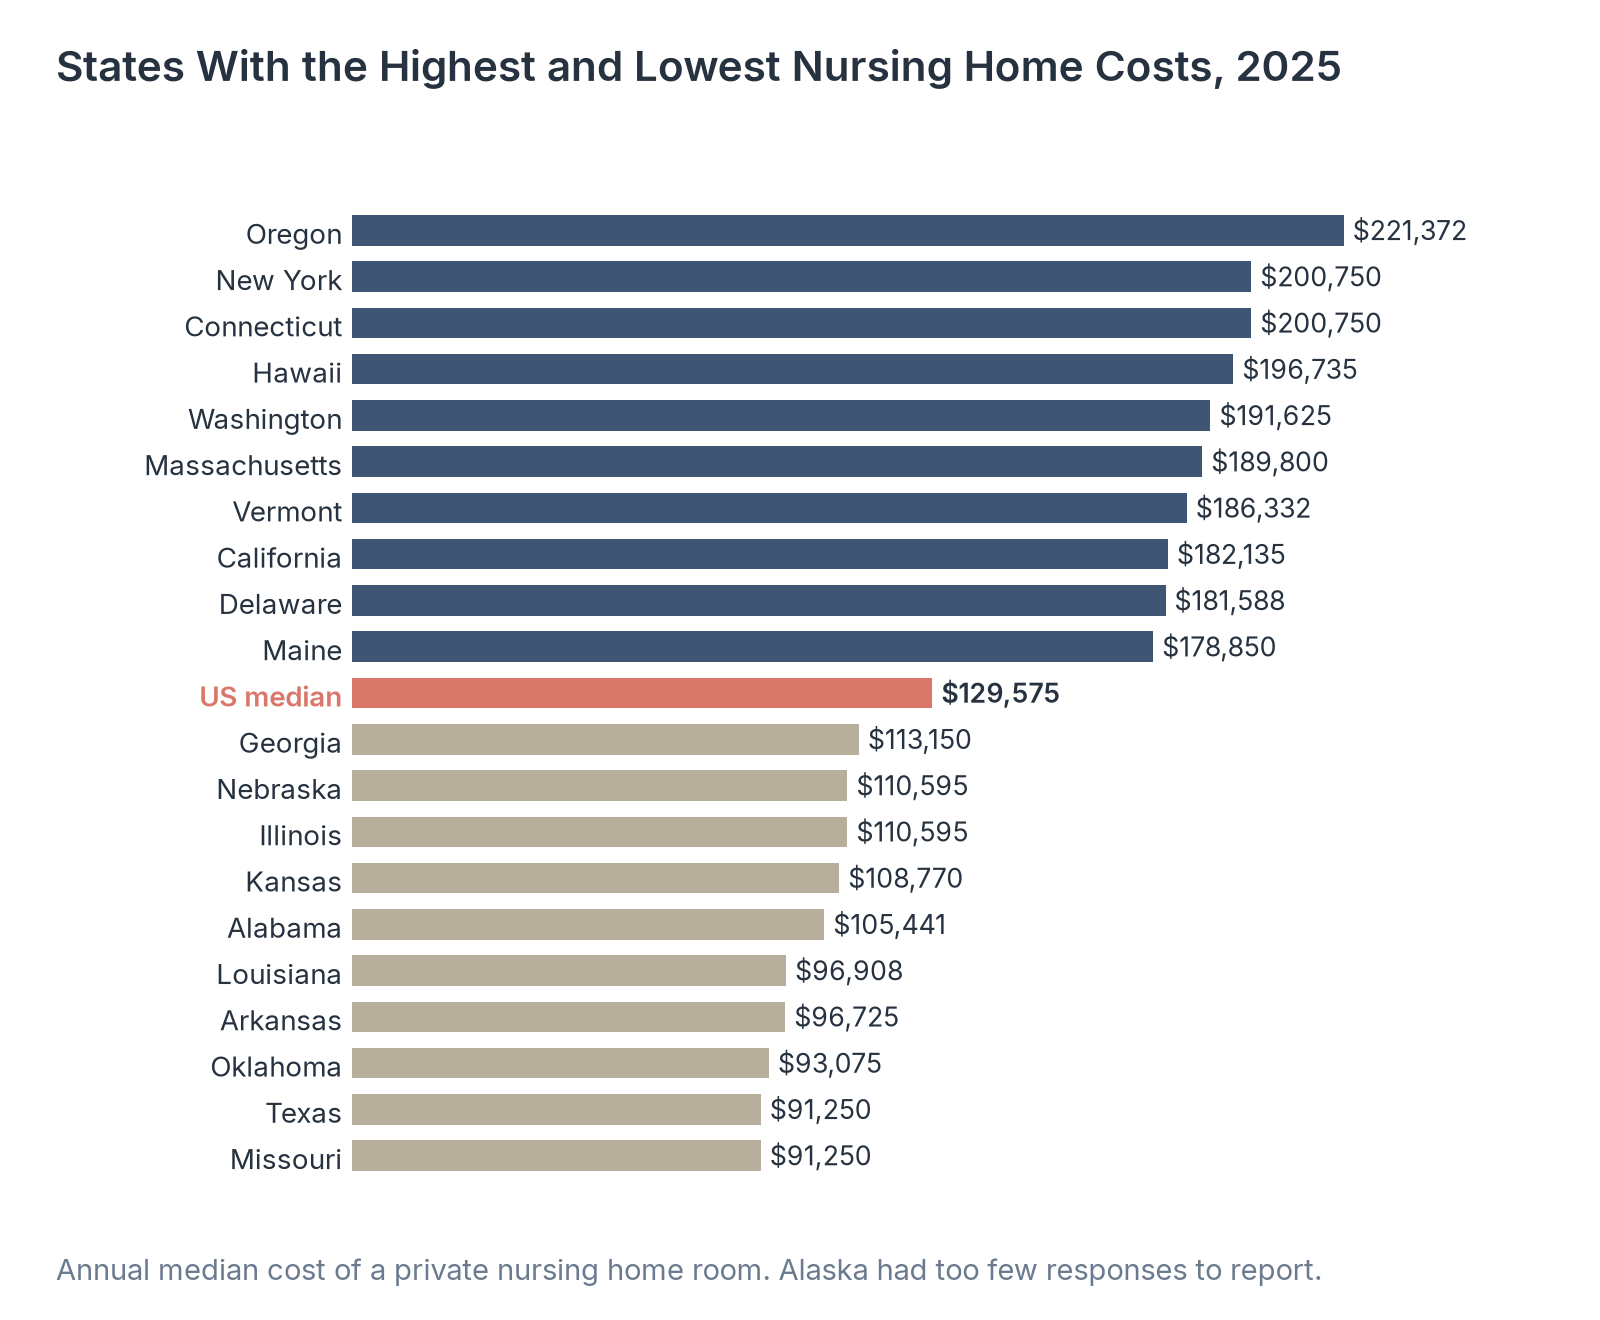
Source: Healthcare Industry Reviews analysis of Genworth and CareScout Cost of Care Survey data, conducted November 2026.
Key Findings
- Oregon had the highest annual cost for a private nursing home room in 2025, at $221,372, followed by Connecticut and New York at $200,750. Missouri and Texas had the lowest, at $91,250.
- Eighteen states had a median private-room cost of $150,000 or more a year. Most of them are in New England, the Mid-Atlantic, and the West Coast, along with Hawaii.
- Alaska had the highest semi-private room cost in the country, at $333,975 a year, almost three times the national median of $114,975. Texas had the lowest, at $67,525.
How Much Assisted Living Costs in Each State
Assisted living communities provide housing, personal care, and some health services, and families often weigh them as an alternative to a nursing home. We compared the 2025 median monthly cost of assisted living in the 10 most expensive and 10 least expensive states with the national median.
| State | Monthly cost | Annual cost |
|---|---|---|
| Hawaii | $12,096 | $145,155 |
| Alaska | $9,882 | $118,578 |
| Massachusetts | $9,600 | $115,200 |
| Connecticut | $9,118 | $109,410 |
| New Jersey | $8,710 | $104,520 |
| Vermont | $8,597 | $103,167 |
| Maine | $8,205 | $98,460 |
| New Hampshire | $8,025 | $96,300 |
| Rhode Island | $7,780 | $93,366 |
| Washington | $7,600 | $91,200 |
| United States (median) | $6,200 | $74,400 |
| South Carolina | $5,350 | $64,200 |
| Wyoming | $5,325 | $63,900 |
| Georgia | $5,300 | $63,600 |
| Idaho | $5,175 | $62,100 |
| Louisiana | $5,162 | $61,950 |
| South Dakota | $4,900 | $58,800 |
| North Dakota | $4,729 | $56,745 |
| Arkansas | $4,637 | $55,644 |
| Alabama | $4,425 | $53,100 |
| Mississippi | $4,369 | $52,425 |
Source: CareScout, Cost of Care Survey 2025, Ranked Median Costs by State Data Tables. Costs for all 50 states appear in the Median Cost Data Tables.
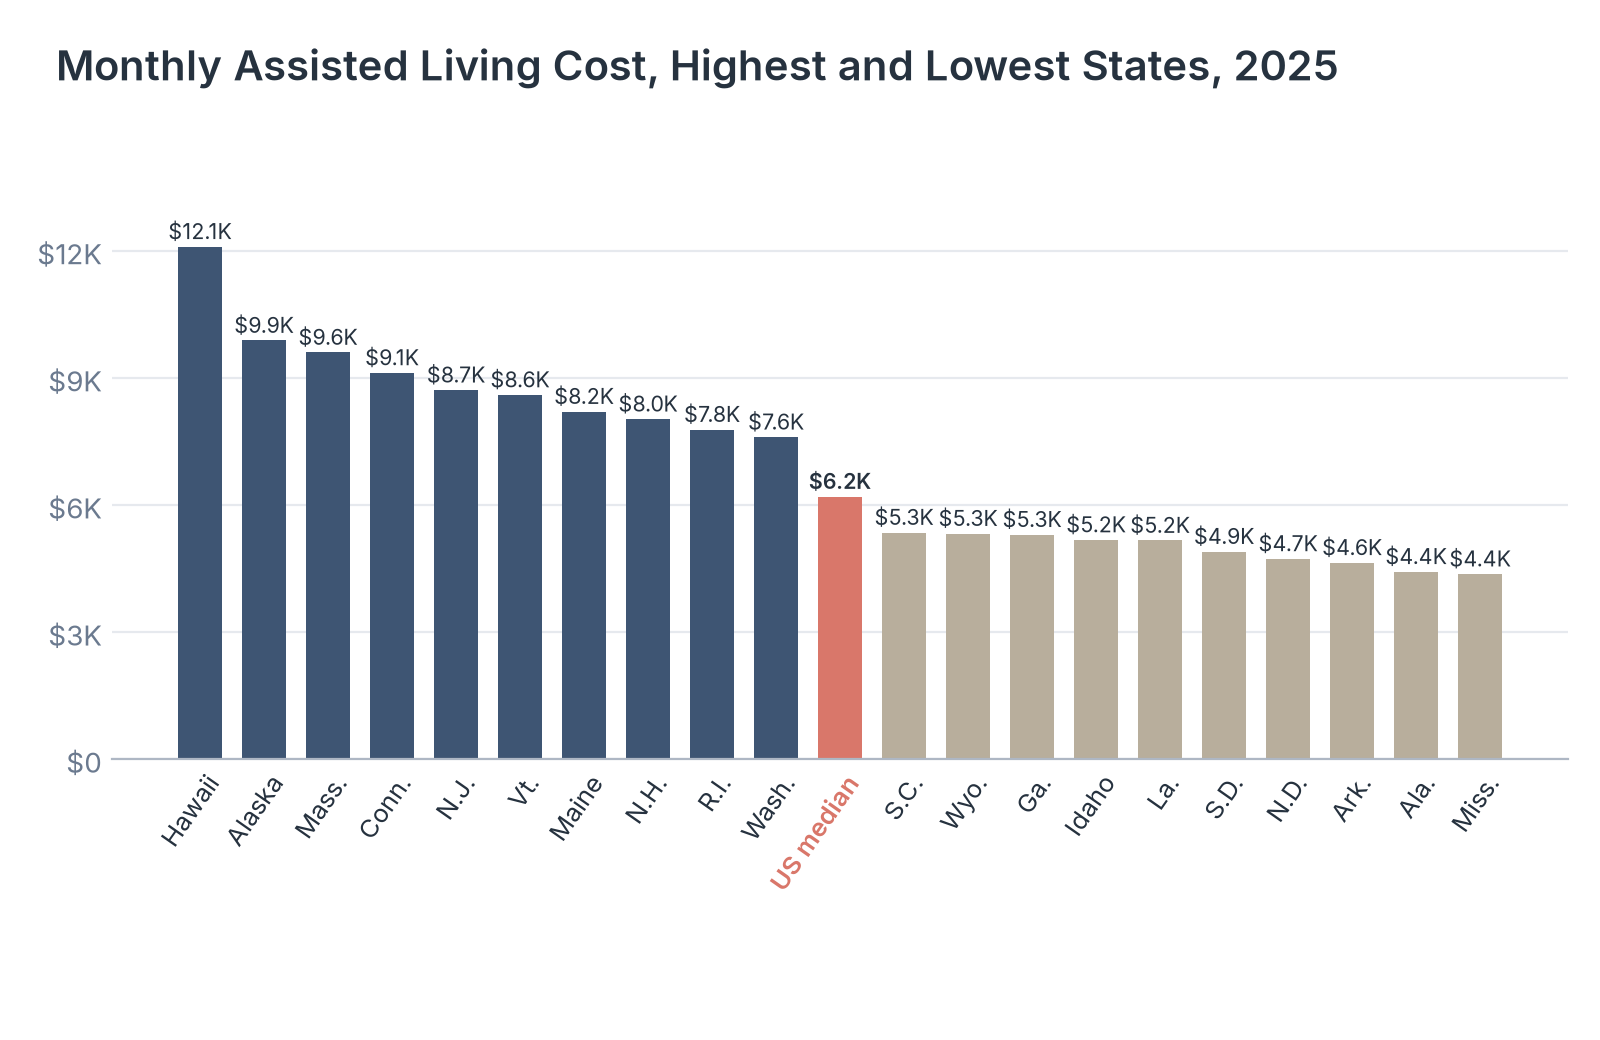
Source: Healthcare Industry Reviews analysis of Genworth and CareScout Cost of Care Survey data, conducted November 2026.
Key Findings
- Hawaii had the highest assisted living cost in 2025, at $12,096 a month, about 2.8 times the cost in Mississippi, the lowest at $4,369.
- Seven of the 10 most expensive states for assisted living were in New England or the Mid-Atlantic, led by Massachusetts at $9,600 a month and Connecticut at $9,118.
- The 10 least expensive states were all in the South, the Mountain West, or the Great Plains, with monthly costs from $4,369 to $5,350. Even there, a year of assisted living cost more than $52,000.
How Much Home Care Costs in Each State
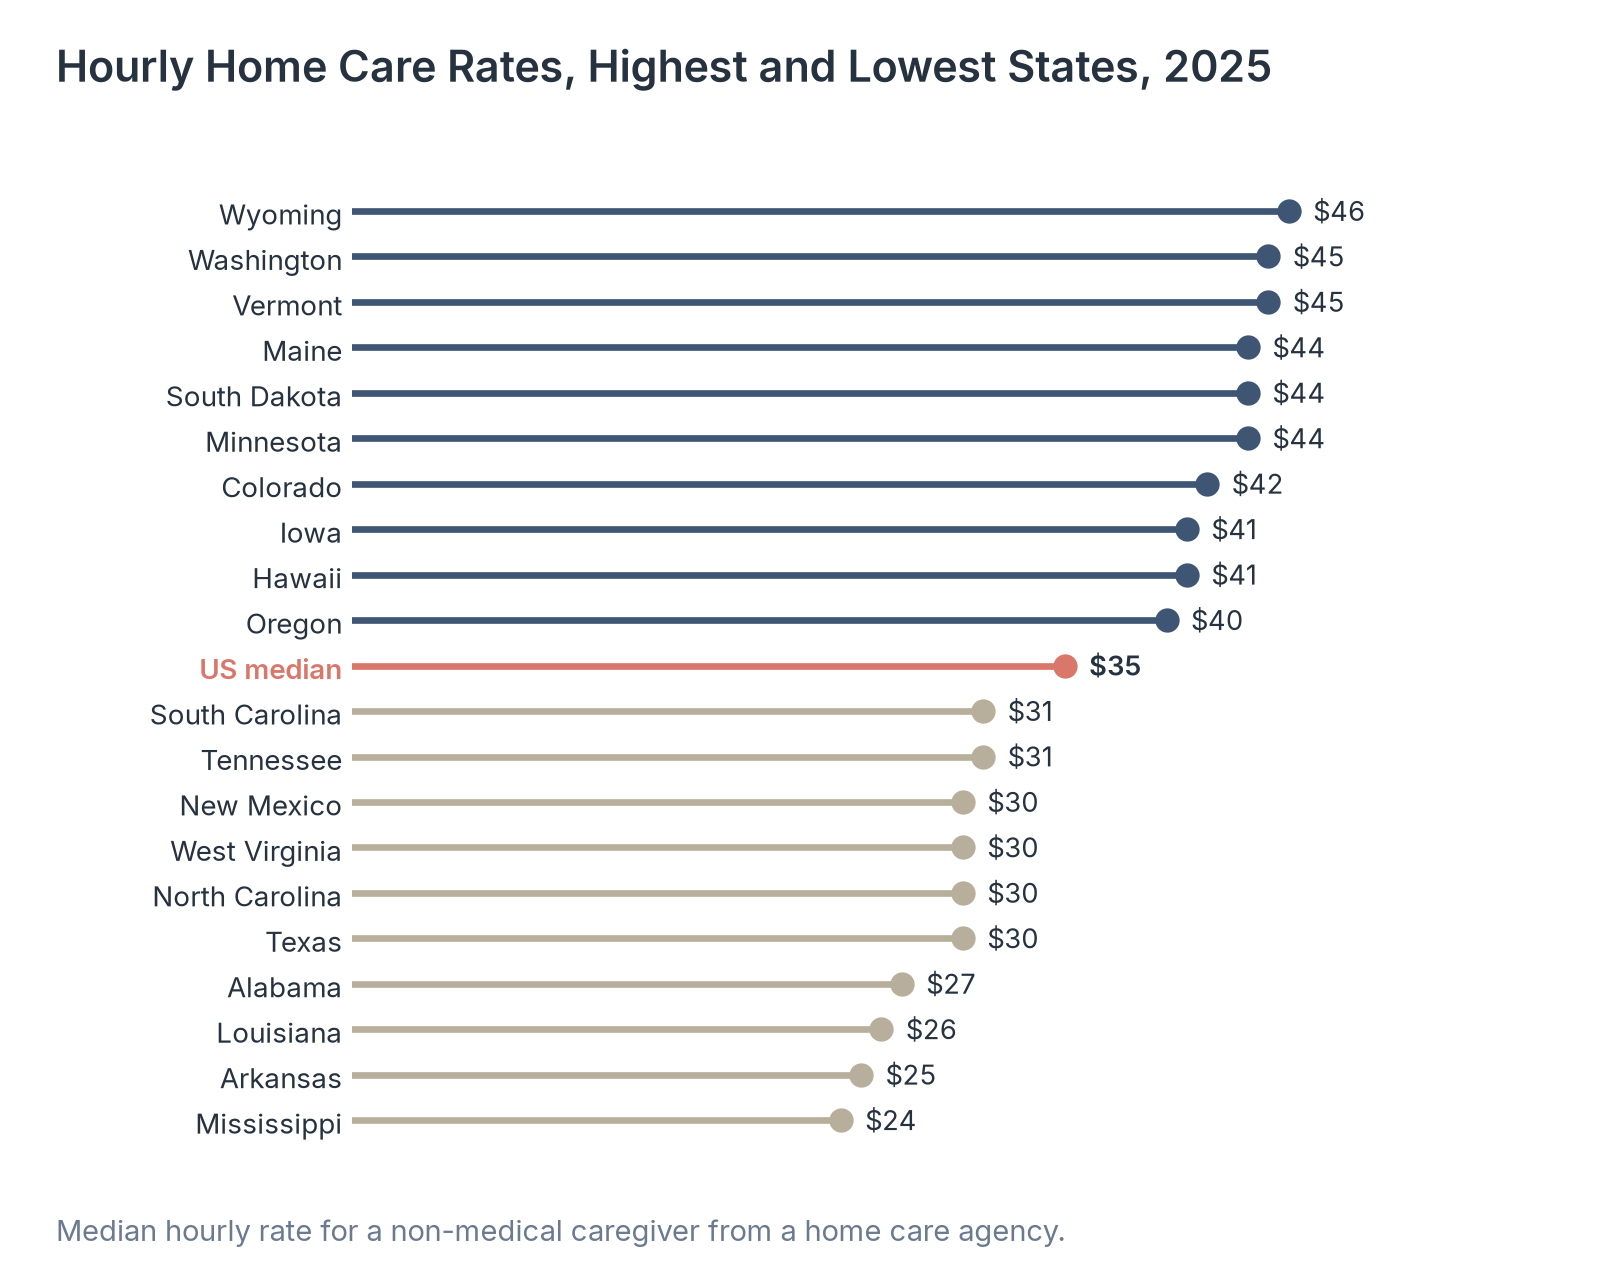
Paid caregivers who come to the home help many older adults keep living there. We compared the 2025 median hourly rate for a non-medical caregiver from a home care agency across states, along with the annual cost at 44 hours a week.
| State | Hourly rate | Annual cost at 44 hours a week |
|---|---|---|
| Wyoming | $46 | $105,248 |
| Vermont | $45 | $102,960 |
| Washington | $45 | $102,960 |
| Maine | $44 | $101,816 |
| South Dakota | $44 | $101,244 |
| Minnesota | $44 | $100,672 |
| Colorado | $42 | $94,952 |
| Iowa | $41 | $94,037 |
| Hawaii | $41 | $93,808 |
| Massachusetts | $40 | $91,520 |
| United States (median) | $35 | $80,080 |
| South Carolina | $31 | $71,786 |
| Tennessee | $31 | $70,928 |
| Texas | $30 | $68,640 |
| North Carolina | $30 | $68,640 |
| West Virginia | $30 | $68,640 |
| New Mexico | $30 | $68,640 |
| Alabama | $27 | $61,776 |
| Louisiana | $26 | $59,488 |
| Arkansas | $25 | $57,200 |
| Mississippi | $24 | $54,912 |
Source: CareScout, Cost of Care Survey 2025, Ranked Median Costs by State Data Tables. Non-medical caregiver services include help with bathing, dressing, and other daily activities, plus homemaker tasks.
Source: Healthcare Industry Reviews analysis of Genworth and CareScout Cost of Care Survey data, conducted November 2026.
Key Findings
- Wyoming had the highest median home care rate in 2025, at $46 an hour or $105,248 a year at 44 hours a week. Mississippi had the lowest, at $24 an hour or $54,912 a year.
- Full-time home care at the national median cost $80,080 a year in 2025, $5,680 more than the median for assisted living. Part-time help costs less: at 20 hours a week, the $35 median rate comes to $36,400 a year.
- In 14 states, the median home care rate was $40 an hour or more. The rates in Washington and Vermont, at $45, were close behind Wyoming.
Who Pays for Long-Term Services and Supports
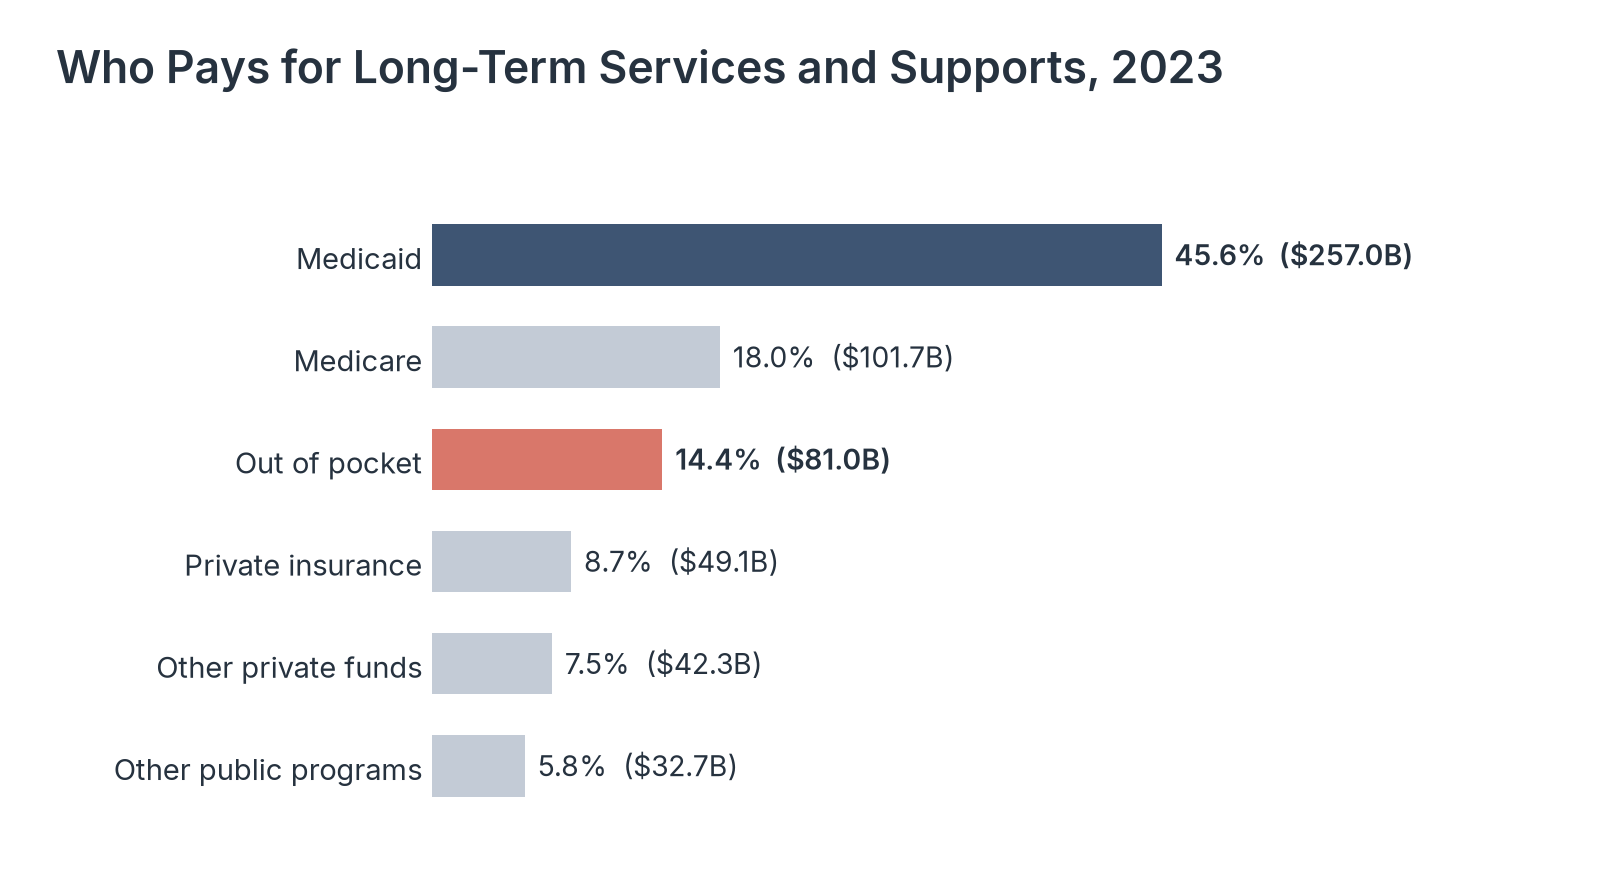
The prices above are the rates providers charge for care, but public programs cover a large share of the national bill. We looked at total spending on long-term services and supports by payer in 2023, using a federal analysis of national health spending data.
| Payer | Spending | Share of total |
|---|---|---|
| Medicaid | $257.0 billion | 45.6% |
| Medicare | $101.7 billion | 18.0% |
| Out of pocket | $81.0 billion | 14.4% |
| Private insurance | $49.1 billion | 8.7% |
| Other private funds | $42.3 billion | 7.5% |
| Other public programs | $32.7 billion | 5.8% |
| Total | $563.7 billion | 100% |
Source: Congressional Research Service, Who Pays for Long-Term Services and Supports?, IF10343, updated August 28, 2025, based on CMS National Health Expenditure Accounts data. Medicare spending covers skilled nursing facility and home health care. Shares may not add to 100% because of rounding.
Source: Healthcare Industry Reviews analysis of Genworth and CareScout Cost of Care Survey data, conducted November 2026.
Key Findings
- The United States spent $563.7 billion on long-term services and supports in 2023, which was 13.7% of the $4.1 trillion spent on personal health care.
- Public programs paid 69.4% of the total in 2023, down from 71.4% in 2014. Medicaid's share rose over the same decade, from 42.1% to 45.6%, while Medicare's and other public programs' shares fell.
- Private long-term care insurance and health insurance together paid 8.7% ($49.1 billion) in 2023, much less than the 14.4% people paid out of pocket.
What Long-Term Care Costs Mean for Families
For a family paying privately, a year in a private nursing home room cost more than $125,000 in 31 of the 49 states with data in 2025, and more than $200,000 in Oregon, Connecticut, and New York. Medicaid, which covers people with low incomes and few assets, remains the largest payer for that care.
Over the past five years, assisted living and home care costs grew faster than consumer prices, while nursing home prices grew at about the rate of inflation. Full-time help at home now costs more than a year of assisted living.
So if you are estimating what long-term care will cost, start with the state median for the type of care you expect to need, because state medians for a private nursing home room ranged from 30% below to 71% above the national figure in 2025.
Data Collection and Methodology
National and state costs come from the Cost of Care Survey, which CareScout has conducted since 2004. Genworth acquired CareScout in 2008 and long published the results, which CareScout now publishes.
For the 2025 survey, CareScout contacted 211,985 long-term care providers by phone and email from July through November 2025. It completed 6,014 surveys of home care providers, 608 of adult day health centers, 4,944 of assisted living communities, and 4,425 of nursing homes. Results are published for 434 regions based on metropolitan areas, and as state and national medians.
The national series uses the figures Genworth and CareScout published for each survey year. Chart values for 2004, 2008, 2012, and 2016 come from Genworth's 2020 trends page, and the published annual medians cover 2019, 2020, 2021, 2024, and 2025.
Annual figures for 2023 are calculated from the published daily, monthly, and hourly 2023 rates, using 365 days, 12 months, and 44 hours a week for 52 weeks, the survey's own conventions. Genworth reported averages through 2008 and medians from 2009. No survey was published for 2022.
In 2025, CareScout combined homemaker and home health aide services into one non-medical caregiver rate, which we use as the 2025 home care figure.
Consumer price growth uses the annual average of the Consumer Price Index for All Urban Consumers from the Bureau of Labor Statistics. All dollar figures are nominal. We calculated differences, ratios, and multi-year changes from the published values.
Payer figures come from the Congressional Research Service analysis of CMS National Health Expenditure Accounts data, which counts Medicare skilled nursing and home health spending as long-term services and supports.
Sources
- Healthcare Industry Reviews analysis of Genworth and CareScout Cost of Care Survey national and state cost data for 2004 to 2025 and Congressional Research Service long-term services and supports spending data for 2023, conducted November 2026.
- CareScout, Cost of Care Survey 2025: national median values and survey methodology. Survey conducted July through November 2025. CareScout's Median Cost Data Tables and Ranked Median Costs by State Data Tables, March 2026.
- Genworth Financial, Genworth and CareScout Release Cost of Care Survey Results for 2024. February 2025. CareScout, 2024 Cost of Care Survey Summary.
- Genworth, Cost of Care Trends and Insights, 2021 survey (archived page).
- Genworth, Cost of Care Trends and Insights, 2004 to 2020 (archived page, December 2020).
- Genworth, Cost of Care Trends and Insights, 2019 survey (archived page, December 2019).
- Congressional Research Service, Who Pays for Long-Term Services and Supports?, IF10343. Updated August 28, 2025.
- U.S. Bureau of Labor Statistics, Consumer Price Index for All Urban Consumers, All Items, annual averages, via the Federal Reserve Bank of St. Louis.