Maternal Mortality Statistics: 2026 Report
Published
Our analysts reviewed eight years of NCHS death and birth records covering 6,167 maternal deaths among 29.3 million live births from 2018 through 2025, review committee findings on 807 pregnancy-related deaths in 45 states, and WHO estimates for 21 high-income countries to show how often US women die from pregnancy-related causes, and which women face the highest risk, as of Q4 2026.
Key Findings
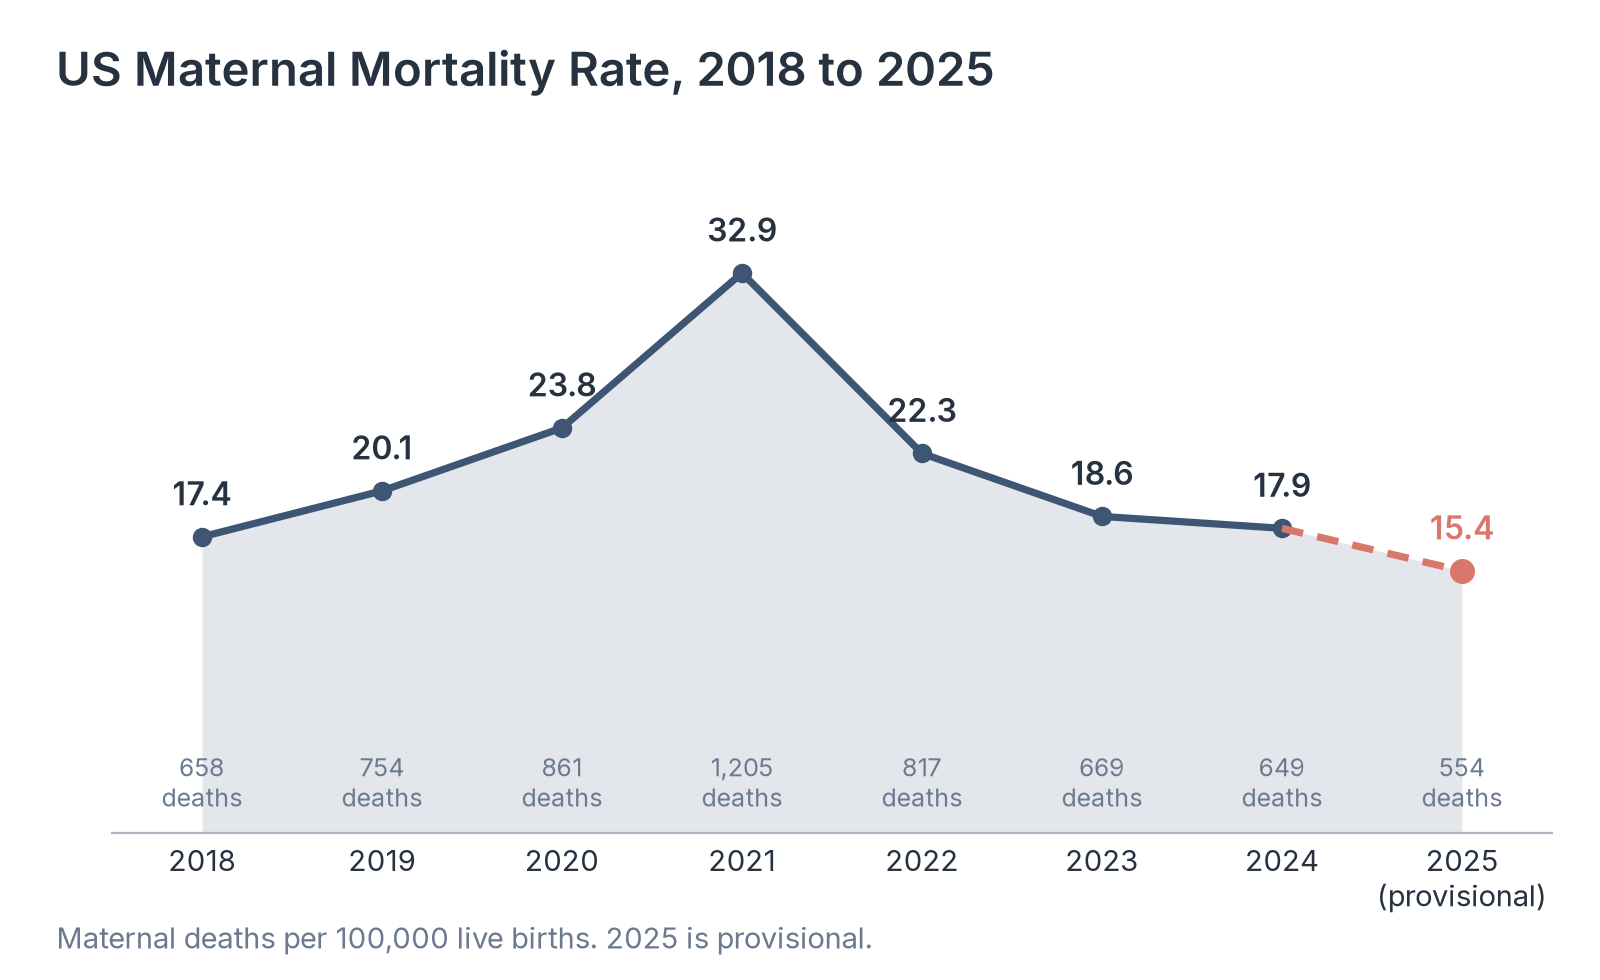
- Provisional data show 554 maternal deaths in the US in 2025, a rate of 15.4 per 100,000 live births, down from 17.9 in 2024 and 32.9 at the 2021 peak.
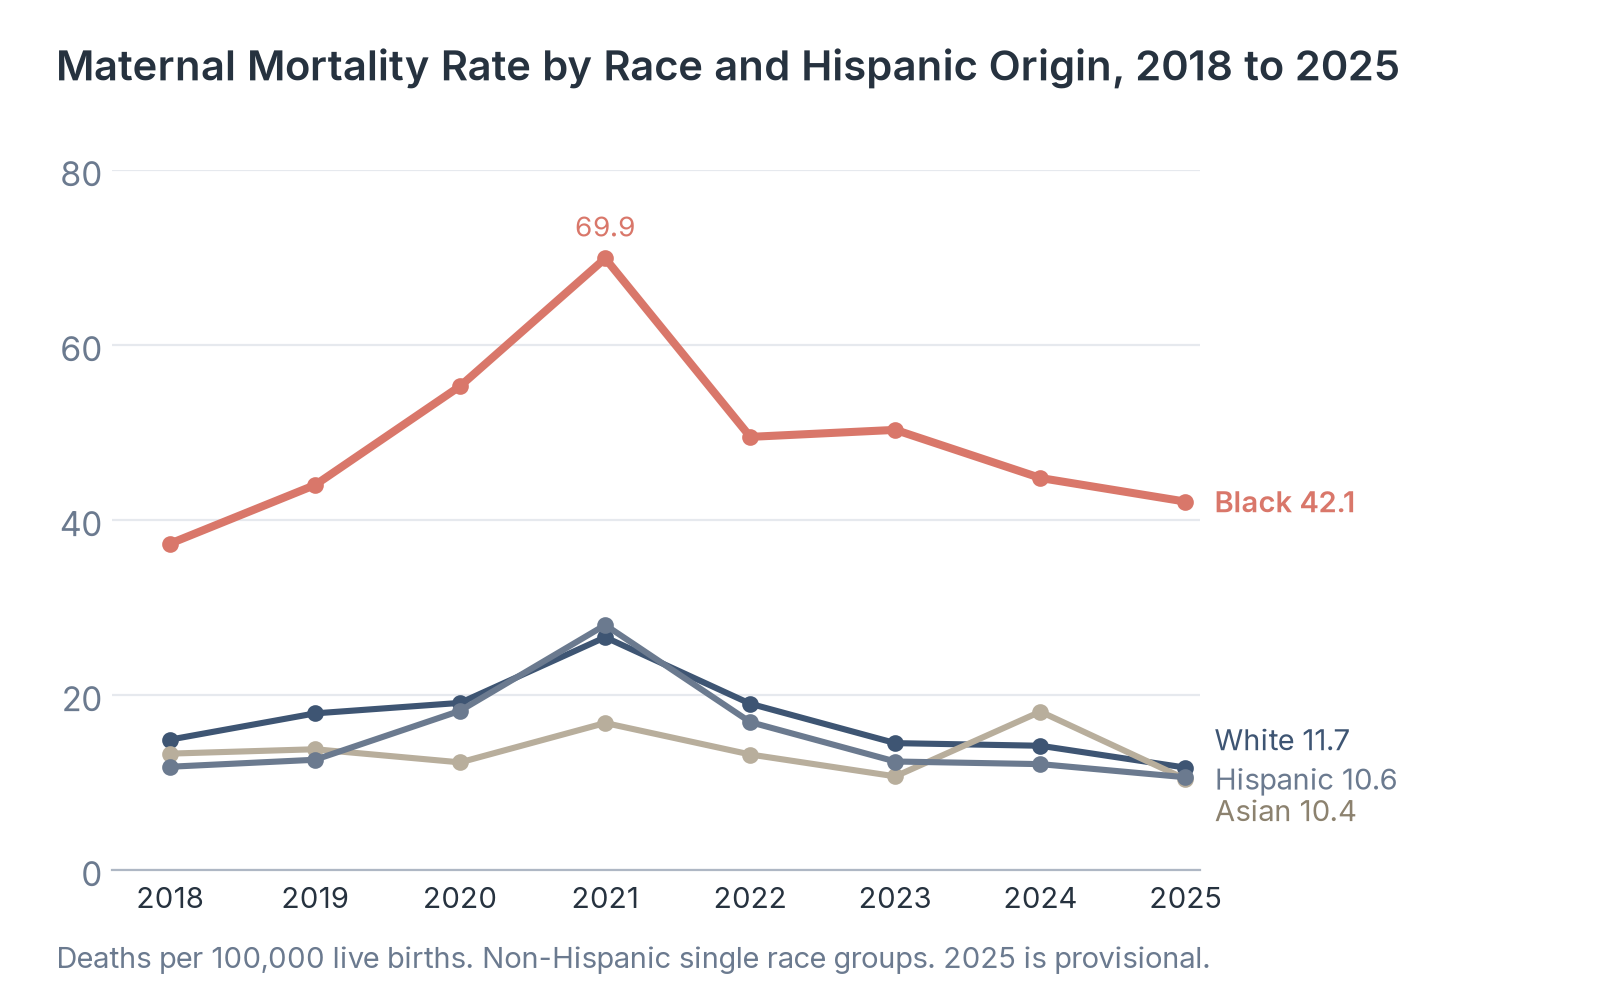
- Black women had a maternal mortality rate of 42.1 per 100,000 live births in 2025, 3.6 times the rate for White women (11.7).
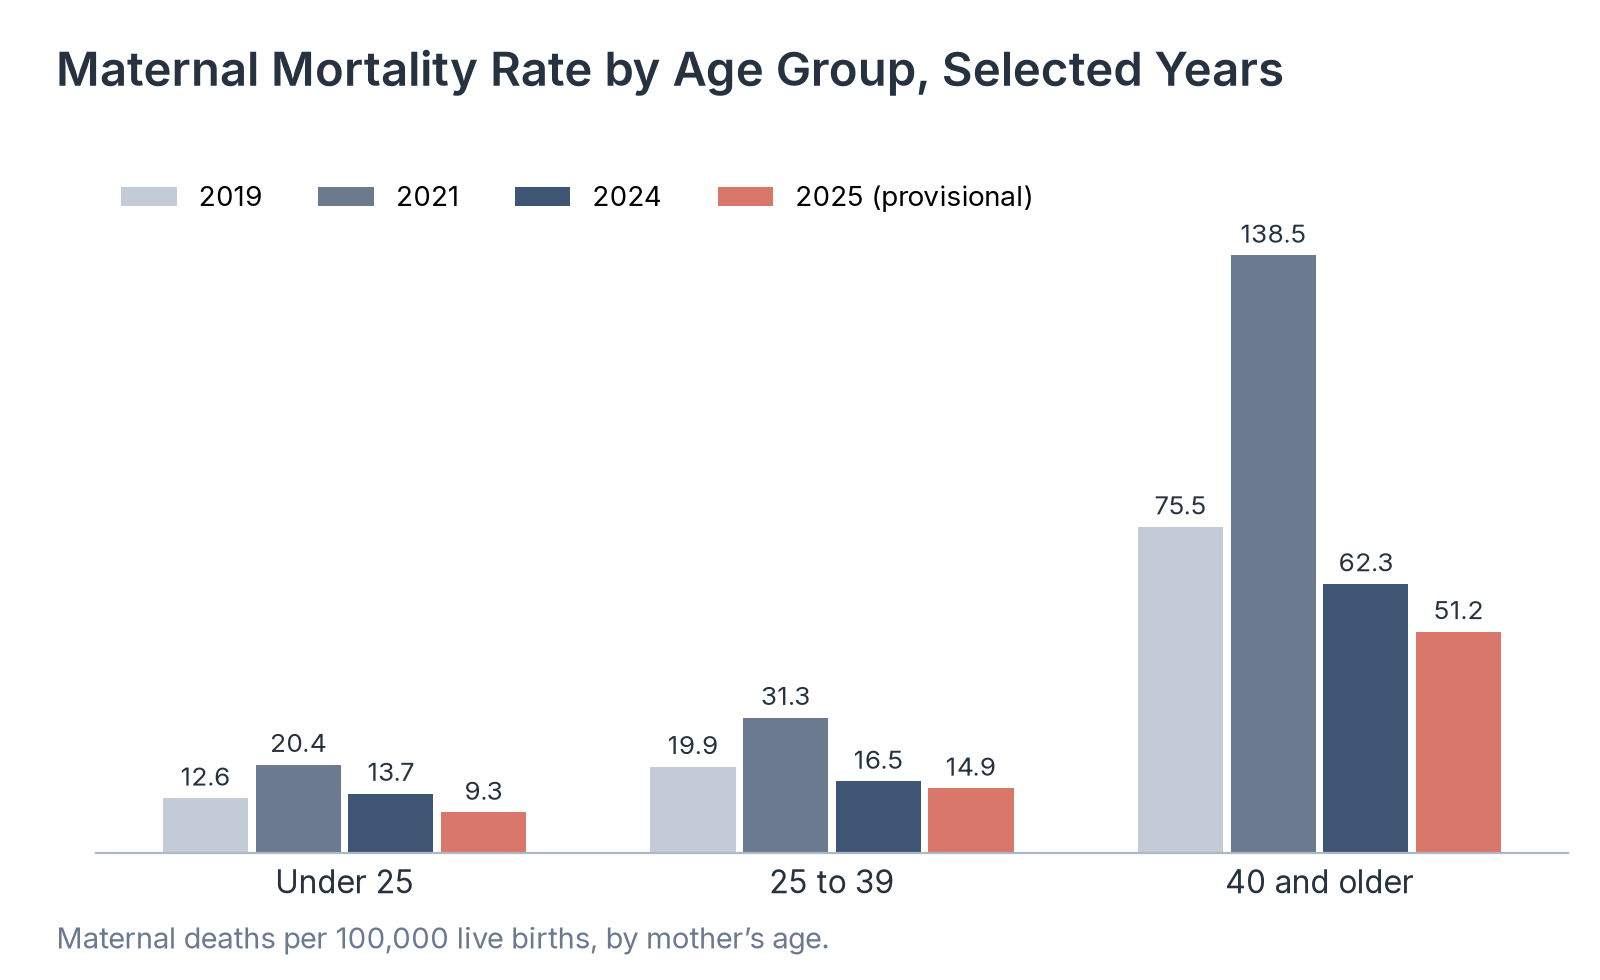
- Women aged 40 and older died of maternal causes at a rate of 51.2 per 100,000 live births in 2025, 5.5 times the rate for women under 25 (9.3).
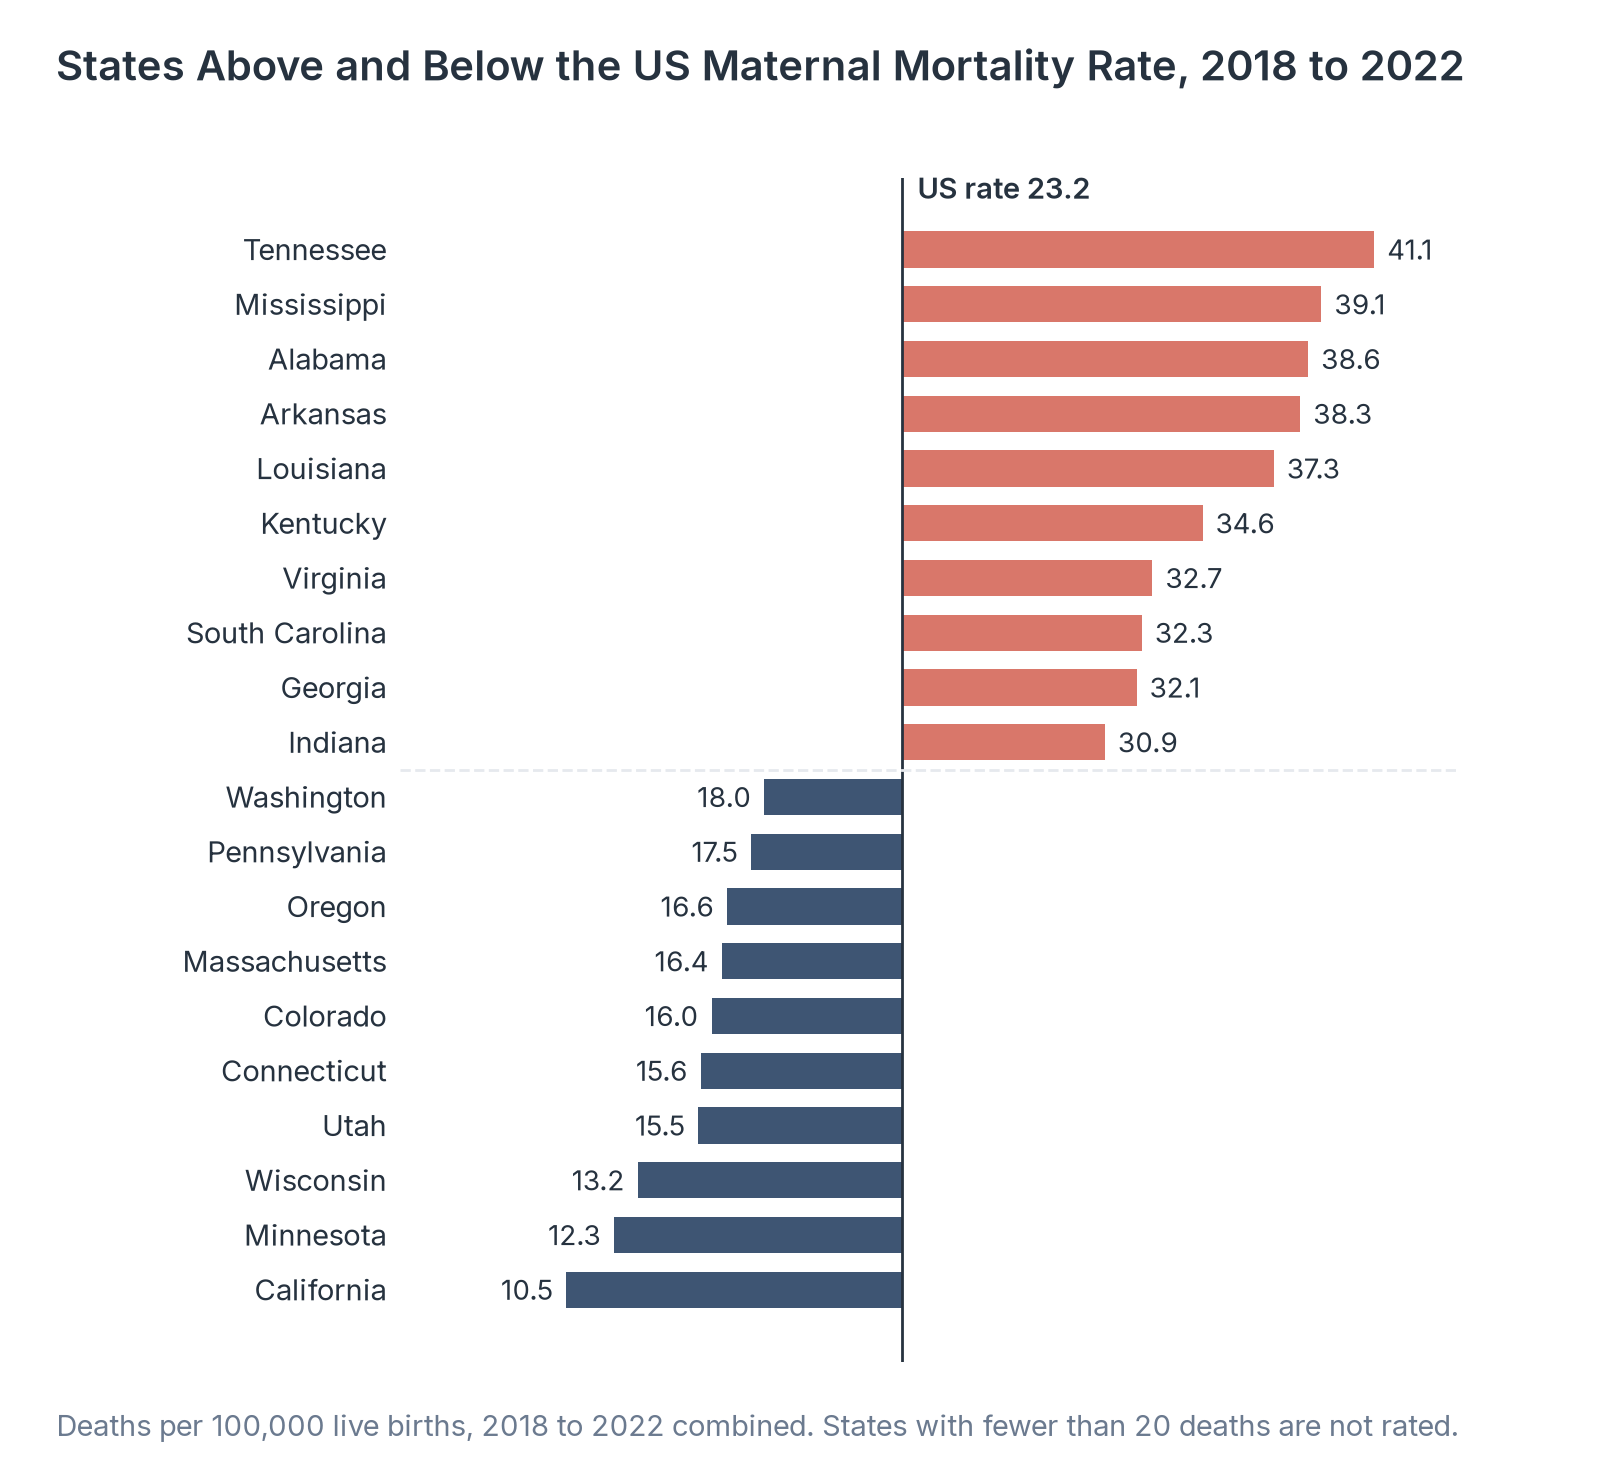
- Tennessee had the highest maternal mortality rate of any state for 2018 to 2022, at 41.1 per 100,000 live births, almost four times California's rate of 10.5.
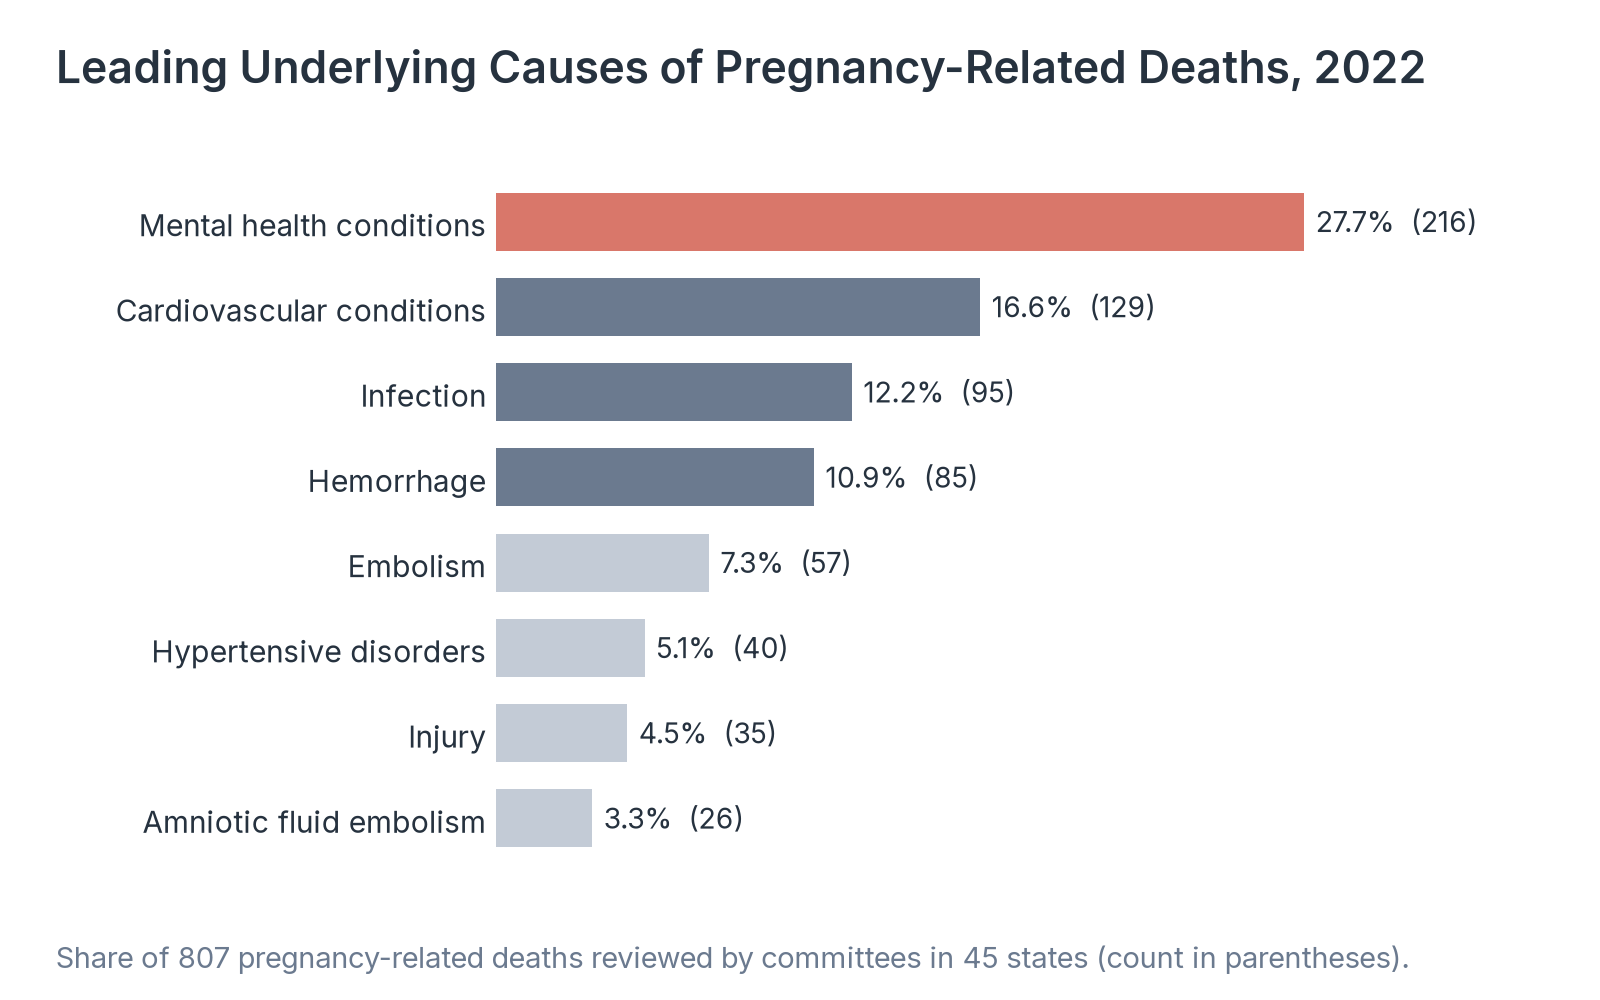
- Mental health conditions, including suicide and overdose, caused 27.7% of the 807 pregnancy-related deaths that review committees in 45 states examined for 2022, and the committees found 85.7% of those deaths preventable.
Deaths of women from causes tied to pregnancy climbed through the COVID-19 pandemic, peaked in 2021, and have fallen each year since. Federal statistics count a maternal death when a woman dies while pregnant or within 42 days after a pregnancy ends, from a cause related to or made worse by the pregnancy, and they express the rate per 100,000 live births.2 Those counts come from death certificates. State maternal mortality review committees take a second, slower look: they study each death within a full year of pregnancy using medical and social records, decide whether it was caused by the pregnancy, and judge whether it could have been prevented.5 The national rate is now lower than it was before the pandemic, but the gaps between groups of women and between states remain wide.
Our analysts compiled final NCHS maternal death and birth counts for 2018 through 2024 and provisional counts for 2025 and for the 12 months ending March 31, 2026, broken out by race and Hispanic origin and by age.2,3 We added NCHS state rates for 2018 to 2022 combined, the most recent state table published, and CDC findings from review committees on 807 pregnancy-related deaths in 45 states in 2022.4,5,6 For an international comparison, we used WHO estimates for 2023 for the US and 20 other high-income countries.7
In the following sections, we compare maternal mortality by year, race and Hispanic origin, age, and state, then look at the causes and timing of pregnancy-related deaths and at how the US compares with other high-income countries.
How the US Maternal Mortality Rate Has Changed Since 2018
The national rate is the figure most often quoted, so we started with eight years of deaths, births, and rates to show where the current number fits against the pandemic years.
| Year | Maternal deaths | Live births | Deaths per 100,000 live births | Change in rate from prior year |
|---|---|---|---|---|
| 2018 | 658 | 3,791,712 | 17.4 | |
| 2019 | 754 | 3,747,540 | 20.1 | +15.5% |
| 2020 | 861 | 3,613,647 | 23.8 | +18.4% |
| 2021 | 1,205 | 3,664,292 | 32.9 | +38.2% |
| 2022 | 817 | 3,667,758 | 22.3 | -32.2% |
| 2023 | 669 | 3,596,017 | 18.6 | -16.6% |
| 2024 | 649 | 3,628,934 | 17.9 | -3.8% |
| 2025 (provisional) | 554 | 3,606,407 | 15.4 | -14.0% |
| 12 months ending March 2026 (provisional) | 549 | 3,591,531 | 15.3 |
Source: National Center for Health Statistics (NCHS), Maternal Mortality Rates in the United States, 2024 (Health E-Stat 113), March 2026 (2018 to 2024); NCHS, VSRR Provisional Maternal Death Counts and Rates, data as of July 5, 2026 (2025 and 2026).
Source: Healthcare Industry Reviews analysis of NCHS final and provisional maternal mortality data, conducted November 2026.
Key Findings
- The rate rose from 17.4 per 100,000 live births in 2018 to 32.9 in 2021, when 1,205 women died of maternal causes. It has fallen every year since, to a provisional 15.4 in 2025, which is 53.2% below the 2021 peak.
- The provisional count of 554 maternal deaths in 2025 is 95 fewer than the 649 deaths in 2024. The rate for the 12 months ending March 2026 was 15.3, so the early 2026 data show no rebound.
- The provisional 2025 rate is the lowest in the eight-year series and well below the 2019 rate of 20.1, so the decline since 2021 has gone past a return to pre-pandemic levels. NCHS will publish final 2025 figures after late death certificates are coded.
How Maternal Mortality Differs by Race and Hispanic Origin
The gap between Black women and other women is the most reported feature of US maternal mortality, so we tracked the rate for each of the four largest race and Hispanic origin groups across all eight years.
| Group | 2018 | 2019 | 2020 | 2021 | 2022 | 2023 | 2024 | 2025 (provisional) |
|---|---|---|---|---|---|---|---|---|
| Black, non-Hispanic | 37.3 | 44.0 | 55.3 | 69.9 | 49.5 | 50.3 | 44.8 | 42.1 |
| White, non-Hispanic | 14.9 | 17.9 | 19.1 | 26.6 | 19.0 | 14.5 | 14.2 | 11.7 |
| Hispanic | 11.8 | 12.6 | 18.2 | 28.0 | 16.9 | 12.4 | 12.1 | 10.6 |
| Asian, non-Hispanic | 13.3 | 13.8 | 12.3 | 16.8 | 13.2 | 10.7 | 18.1 | 10.4 |
| All women | 17.4 | 20.1 | 23.8 | 32.9 | 22.3 | 18.6 | 17.9 | 15.4 |
| Ratio of Black to White rate | 2.5 | 2.5 | 2.9 | 2.6 | 2.6 | 3.5 | 3.2 | 3.6 |
Source: National Center for Health Statistics (NCHS), Maternal Mortality Rates in the United States, 2024 (Health E-Stat 113), March 2026; NCHS, VSRR Provisional Maternal Death Counts and Rates, data as of July 5, 2026. Race groups are single race. Rates for American Indian or Alaska Native and for Native Hawaiian or Other Pacific Islander women are not published because yearly counts are below 20.
Source: Healthcare Industry Reviews analysis of NCHS final and provisional maternal mortality data, conducted November 2026.
Key Findings
- Black women had the highest rate in every year, peaking at 69.9 per 100,000 live births in 2021. Their provisional 2025 rate of 42.1 is the lowest since 2018 but still above their 2018 rate of 37.3.
- The rate for White women fell from 26.6 in 2021 to a provisional 11.7 in 2025, faster than the rate for Black women. As a result, the ratio of the Black rate to the White rate rose from 2.5 in 2018 to 3.6 in 2025.
- Hispanic women had the steepest pandemic rise in percentage terms, from 12.6 in 2019 to 28.0 in 2021, and their provisional 2025 rate is 10.6. White and Hispanic women account for 438 of the 651 fewer maternal deaths between 2021 and 2025, so the national decline has come with a wider gap between Black and White women.
How Maternal Mortality Rises With Age
Births to women aged 40 and older have grown each year since 2018, so we compared the rate across three age groups to show how much age raises the risk.
| Age group | 2018 | 2019 | 2020 | 2021 | 2022 | 2023 | 2024 | 2025 (provisional) |
|---|---|---|---|---|---|---|---|---|
| Under 25 | 10.6 | 12.6 | 13.8 | 20.4 | 14.4 | 12.5 | 13.7 | 9.3 |
| 25 to 39 | 16.6 | 19.9 | 22.8 | 31.3 | 21.1 | 18.1 | 16.5 | 14.9 |
| 40 and older | 81.9 | 75.5 | 107.9 | 138.5 | 87.1 | 59.8 | 62.3 | 51.2 |
| Births to women 40 and older | 126,956 | 129,761 | 129,799 | 135,735 | 144,657 | 147,054 | 152,391 | 154,246 |
Source: National Center for Health Statistics (NCHS), Maternal Mortality Rates in the United States, 2024 (Health E-Stat 113), March 2026; NCHS, VSRR Provisional Maternal Death Counts and Rates, data as of July 5, 2026.
Source: Healthcare Industry Reviews analysis of NCHS final and provisional maternal mortality data, conducted November 2026.
Key Findings
- Women aged 40 and older had a provisional rate of 51.2 per 100,000 live births in 2025, compared with 14.9 for women aged 25 to 39 and 9.3 for women under 25. Their rate reached 138.5 in 2021.
- Births to women aged 40 and older rose from 126,956 in 2018 to 152,391 in 2024, a 20.0% increase, while total births fell 4.3%. In 2024, this age group had 4.2% of births and 14.6% of maternal deaths.
- NCHS reports that wrongly checked pregnancy boxes on death certificates have inflated maternal death counts most for women aged 40 and older, and it now reviews those records by hand. In every year of the series, the rate for women 40 and older is at least four times the rate for women under 25, so later pregnancies carry a much higher risk for the mother.
Which States Have the Highest Maternal Mortality Rates
Most states record too few maternal deaths in a single year for a stable rate, so NCHS combines five years of data. We ranked every state with a published rate for 2018 to 2022 against the national figure.
| State | Rank | Maternal deaths, 2018 to 2022 | Deaths per 100,000 live births | Difference from US rate |
|---|---|---|---|---|
| Tennessee | 1 | 166 | 41.1 | +17.9 |
| Mississippi | 2 | 70 | 39.1 | +15.9 |
| Alabama | 3 | 112 | 38.6 | +15.4 |
| Arkansas | 4 | 69 | 38.3 | +15.1 |
| Louisiana | 5 | 108 | 37.3 | +14.1 |
| Kentucky | 6 | 91 | 34.6 | +11.4 |
| Virginia | 7 | 158 | 32.7 | +9.5 |
| South Carolina | 8 | 92 | 32.3 | +9.1 |
| Georgia | 9 | 201 | 32.1 | +8.9 |
| Indiana | 10 | 124 | 30.9 | +7.7 |
| Arizona | 11 | 118 | 30.0 | +6.8 |
| Oklahoma | 12 | 72 | 29.6 | +6.4 |
| Texas | 13 | 532 | 28.2 | +5.0 |
| New Mexico | 14 | 31 | 28.0 | +4.8 |
| North Carolina | 15 | 159 | 26.7 | +3.5 |
| New Jersey | 16 | 131 | 26.0 | +2.8 |
| Nebraska | 17 | 31 | 25.1 | +1.9 |
| Ohio | 18 | 161 | 24.5 | +1.3 |
| Florida | 19 | 263 | 24.1 | +0.9 |
| West Virginia | 20 | 21 | 23.9 | +0.7 |
| Missouri | 21 | 84 | 23.8 | +0.6 |
| Kansas | 22 | 40 | 22.8 | -0.4 |
| New York | 23 | 241 | 22.4 | -0.8 |
| Maryland | 24 | 74 | 21.3 | -1.9 |
| Nevada | 25 | 35 | 20.4 | -2.8 |
| Idaho | 26 | 22 | 20.0 | -3.2 |
| Iowa | 27 | 36 | 19.5 | -3.7 |
| Michigan | 28 | 101 | 19.1 | -4.1 |
| Illinois | 29 | 123 | 18.1 | -5.1 |
| Washington | 30 | 76 | 18.0 | -5.2 |
| Pennsylvania | 31 | 116 | 17.5 | -5.7 |
| Oregon | 32 | 34 | 16.6 | -6.6 |
| Massachusetts | 33 | 56 | 16.4 | -6.8 |
| Colorado | 34 | 50 | 16.0 | -7.2 |
| Connecticut | 35 | 27 | 15.6 | -7.6 |
| Utah | 36 | 36 | 15.5 | -7.7 |
| Wisconsin | 37 | 41 | 13.2 | -10.0 |
| Minnesota | 38 | 40 | 12.3 | -10.9 |
| California | 39 | 228 | 10.5 | -12.7 |
| Alaska | 12 | Not rated | ||
| Delaware | 9 | Not rated | ||
| District of Columbia | 12 | Not rated | ||
| Hawaii | 13 | Not rated | ||
| Maine | 7 | Not rated | ||
| Montana | 17 | Not rated | ||
| New Hampshire | 11 | Not rated | ||
| North Dakota | 11 | Not rated | ||
| Rhode Island | 9 | Not rated | ||
| South Dakota | 16 | Not rated | ||
| Vermont | 1 | Not rated | ||
| Wyoming | 7 | Not rated | ||
| United States | 4,295 | 23.2 |
Source: KFF State Health Facts, Maternal Deaths and Mortality Rates per 100,000 Live Births, from NCHS state data for 2018 to 2022. States with fewer than 20 maternal deaths over the five years are not rated.
Source: Healthcare Industry Reviews analysis of NCHS final and provisional maternal mortality data, conducted November 2026.
Key Findings
- Tennessee (41.1), Mississippi (39.1), Alabama (38.6), Arkansas (38.3), and Louisiana (37.3) had the highest rates for 2018 to 2022. Kentucky, Virginia, South Carolina, and Georgia also had rates above 32 per 100,000 live births.
- California had the lowest rate, at 10.5, followed by Minnesota at 12.3 and Wisconsin at 13.2. Texas recorded the most maternal deaths, 532 over the five years, at a rate of 28.2, compared with 228 deaths in California.
- Eleven states and the District of Columbia had fewer than 20 maternal deaths over the five years, so they have no published rate. Tennessee's rate was 1.8 times the national rate of 23.2 and California's was less than half of it, so a national figure says little about the risk in any one state.
What Causes Pregnancy-Related Deaths
Death certificates record a cause of death but little about the circumstances, so we turned to the state review committees, which assign an underlying cause to every pregnancy-related death within a year of pregnancy.
| Underlying cause | 2017 to 2019 | 2020 | 2021 | 2022 | Deaths, 2022 |
|---|---|---|---|---|---|
| Mental health conditions | 22.7% | 22.5% | 22.5% | 27.7% | 216 |
| Cardiovascular conditions | 21.3% | 16.6% | 10.4% | 16.6% | 129 |
| Infection | 9.2% | 16.4% | 33.2% | 12.2% | 95 |
| Hemorrhage | 13.7% | 11.2% | 8.7% | 10.9% | 85 |
| Embolism | 8.7% | 8.6% | 5.3% | 7.3% | 57 |
| Hypertensive disorders of pregnancy | 6.5% | 7.0% | 3.5% | 5.1% | 40 |
| Injury | 3.5% | 2.2% | 2.2% | 4.5% | 35 |
| Amniotic fluid embolism | 3.7% | 3.7% | 5.1% | 3.3% | 26 |
| Stroke not caused by high blood pressure in pregnancy | 2.5% | 2.0% | 1.8% | 3.1% | 24 |
| Cancer | 1.9% | 1.0% | 1.0% | 2.2% | 17 |
| Pregnancy-related deaths reviewed | 1,002 | 525 | 908 | 807 | |
| States reporting | 36 | 38 | 46 | 45 |
Source: Centers for Disease Control and Prevention (CDC), Pregnancy-Related Deaths: Data from Maternal Mortality Review Committees, updated April 20, 2026. Shares exclude deaths with a missing or unknown cause. Infection includes COVID-19. Cardiovascular conditions include cardiomyopathy.
Source: Healthcare Industry Reviews analysis of CDC maternal mortality review committee data, conducted November 2026.
Key Findings
- Mental health conditions were the leading underlying cause in every period, and their share rose to 27.7% of pregnancy-related deaths in 2022, from 22.5% in 2021. Of the 216 deaths from mental health conditions in 2022, 45.4% were suicides and 51.4% involved poisoning or overdose.
- Infection caused 33.2% of pregnancy-related deaths in 2021, when COVID-19 alone accounted for 27.7% of them. By 2022, infection had dropped to 12.2%, and cardiovascular conditions returned to second place at 16.6%.
- Hemorrhage, embolism, and hypertensive disorders of pregnancy together accounted for 23.3% of 2022 deaths, less than mental health conditions alone. Programs aimed only at emergencies during delivery therefore reach a shrinking share of pregnancy-related deaths, while depression and substance use care reach the largest one.
When Pregnancy-Related Deaths Happen and How Many Are Preventable
The timing of a death shows which part of care failed: prenatal care, the delivery itself, or the months after birth. The committees also decide for each death whether something could reasonably have changed the outcome.
| Timing of death | 2017 to 2019 | 2020 | 2021 | 2022 |
|---|---|---|---|---|
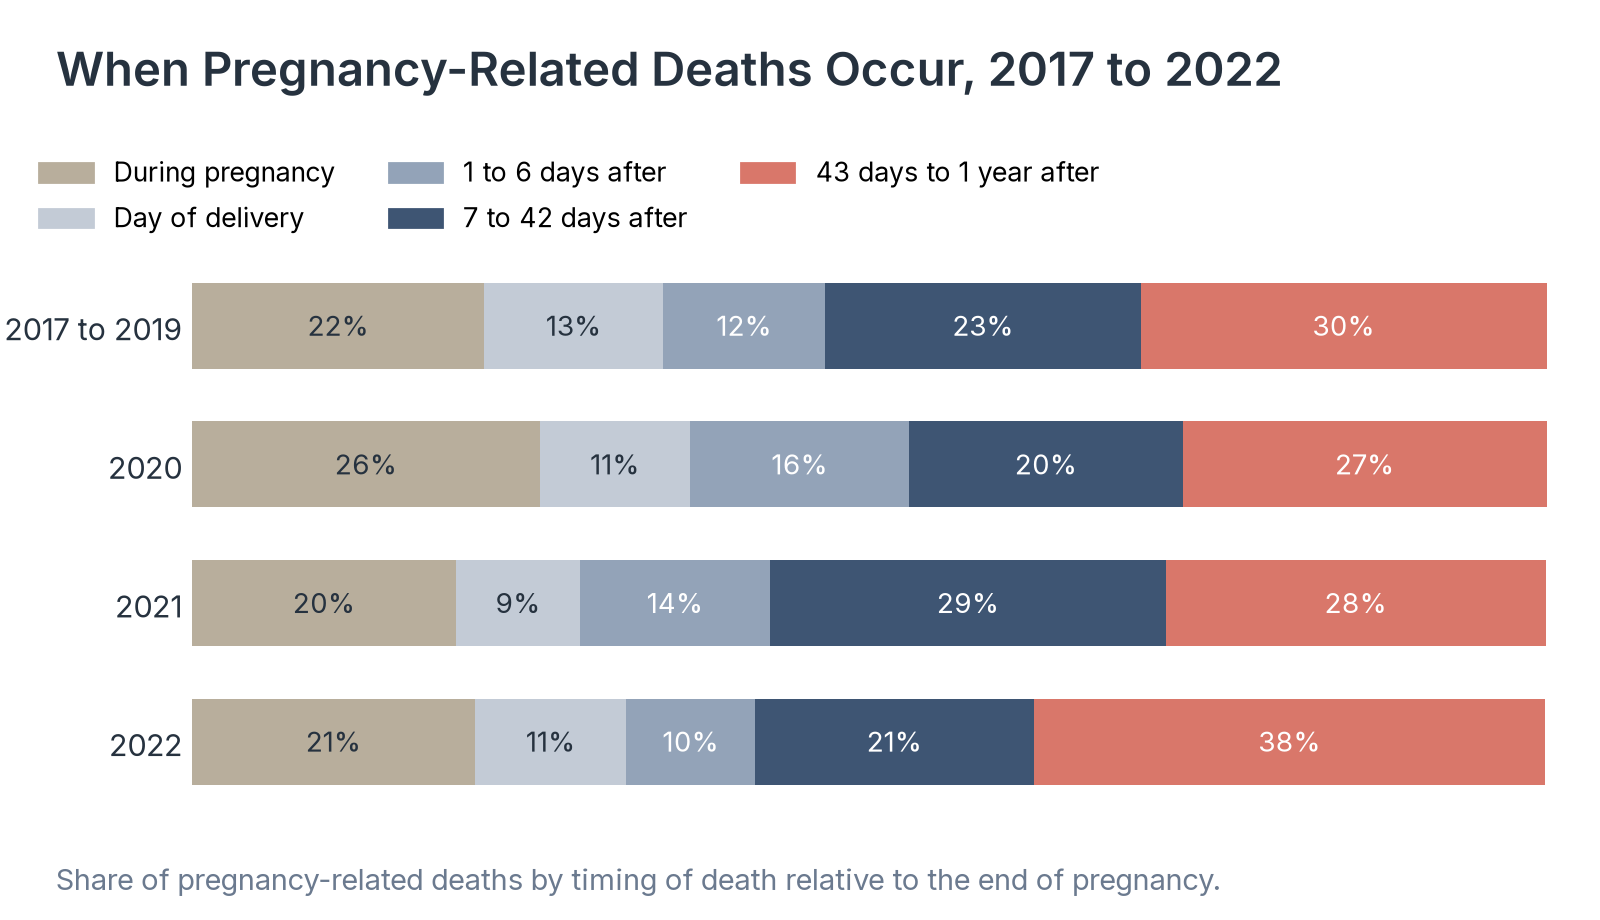
| During pregnancy | 21.6% | 25.7% | 19.5% | 20.9% |
| Day of delivery | 13.2% | 11.1% | 9.1% | 11.2% |
| 1 to 6 days after pregnancy | 12.0% | 16.2% | 14.1% | 9.5% |
| 7 to 42 days after pregnancy | 23.3% | 20.2% | 29.2% | 20.6% |
| 43 days to 1 year after pregnancy | 30.0% | 26.9% | 28.1% | 37.8% |
| Share of deaths found preventable | 84.2% | 83.5% | 87.0% | 85.7% |
Source: Centers for Disease Control and Prevention (CDC), Pregnancy-Related Deaths: Data from Maternal Mortality Review Committees, updated April 20, 2026; CDC, About the Data: MMRIA. Preventability excludes deaths where the committee could not decide.
Source: Healthcare Industry Reviews analysis of CDC maternal mortality review committee data, conducted November 2026.
Key Findings
- In 2022, 37.8% of pregnancy-related deaths happened between 43 days and one year after the end of pregnancy, up from 30.0% in 2017 to 2019. These late deaths fall outside the 42-day window that NCHS uses for the national maternal mortality rate.
- Only 11.2% of 2022 deaths occurred on the day of delivery, and 20.9% occurred during pregnancy. Overall, 67.9% happened in the year after pregnancy ended, counting from the day after delivery.
- Review committees found 85.7% of 2022 pregnancy-related deaths preventable, and the share has been between 83.5% and 87.0% in every period CDC reports. Because most deaths happen weeks or months after birth, many of the chances to prevent them come after a mother leaves the hospital.
How the US Compares With Other High-Income Countries
Countries count maternal deaths in different ways, so we used WHO estimates, which apply one statistical model to every country and allow a fair comparison.
| Country | Rank | Maternal deaths per 100,000 live births | Uncertainty range |
|---|---|---|---|
| United States | 1 | 17 | 13 to 21 |
| Canada | 2 | 12 | 8 to 18 |
| Chile | 3 | 10 | 7 to 13 |
| United Kingdom | 4 | 8 | 6 to 12 |
| Finland | 5 | 8 | 5 to 14 |
| France | 6 | 7 | 6 to 10 |
| New Zealand | 7 | 7 | 4 to 9 |
| Italy | 8 | 6 | 5 to 9 |
| Austria | 9 | 6 | 4 to 11 |
| Switzerland | 10 | 5 | 4 to 8 |
| Denmark | 11 | 4 | 3 to 5 |
| South Korea | 12 | 4 | 3 to 5 |
| Belgium | 13 | 4 | 3 to 5 |
| Netherlands | 14 | 4 | 3 to 6 |
| Ireland | 15 | 4 | 3 to 5 |
| Sweden | 16 | 4 | 3 to 6 |
| Germany | 17 | 4 | 3 to 5 |
| Spain | 18 | 3 | 2 to 4 |
| Japan | 19 | 3 | 2 to 4 |
| Australia | 20 | 2 | 2 to 3 |
| Norway | 21 | 1 | 1 to 2 |
Source: World Health Organization (WHO) Global Health Observatory, maternal mortality ratio estimates for 2023, published April 2025.
Source: Healthcare Industry Reviews analysis of WHO Global Health Observatory data, conducted November 2026.
Key Findings
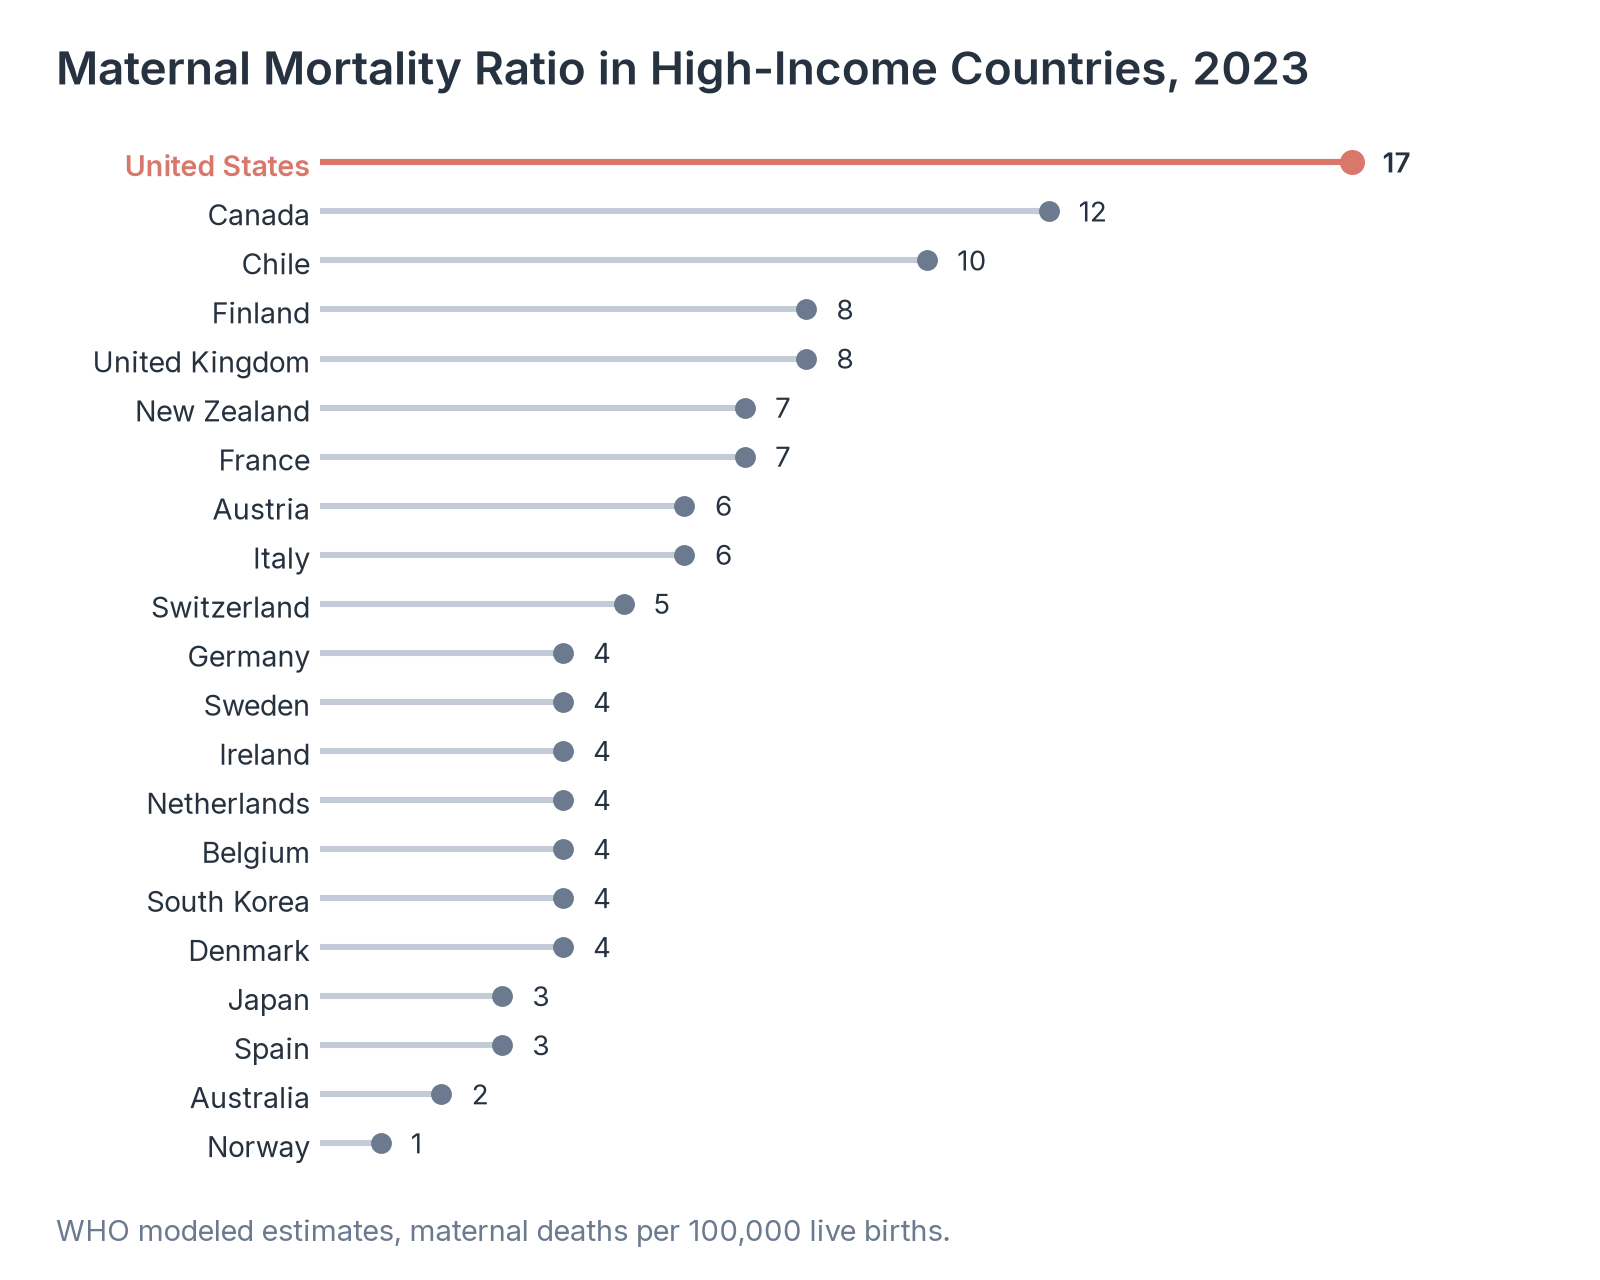
- WHO estimated the US maternal mortality ratio at 17 per 100,000 live births in 2023, the highest of the 21 high-income countries in our comparison. Canada was second at 12, and Chile third at 10.
- The median of the other 20 countries was 4 per 100,000 live births, and seven of them, including Germany, Sweden, and South Korea, had an estimate of 4. Norway had the lowest estimate, at 1.
- WHO's US estimate for 2023 is lower than the NCHS rate of 18.6 because WHO adjusts each country's data with a statistical model. Using either figure, the US rate is well above every peer country in the comparison.
What the Maternal Mortality Figures Mean for Families and Hospitals
For families, the falling national rate means fewer women are dying in the weeks around childbirth than at any point in the past eight years. The risk is still far from even: Black mothers and mothers over 40 face several times the risk of other women, a mother in Tennessee faces almost four times the risk of one in California, and most pregnancy-related deaths now happen after the mother has gone home.
Review committees judge more than four in five of these deaths preventable, and the causes they find most often, mental health conditions, cardiovascular conditions, and infection, call for care that continues for months after delivery. That puts more weight on postpartum coverage, follow-up visits, and mental health care in the year after birth.
So if you are reporting a maternal mortality figure, say whether it is the 42-day NCHS rate or the one-year review committee count, and note whether it is final or provisional, because the two measures and the two data stages give different numbers.
Data Collection and Methodology
National, age, and race figures for 2018 to 2024 are final NCHS counts from the National Vital Statistics System mortality and natality files. Maternal deaths are deaths with an underlying cause coded A34, O00 to O95, or O98 to O99 under the International Classification of Diseases, 10th Revision, occurring during pregnancy or within 42 days after it ends. Figures for 2025 and for the 12 months ending March 31, 2026 are provisional 12-month counts from the NCHS Vital Statistics Rapid Release data, as of July 5, 2026, and may change. Race groups are single race and non-Hispanic; Hispanic women may be of any race.
State rates combine 2018 to 2022 deaths and births by state of residence, as published by NCHS and republished by KFF; NCHS does not publish a rate for states with fewer than 20 deaths. Causes, timing, and preventability come from maternal mortality review committees that shared data with CDC: 36 states for 2017 to 2019, 38 for 2020, 46 for 2021, and 45 for 2022. These committees review pregnancy-related deaths up to one year after pregnancy, so their totals differ from the NCHS 42-day counts. Shares exclude deaths with missing or unknown values. International figures are WHO modeled estimates for 2023, rounded to whole numbers as WHO publishes them, with WHO's 80% uncertainty range. We calculated products, differences, and ratios from the published values.
Sources
- Healthcare Industry Reviews analysis of NCHS maternal mortality data for 2018 to 2026, CDC maternal mortality review committee data for 2017 to 2022, and WHO maternal mortality estimates for 2023, conducted November 2026.
- Hoyert DL. Maternal Mortality Rates in the United States, 2024. NCHS Health E-Stats, No. 113. March 2026.
- NCHS. Provisional Maternal Mortality Rates and VSRR Provisional Maternal Death Counts and Rates (data file). Data as of July 5, 2026.
- KFF. Maternal Deaths and Mortality Rates per 100,000 Live Births, State Health Facts, 2018 to 2022, from NCHS, Maternal deaths and mortality rates: Each state, the District of Columbia, United States, 2018 to 2022.
- CDC. Pregnancy-Related Deaths: Data from Maternal Mortality Review Committees. Updated April 20, 2026.
- CDC. About the Data: Maternal Mortality Review Information Application (MMRIA).
- World Health Organization. Global Health Observatory, Maternal mortality ratio (per 100 000 live births), 2023 estimates, published April 2025.