Medical Malpractice Payout Statistics: 2026 Report
Published
Our analysts reviewed 523,548 medical malpractice payments reported to the National Practitioner Data Bank for payment years 1991 to 2025 to show how much is paid to settle malpractice claims in the United States, how that has changed over 35 years, and where the money goes by state and practitioner type, as of Q4 2026.
Key Findings
- Medical malpractice payments on behalf of US health care practitioners totaled $5.23 billion in 2025 across 11,263 payments, the highest yearly total in nominal dollars in National Practitioner Data Bank records that start in 1990.
- The average malpractice payment was $464,675 in 2025, up from $133,484 in 1991. After adjusting for inflation, the average rose 49% over that period.
- 1,466 payments, 13.0% of the 2025 total, were for $1 million or more, up from 7.8% in 2015. Those payments made up 48.0% of all dollars paid.
- New York had the highest malpractice payouts of any state in 2025, $764.6M, followed by Pennsylvania ($468.4M) and Florida ($463.6M).
- The number of payments fell 43%, from 19,772 in 2001 to 11,263 in 2025.
A medical malpractice payment is money paid to settle a claim or satisfy a court judgment against a doctor, nurse, dentist, or other licensed practitioner for harm a patient says was caused by their care. The money can come from a malpractice insurance policy or from another payer.
Each payment made for the benefit of a practitioner must be reported to the National Practitioner Data Bank (NPDB), a confidential federal database that hospitals, health plans, and state licensing boards can search. Those reports give a national record of malpractice payouts going back to 1990, and they show fewer payments today than in the early 2000s, with larger amounts per payment.
Our analysts pulled every medical malpractice payment report in the NPDB Data Analysis Tool for payment years 1991 to 2025, along with the data bank's breakdowns by state, practitioner type, and payment size.2 We measured total payouts in nominal and inflation-adjusted dollars, the number of payments, and the average payment for each year. The 2025 figures include reports received through June 30, 2026.
In the following sections, we cover total malpractice payouts since 1991, the number of payments per year, the average payment, payments by size, payouts by state, and payments by practitioner type.
How Total Malpractice Payouts Have Changed Since 1991
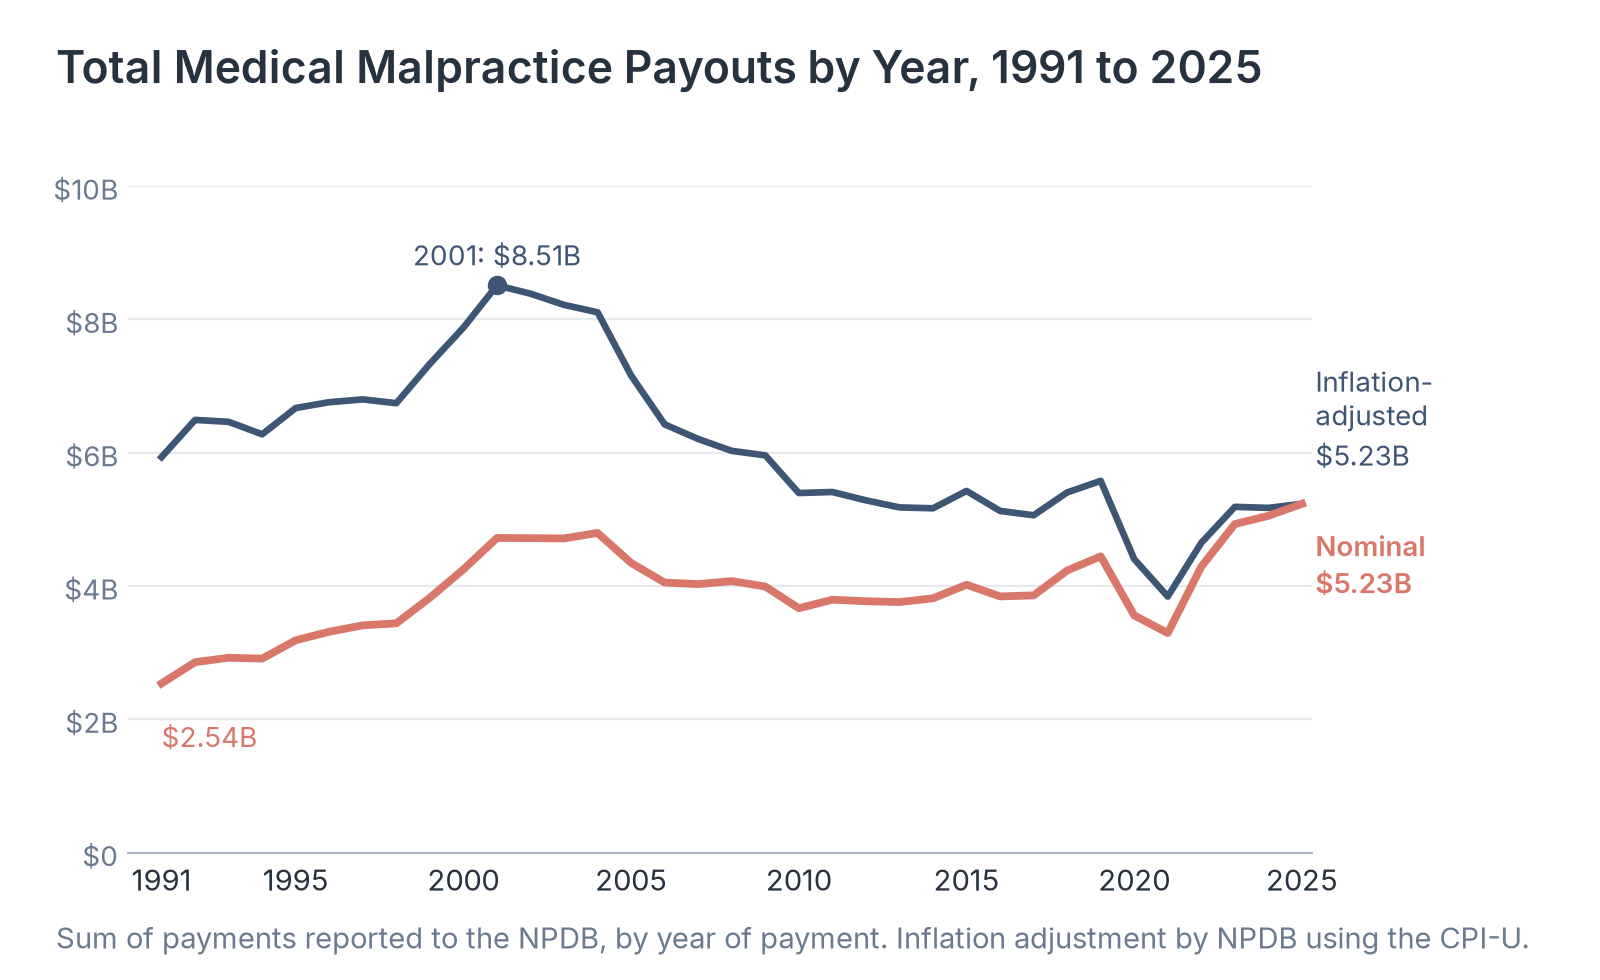
Total payouts show how much money changes hands each year to resolve malpractice claims against individual practitioners. We show each year in the dollars of that year and adjusted for inflation, so the long-run trend is not overstated by rising prices.
| Payment year | Payments | Total paid | Total paid, inflation-adjusted |
|---|---|---|---|
| 2025 | 11,263 | $5,233.6M | $5,233.9M |
| 2024 | 11,627 | $5,053.6M | $5,172.8M |
| 2023 | 11,676 | $4,930.7M | $5,188.5M |
| 2022 | 11,203 | $4,291.4M | $4,649.2M |
| 2021 | 9,307 | $3,294.2M | $3,842.7M |
| 2020 | 9,685 | $3,559.7M | $4,403.6M |
| 2019 | 11,721 | $4,445.6M | $5,578.2M |
| 2018 | 11,833 | $4,233.1M | $5,404.4M |
| 2017 | 11,641 | $3,859.4M | $5,061.8M |
| 2016 | 11,535 | $3,844.2M | $5,127.3M |
| 2015 | 11,999 | $4,019.9M | $5,427.2M |
| 2014 | 12,461 | $3,815.3M | $5,166.5M |
| 2013 | 12,655 | $3,759.7M | $5,180.1M |
| 2012 | 12,679 | $3,771.9M | $5,286.2M |
| 2011 | 12,886 | $3,794.7M | $5,411.2M |
| 2010 | 12,977 | $3,667.0M | $5,395.5M |
| 2009 | 14,016 | $3,992.6M | $5,961.2M |
| 2008 | 13,978 | $4,073.9M | $6,028.4M |
| 2007 | 14,324 | $4,028.9M | $6,206.6M |
| 2006 | 14,857 | $4,052.0M | $6,425.8M |
| 2005 | 16,786 | $4,347.0M | $7,159.1M |
| 2004 | 17,893 | $4,797.1M | $8,108.1M |
| 2003 | 18,535 | $4,714.6M | $8,218.9M |
| 2002 | 18,678 | $4,718.9M | $8,387.0M |
| 2001 | 19,772 | $4,721.2M | $8,512.5M |
| 2000 | 19,064 | $4,249.9M | $7,878.1M |
| 1999 | 19,314 | $3,824.5M | $7,334.8M |
| 1998 | 18,061 | $3,440.6M | $6,744.2M |
| 1997 | 18,475 | $3,410.4M | $6,800.7M |
| 1996 | 18,255 | $3,314.0M | $6,758.7M |
| 1995 | 18,740 | $3,186.0M | $6,671.5M |
| 1994 | 18,236 | $2,911.0M | $6,276.9M |
| 1993 | 19,065 | $2,924.0M | $6,464.3M |
| 1992 | 19,335 | $2,857.5M | $6,492.8M |
| 1991 | 19,016 | $2,538.3M | $5,934.3M |
Source: Health Resources and Services Administration, National Practitioner Data Bank Data Analysis Tool, data through June 30, 2026. Medical malpractice payment reports by year of payment. Inflation-adjusted values are calculated by the NPDB using the Consumer Price Index for All Urban Consumers (CPI-U).
Source: Healthcare Industry Reviews analysis of National Practitioner Data Bank payment data, conducted November 2026.
Key Findings
- Payouts reached $5.23 billion in 2025, up 3.6% from $5.05 billion in 2024 and more than double the $2.54 billion paid in 1991.
- Adjusted for inflation, payouts peaked at $8.51 billion in 2001 and fell to a low of $3.84 billion in 2021. The 2025 total was 39% below the 2001 peak in real terms.
- Payouts dropped to $3.56 billion in 2020 and $3.29 billion in 2021, during the COVID-19 pandemic, then rose each year from 2022 to 2025. For insurers and the practitioners they cover, the yearly amount paid on claims grew by $1.94 billion from 2021 to 2025.
How Many Malpractice Payments Are Made Each Year
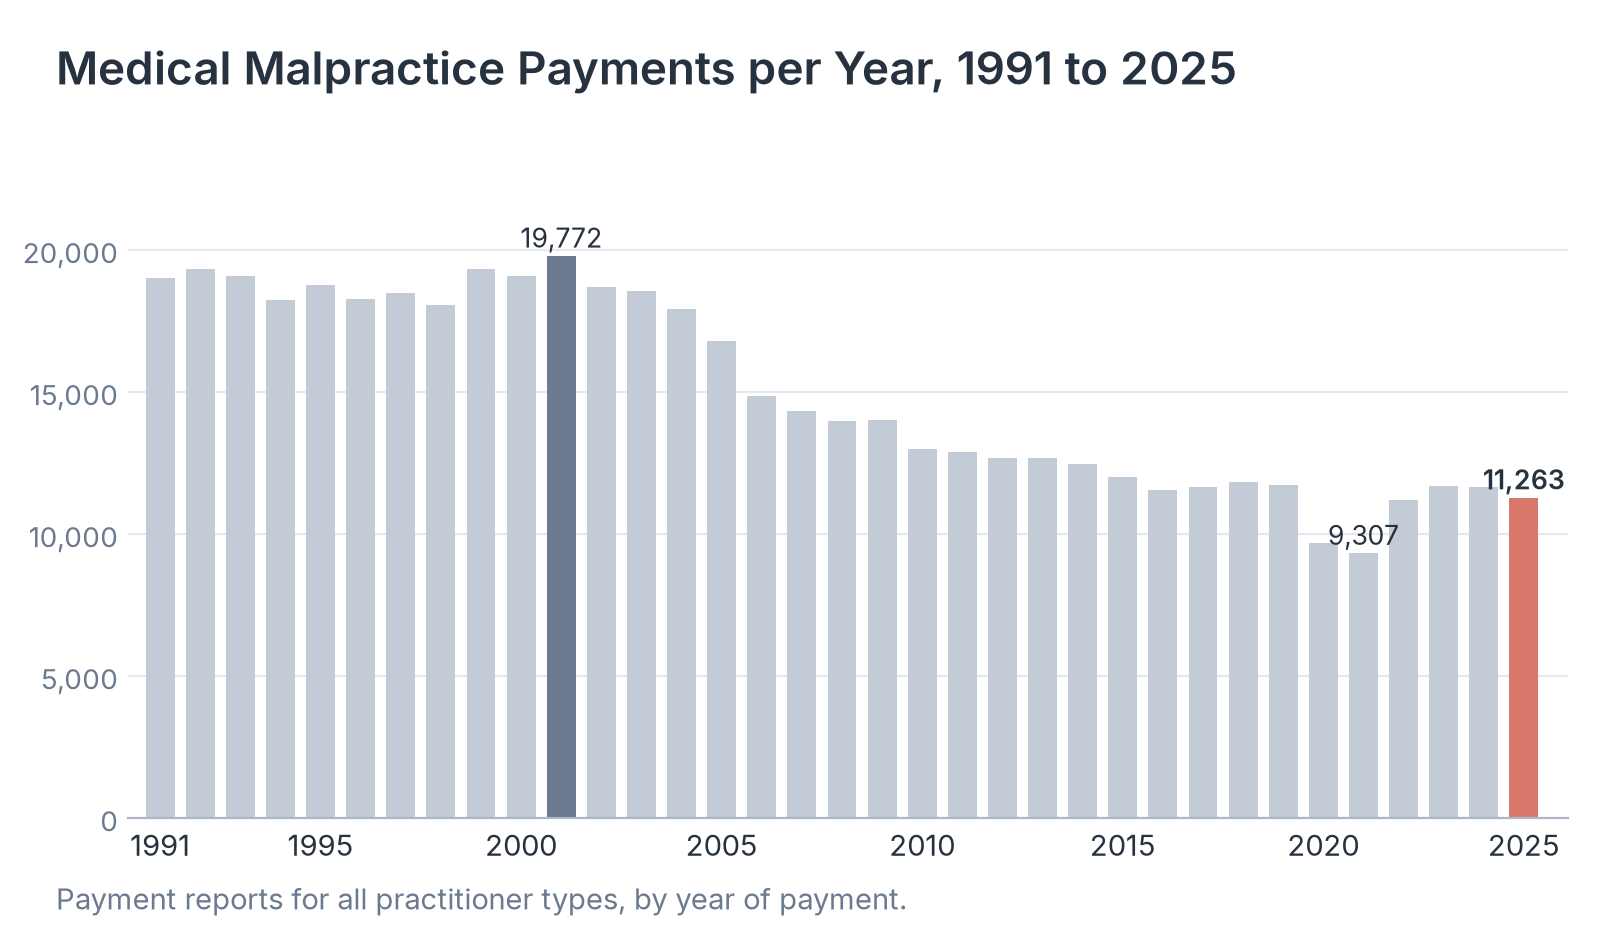
The number of payments shows how often malpractice claims end with money paid to a patient or family, whatever the amount. We compared yearly counts across four periods to show how far the count has moved since the 1990s.
| Period | Payments per year | Total paid per year |
|---|---|---|
| 1991 to 1999 | 18,722 | $3,156.3M |
| 2000 to 2009 | 16,790 | $4,369.6M |
| 2010 to 2019 | 12,239 | $3,921.1M |
| 2020 to 2025 | 10,794 | $4,393.9M |
Source: Health Resources and Services Administration, National Practitioner Data Bank Data Analysis Tool, data through June 30, 2026. Period figures are yearly averages of payment-year totals.
Source: Healthcare Industry Reviews analysis of National Practitioner Data Bank payment data, conducted November 2026.
Key Findings
- Practitioners had 19,772 malpractice payments made on their behalf in 2001, the most of any year. The count fell almost every year after that, to 11,535 in 2016.
- The count dropped to 9,307 in 2021, the fewest on record, and recovered to 11,676 in 2023. There were 11,263 payments in 2025, 3.1% fewer than in 2024.
- The data bank received 4,499 payment reports for the first six months of 2026. A full-year 2026 figure will not be final until reports for the fourth quarter arrive in early 2027.
How Much the Average Malpractice Payment Has Grown
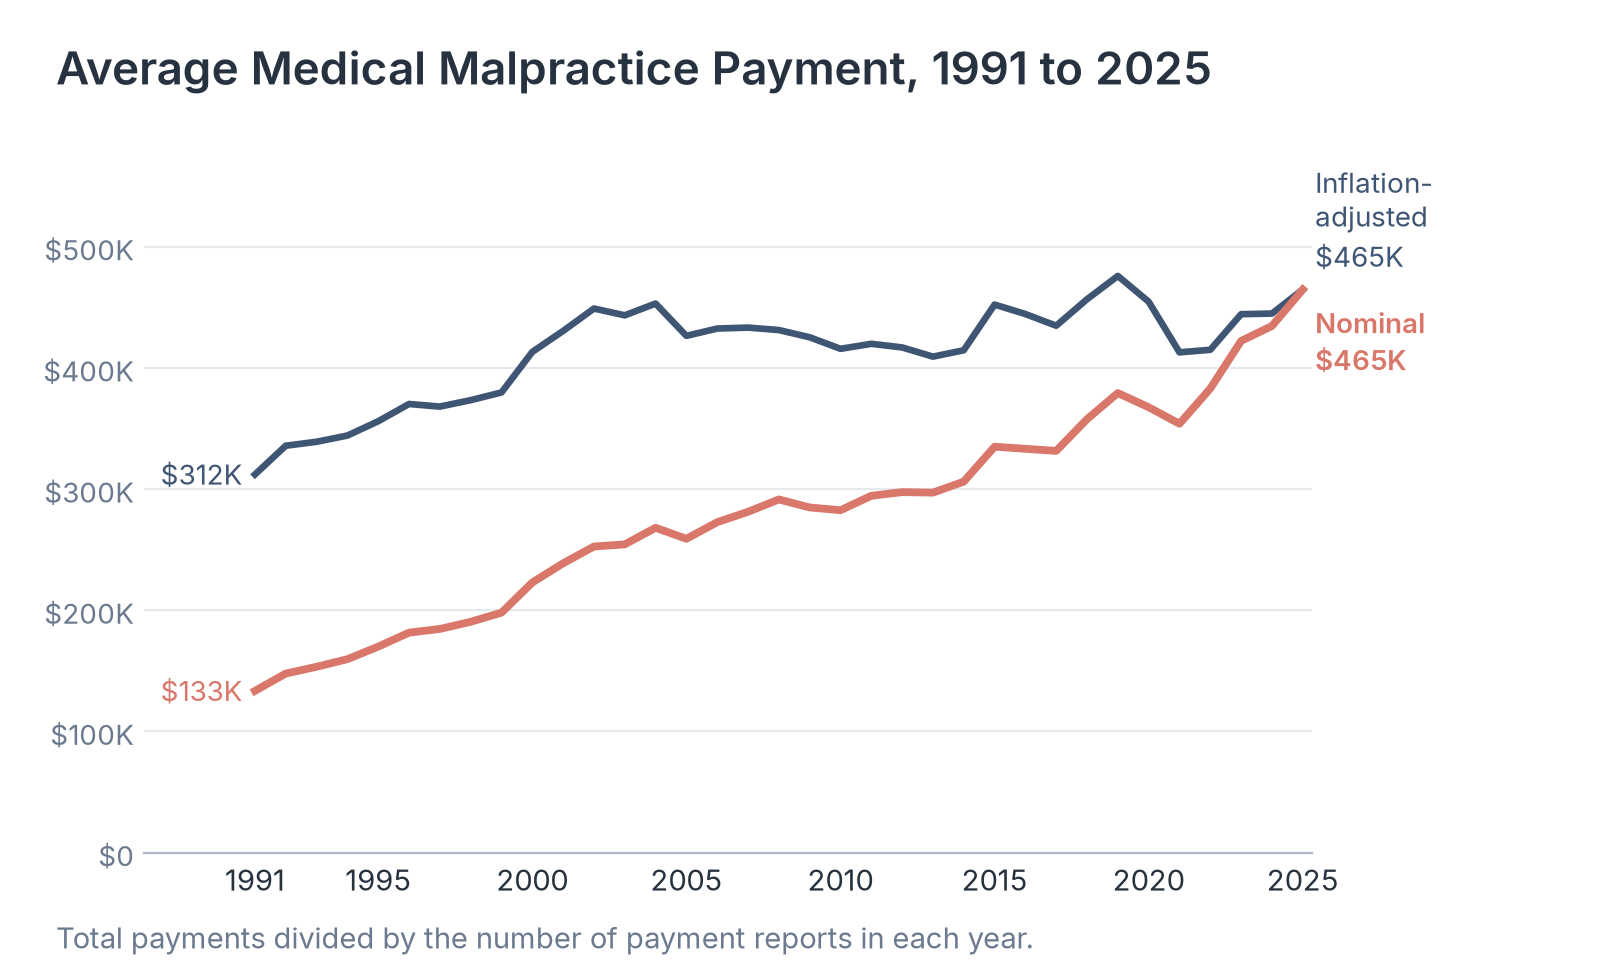
The average payment gives a simple measure of what a paid malpractice claim is worth. We divided total payouts by the number of payments in each year, in nominal and inflation-adjusted dollars.
| Payment year | Average payment | Average payment, inflation-adjusted |
|---|---|---|
| 2025 | $464,675 | $464,698 |
| 2024 | $434,641 | $444,897 |
| 2023 | $422,294 | $444,370 |
| 2022 | $383,055 | $414,994 |
| 2021 | $353,949 | $412,878 |
| 2020 | $367,550 | $454,682 |
| 2019 | $379,288 | $475,918 |
| 2015 | $335,016 | $452,304 |
| 2010 | $282,578 | $415,777 |
| 2005 | $258,966 | $426,492 |
| 2000 | $222,930 | $413,245 |
| 1995 | $170,009 | $356,003 |
| 1991 | $133,484 | $312,069 |
Source: Health Resources and Services Administration, National Practitioner Data Bank Data Analysis Tool, data through June 30, 2026. Total payments divided by the number of payment reports in each year.
Source: Healthcare Industry Reviews analysis of National Practitioner Data Bank payment data, conducted November 2026.
Key Findings
- The nominal average passed $400,000 for the first time in 2023, at $422,294. It was $335,016 in 2015 and $258,966 in 2005.
- Adjusted for inflation, the average payment reached its high point of $475,918 in 2019. It fell to $412,878 in 2021 and was $464,698 in 2025.
- Fewer payments at a higher average means each claim that ends in a payment costs insurers more. From 2015 to 2025, the number of payments fell 6.1% while the nominal average rose 39%.
How Large Malpractice Payments Are
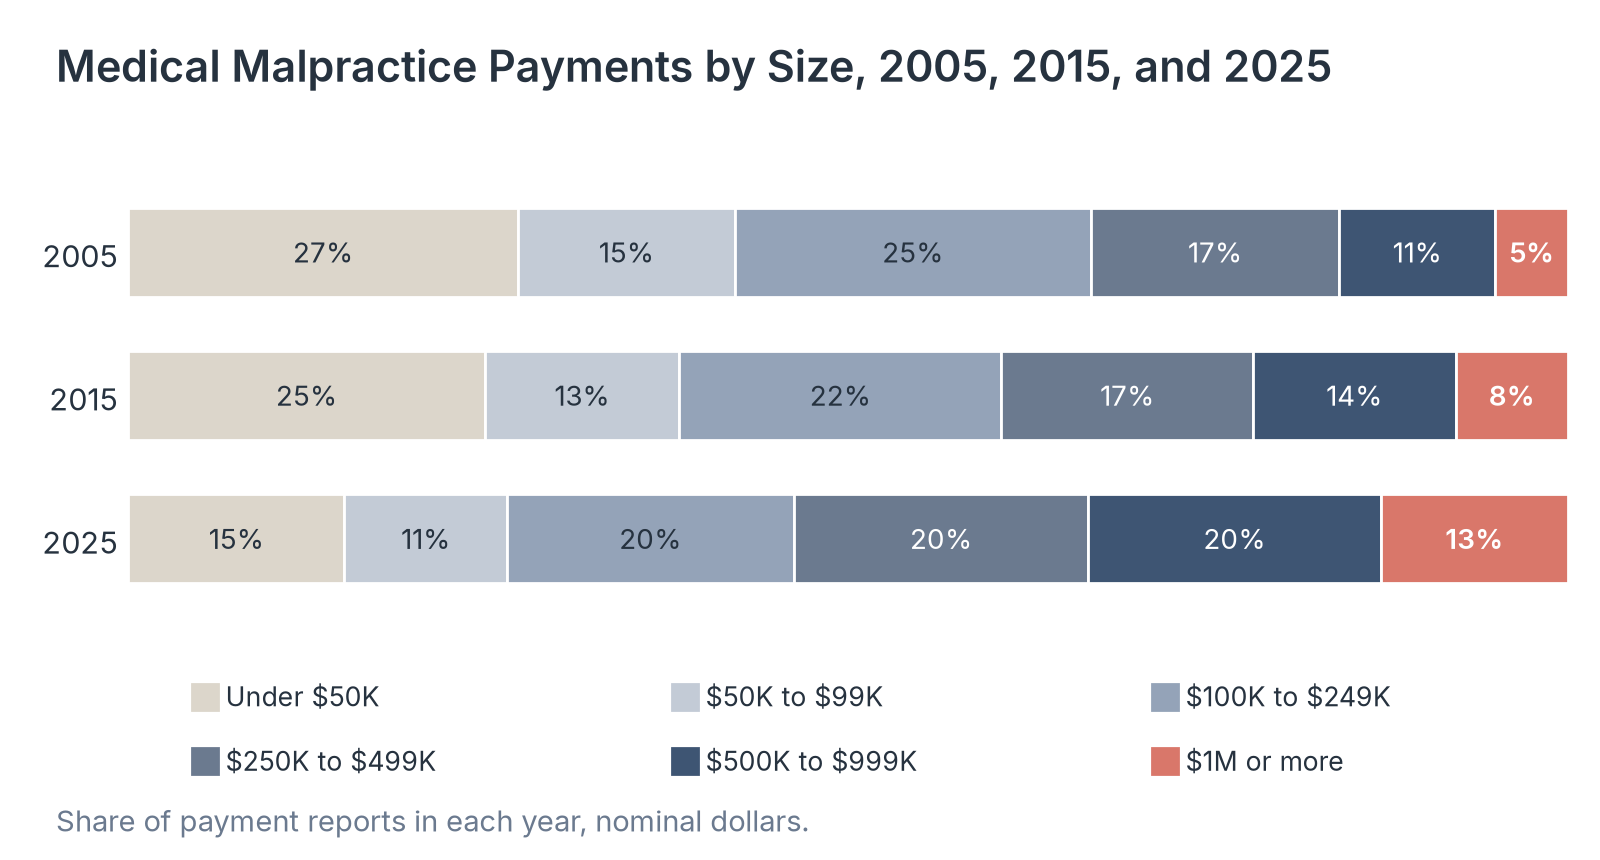
An average can be pulled up by a small number of very large payments, so we also looked at how payments spread across the size ranges the data bank uses. This shows how common settlements and judgments of $1 million or more have become.
| Payment size | Payments, 2015 | Share, 2015 | Payments, 2025 | Share, 2025 | Total paid, 2025 |
|---|---|---|---|---|---|
| Under $50,000 | 2,973 | 24.8% | 1,693 | 15.0% | $36.5M |
| $50,000 to $99,999 | 1,619 | 13.5% | 1,269 | 11.3% | $89.5M |
| $100,000 to $249,999 | 2,686 | 22.4% | 2,245 | 19.9% | $360.4M |
| $250,000 to $499,999 | 2,094 | 17.5% | 2,303 | 20.4% | $767.0M |
| $500,000 to $999,999 | 1,690 | 14.1% | 2,287 | 20.3% | $1,470.1M |
| $1,000,000 to $1,999,999 | 729 | 6.1% | 1,120 | 9.9% | $1,279.1M |
| $2,000,000 or more | 208 | 1.7% | 346 | 3.1% | $1,230.9M |
| All payments | 11,999 | 100% | 11,263 | 100% | $5,233.6M |
Source: Health Resources and Services Administration, National Practitioner Data Bank Data Analysis Tool, data through June 30, 2026. Payment ranges in nominal dollars.
Source: Healthcare Industry Reviews analysis of National Practitioner Data Bank payment data, conducted November 2026.
Key Findings
- 53.8% of all 2025 payments were $250,000 or more. The middle payment fell in the $250,000 to $499,999 range in 2025, compared with the $100,000 to $249,999 range in 2015 and 2005.
- There were 346 payments of $2 million or more in 2025, up from 208 in 2015 and 150 in 2005. Those 346 payments totaled $1.23 billion.
- Small payments became less common. Payments under $50,000 made up 15.0% of the total in 2025, down from 24.8% in 2015. Because the size ranges are not adjusted for inflation, part of that shift reflects rising prices.
Which States Have the Highest Malpractice Payouts
State payouts depend on population, the number of practitioners, and each state's laws on malpractice lawsuits, including limits on damages. We ranked every state and DC by total payouts in 2025 and calculated the average payment in each.
| State | Payments | Total paid | Average payment |
|---|---|---|---|
| New York | 1,328 | $764.6M | $575,738 |
| Pennsylvania | 993 | $468.4M | $471,702 |
| Florida | 1,236 | $463.6M | $375,057 |
| California | 1,060 | $355.6M | $335,443 |
| New Jersey | 697 | $350.1M | $502,267 |
| Georgia | 363 | $294.4M | $811,102 |
| Illinois | 394 | $275.1M | $698,325 |
| Connecticut | 178 | $190.1M | $1,067,809 |
| Massachusetts | 251 | $155.1M | $618,008 |
| Texas | 542 | $142.0M | $261,919 |
| Washington | 177 | $126.2M | $713,051 |
| Virginia | 163 | $91.7M | $562,454 |
| Michigan | 326 | $90.4M | $277,209 |
| New Mexico | 190 | $89.6M | $471,526 |
| Louisiana | 261 | $88.3M | $338,506 |
| Maryland | 206 | $85.2M | $413,495 |
| Missouri | 171 | $83.2M | $486,316 |
| Ohio | 215 | $79.1M | $367,721 |
| Kentucky | 176 | $79.0M | $448,864 |
| South Carolina | 145 | $73.5M | $506,552 |
| Arizona | 166 | $70.4M | $423,855 |
| Alabama | 115 | $67.8M | $589,391 |
| Oklahoma | 116 | $55.5M | $478,103 |
| Oregon | 112 | $55.3M | $493,571 |
| North Carolina | 124 | $49.8M | $401,694 |
| Wisconsin | 84 | $48.1M | $572,500 |
| Tennessee | 108 | $47.4M | $438,704 |
| Colorado | 102 | $46.1M | $451,667 |
| Nevada | 93 | $40.1M | $430,753 |
| Indiana | 180 | $38.5M | $213,889 |
| Kansas | 120 | $37.2M | $310,417 |
| Iowa | 53 | $34.2M | $646,038 |
| West Virginia | 80 | $27.8M | $347,750 |
| Arkansas | 52 | $25.0M | $480,192 |
| Utah | 72 | $24.4M | $339,583 |
| New Hampshire | 36 | $24.3M | $676,111 |
| Rhode Island | 34 | $21.9M | $642,647 |
| Hawaii | 37 | $21.1M | $570,270 |
| Idaho | 33 | $18.7M | $566,667 |
| Mississippi | 56 | $18.4M | $329,286 |
| Delaware | 28 | $15.9M | $567,500 |
| Minnesota | 50 | $14.7M | $293,800 |
| Montana | 34 | $14.4M | $422,941 |
| Alaska | 15 | $12.7M | $848,667 |
| Nebraska | 31 | $12.5M | $401,935 |
| District of Columbia | 18 | $9.2M | $512,222 |
| North Dakota | 6 | $8.7M | $1,448,333 |
| Vermont | 17 | $6.7M | $392,353 |
| Wyoming | 11 | $4.2M | $383,636 |
| Maine | 16 | $3.8M | $236,250 |
| South Dakota | 13 | $3.2M | $244,615 |
Source: Health Resources and Services Administration, National Practitioner Data Bank Data Analysis Tool, data through June 30, 2026. Payments made in 2025, by state. Puerto Rico had 176 payments totaling $10.7M.
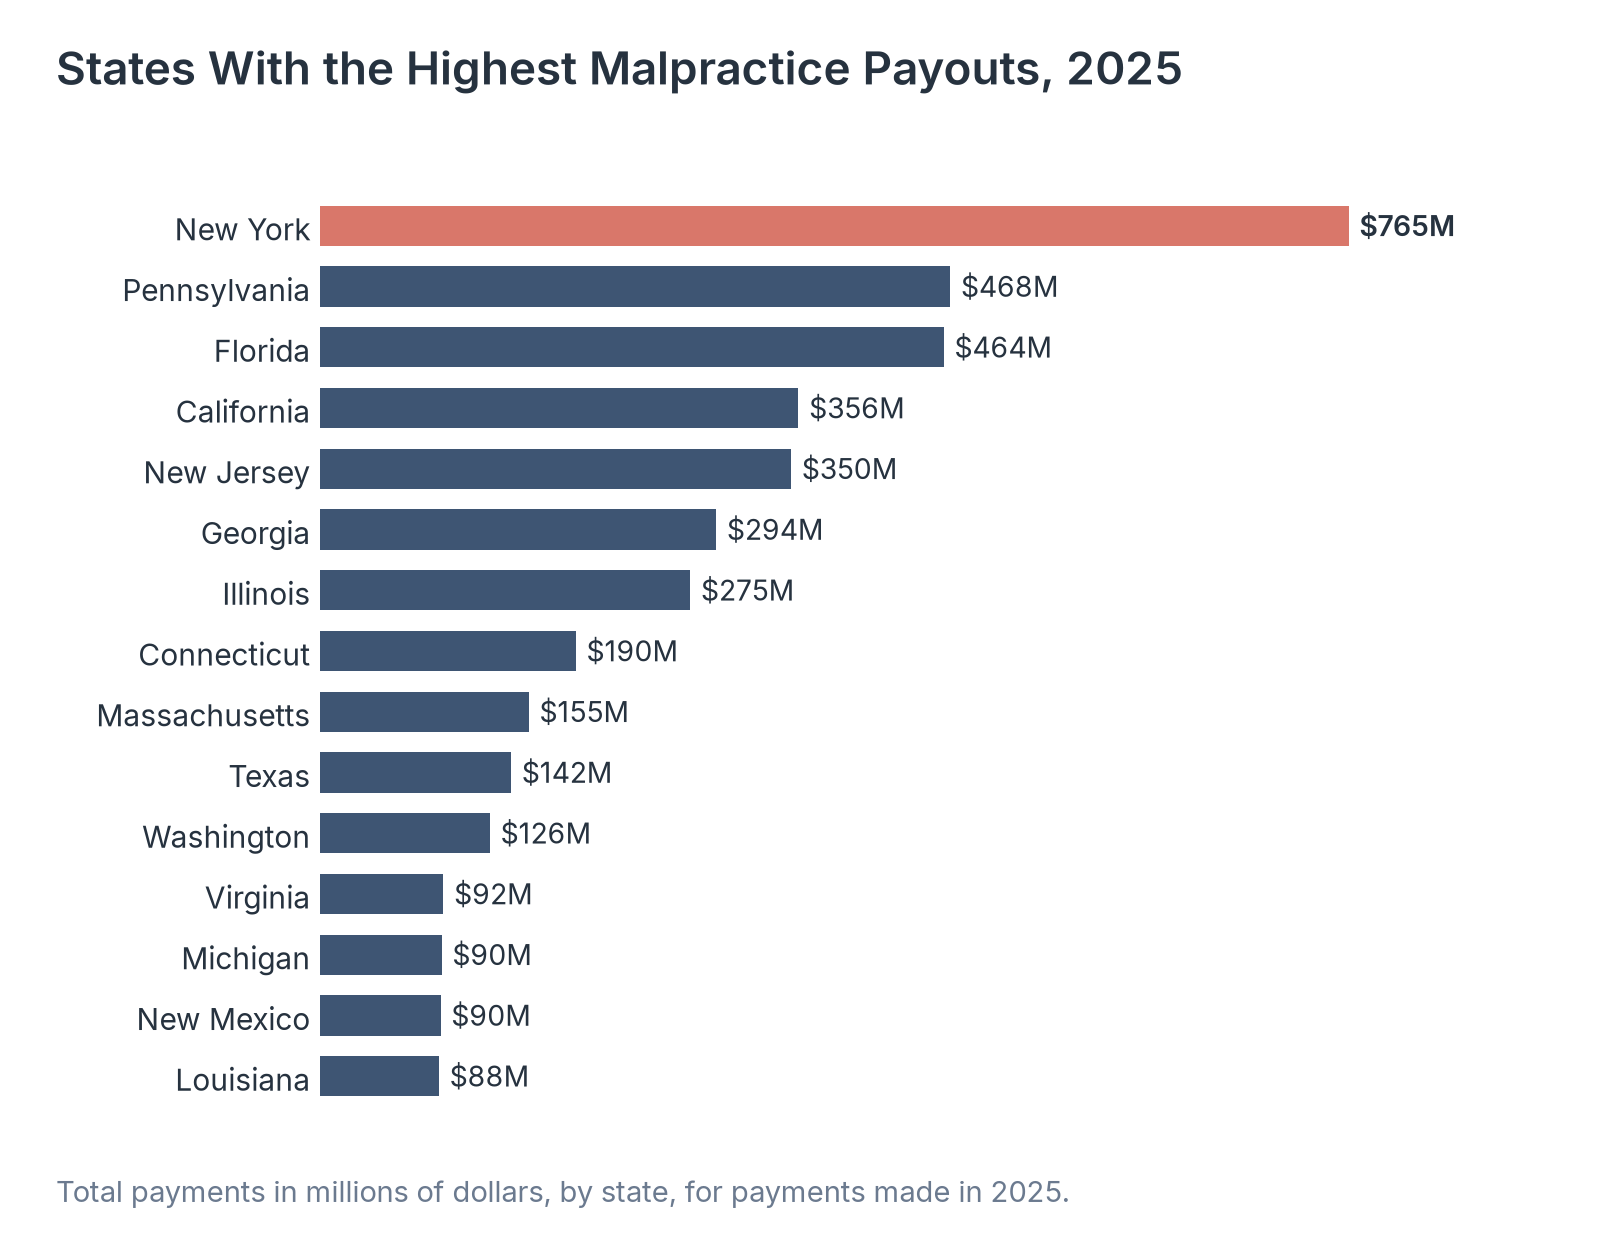
Source: Healthcare Industry Reviews analysis of National Practitioner Data Bank payment data, conducted November 2026.
Key Findings
- Five states, New York, Pennsylvania, Florida, California, and New Jersey, accounted for 45.9% of all malpractice dollars paid in 2025. New York had the most payments, 1,328, and Florida had 1,236.
- Among the 29 states with at least 100 payments, Connecticut had the highest average payment, $1,067,809, followed by Georgia ($811,102). Indiana had the lowest, $213,889.
- Texas had 542 payments in 2025 but an average of $261,919, the second-lowest among the 29 states with at least 100 payments. Since 2003, Texas law has limited noneconomic damages in malpractice cases to $250,000 per claimant against practitioners.3
Which Practitioners Have the Most Malpractice Payments
Physicians account for most malpractice payments, but nurses, physician assistants, dentists, and other practitioners also have payments reported on their behalf. We compared the number of payments and the average amount for each practitioner type in 2025.
| Practitioner type | Payments, 2015 | Payments, 2025 | Total paid, 2025 | Average payment, 2025 |
|---|---|---|---|---|
| Physicians (MD) | 8,184 | 7,279 | $3,823.9M | $525,339 |
| Dentists | 1,447 | 1,148 | $165.4M | $144,085 |
| Osteopathic physicians (DO) | 695 | 859 | $440.8M | $513,108 |
| Advanced practice nurses | 315 | 549 | $242.8M | $442,186 |
| Registered nurses | 359 | 395 | $227.9M | $576,861 |
| Physician assistants | 187 | 246 | $129.0M | $524,350 |
| Podiatrists | 243 | 226 | $68.0M | $300,752 |
| Chiropractors | 191 | 174 | $46.8M | $269,138 |
| Therapists and counselors | 118 | 149 | $19.4M | $130,000 |
| Technicians and assistants | 28 | 45 | $22.6M | $502,222 |
| All other types | 232 | 193 | $47.1M | $244,301 |
Source: Health Resources and Services Administration, National Practitioner Data Bank Data Analysis Tool, data through June 30, 2026. Practitioner types as grouped by the NPDB. All other types includes optometrists, pharmacists, psychologists, social workers, and other licensed practitioners.
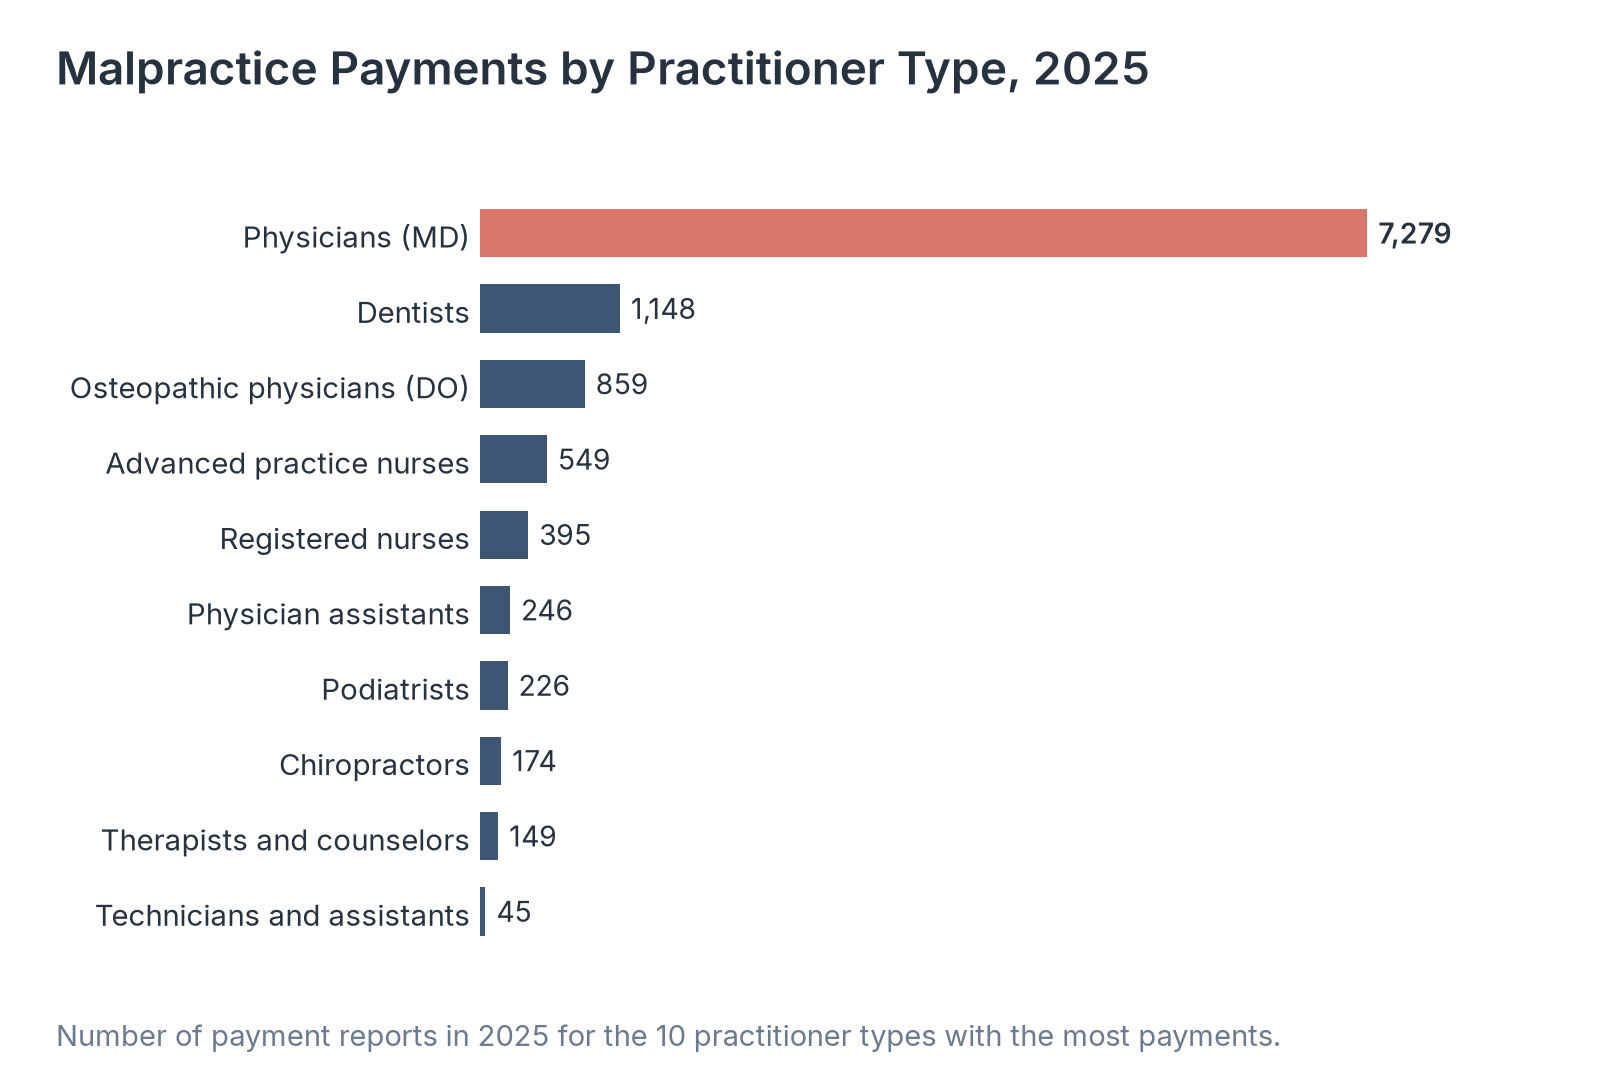
Source: Healthcare Industry Reviews analysis of National Practitioner Data Bank payment data, conducted November 2026.
Key Findings
- Physicians, MDs and DOs together, accounted for 8,138 payments in 2025, 72.3% of the total, and 81.5% of all dollars paid. The average payment for an MD was $525,339.
- Payments for advanced practice nurses rose from 315 in 2015 to 549 in 2025, and payments for physician assistants rose from 187 to 246. Over the same period, payments for MDs fell from 8,184 to 7,279.
- Dentists had the second-most payments, 1,148, but a much lower average of $144,085. Registered nurses had fewer payments, 395, with an average of $576,861, higher than the average for MDs.
What Malpractice Payout Statistics Show
Malpractice payouts in the United States are at a record in nominal dollars, even though far fewer claims end in payment than in the early 2000s. For practitioners and their insurers, each paid claim now carries more financial weight than it did a decade ago, and payments of $1 million or more have become a regular part of the yearly total.
Where a practitioner works also changes the picture. Five states account for nearly half of all dollars paid, while Texas, which limits noneconomic damages, has one of the lowest average payments. Payments tied to advanced practice nurses and physician assistants have grown since 2015, even as payments for MDs have declined.
So if you are citing malpractice payout figures, use the payment year and say whether the amount is nominal or adjusted for inflation, because the two tell different stories about the trend since 2001.
Data Collection and Methodology
All payment figures come from the National Practitioner Data Bank Data Analysis Tool, which covers medical malpractice payment reports received from September 1, 1990, through June 30, 2026. We downloaded yearly totals for all practitioner types and the tool's breakdowns by state, practitioner type, and payment range in November 2026. Years are the year the payment was made.
We start the yearly series in 1991, the first full year of reporting, and end it in 2025; the 2026 count covers January to June only. Because payers have 30 days to report, the NPDB notes that a year's data are not final until reports for the following first quarter are added.
Totals are the sum of payments reported to the data bank, which collects payments made for the benefit of individual licensed practitioners. Inflation-adjusted totals are calculated by the NPDB using the Consumer Price Index for All Urban Consumers (CPI-U). State is the state reported for each payment. Payment size ranges are in nominal dollars.
Averages in the state comparison are limited to states with at least 100 payments in 2025. Fewer than 500 payment reports from 1990 to 2003 without state or practitioner information are not included in the tool. We calculated averages, shares, and percentage changes from the published values.
Sources
- Healthcare Industry Reviews analysis of National Practitioner Data Bank medical malpractice payment reports for payment years 1991 to 2025, by year, state, practitioner type, and payment size, conducted November 2026.
- Division of Practitioner Data Bank, Bureau of Health Workforce, Health Resources and Services Administration. National Practitioner Data Bank (2026): Adverse Action and Medical Malpractice Reports (1990 - 2026), Data Analysis Tool. Data through June 30, 2026.
- Texas Civil Practice and Remedies Code, Chapter 74, Medical Liability, Section 74.301, Limitation on Noneconomic Damages. Added 2003.