Medicare Advantage Enrollment Statistics: 2026 Report
Published
Our analysts reviewed KFF and CMS enrollment data for 2007 to 2026, calculated private plan shares for every state and 3,083 counties, and compared plan types and parent organizations to show how many people are enrolled in Medicare Advantage, where they live, and which plans they choose, as of Q4 2026.
Key Findings
- 35.2 million people were enrolled in Medicare Advantage in March 2026, 55% of eligible Medicare beneficiaries, up from 17.0 million (33%) in 2016.
- In 30 states, at least half of Medicare beneficiaries with Parts A and B were in Medicare Advantage or another private plan in July 2026, up from 2 in July 2016.
- Special needs plans enrolled 8.2 million people in 2026, 23% of Medicare Advantage enrollment, and chronic condition plans grew 45.0% in one year.
- UnitedHealth Group and Humana together enrolled 46% of Medicare Advantage members in 2026, and Humana added 1.3 million members while UnitedHealth Group lost 647,000.
Medicare Advantage is the private plan option within Medicare. Instead of paying doctors and hospitals directly through traditional Medicare, the federal government pays private insurers a monthly amount for each enrollee, and the insurers cover Medicare benefits, usually with drug coverage and extra benefits included. Most people with Medicare Parts A and B can choose either program each year. KFF reports that Medicare pays about 14% more per Medicare Advantage enrollee than it would spend on the same person in traditional Medicare, about $76 billion more in 2026.2
Our analysts compiled KFF's annual Medicare Advantage enrollment counts and shares for 2007 to 2026, with plan type and parent organization data.2 We then calculated private plan shares for every state from CMS monthly enrollment data for July 2016 and July 2026, sorted all 3,083 counties in the October 2026 CMS penetration file by share enrolled, and compared plan types in the CMS contract summary reports for October 2025 and October 2026.3,4,5
In the following sections, we cover total enrollment and its growth, enrollment by state, enrollment by county, the mix of plan types, special needs plans, and the parent organizations that enroll the most members.
How Many People Are Enrolled in Medicare Advantage
KFF counts Medicare Advantage enrollees each March and divides them by Medicare beneficiaries with both Part A and Part B, the people eligible to join a plan.
| Year | Medicare Advantage enrollees | Share of eligible beneficiaries |
|---|---|---|
| 2007 | 7,611,316 | 19% |
| 2008 | 8,988,334 | 22% |
| 2009 | 10,134,648 | 24% |
| 2010 | 10,747,420 | 25% |
| 2011 | 11,531,845 | 26% |
| 2012 | 12,675,807 | 27% |
| 2013 | 13,903,054 | 29% |
| 2014 | 15,214,116 | 31% |
| 2015 | 16,184,195 | 32% |
| 2016 | 16,990,836 | 33% |
| 2017 | 18,314,418 | 35% |
| 2018 | 19,749,799 | 37% |
| 2019 | 21,726,446 | 39% |
| 2020 | 23,826,655 | 42% |
| 2021 | 26,201,184 | 46% |
| 2022 | 28,402,037 | 48% |
| 2023 | 30,753,302 | 51% |
| 2024 | 32,820,698 | 54% |
| 2025 | 34,138,496 | 54% |
| 2026 | 35,208,727 | 55% |
Source: KFF, Medicare Advantage in 2026: Enrollment Update and Key Trends, July 2026.
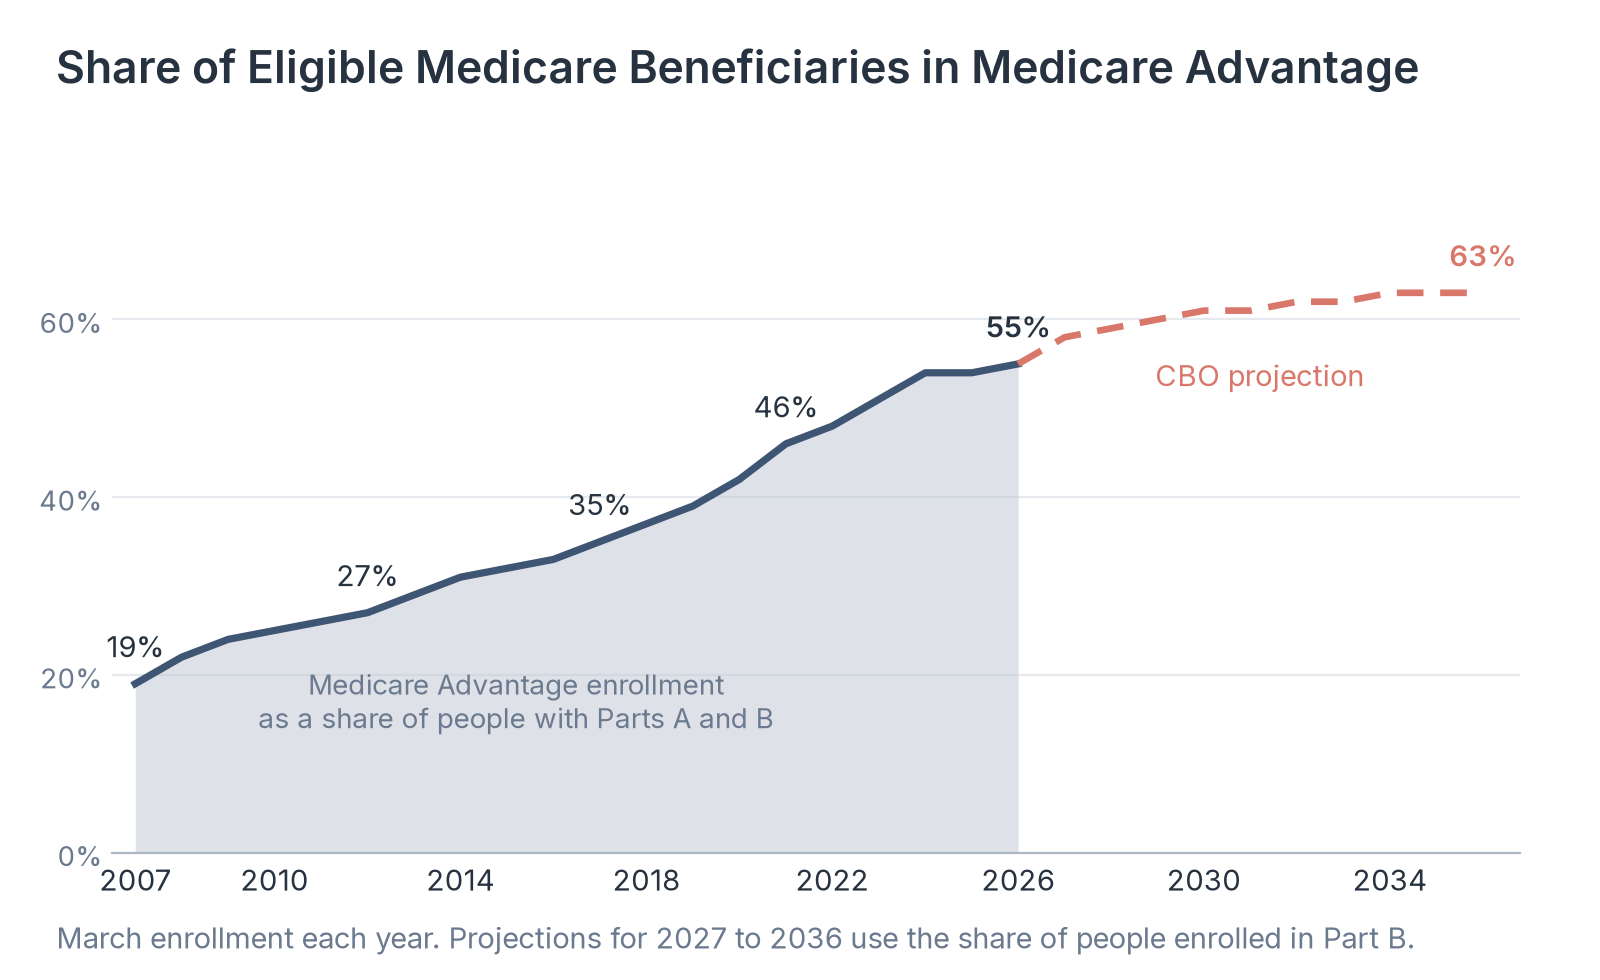
Source: Healthcare Industry Reviews analysis of KFF and Congressional Budget Office data, conducted November 2026.
Key Findings
- Enrollment rose from 7.6 million in 2007 to 35.2 million in 2026, more than four times as many people. The share of eligible beneficiaries rose from 19% to 55%, and it has been above half since 2023.
- Enrollment grew by 1.1 million people (3.1%) from 2025 to 2026, slower than the 2.4 million gain from 2020 to 2021. The share was 54% in both 2024 and 2025.
- The Congressional Budget Office projects that the share will reach 63% by 2034 and stay there through 2036. CMS counts are higher than KFF's partly because CMS includes cost plans and other private plans: in July 2026, 36.1 million of 64.7 million beneficiaries with Parts A and B (55.9%) were in a private plan.
Medicare Advantage Enrollment by State
States differ widely in how many beneficiaries choose a private plan. We used CMS monthly enrollment data for July of each year, which counts beneficiaries with Parts A and B in Medicare Advantage or other private plans.
| State | Private plan enrollees, 2026 | Share, 2016 | Share, 2026 | Change, percentage points |
|---|---|---|---|---|
| Michigan | 1,476,530 | 36.7% | 67.4% | +30.7 |
| Alabama | 703,620 | 28.5% | 66.5% | +38.0 |
| Rhode Island | 150,946 | 40.2% | 65.9% | +25.7 |
| Maine | 229,864 | 27.2% | 63.2% | +36.0 |
| Connecticut | 445,871 | 29.5% | 62.2% | +32.7 |
| Louisiana | 559,215 | 33.9% | 62.1% | +28.2 |
| North Carolina | 1,346,269 | 32.7% | 61.6% | +28.9 |
| Hawaii | 168,789 | 51.9% | 61.5% | +9.6 |
| Minnesota | 689,691 | 59.9% | 61.1% | +1.2 |
| Florida | 3,049,734 | 43.4% | 61.0% | +17.6 |
| Wisconsin | 789,338 | 41.5% | 60.7% | +19.2 |
| Ohio | 1,481,478 | 40.0% | 60.6% | +20.6 |
| Georgia | 1,141,129 | 36.2% | 60.5% | +24.3 |
| West Virginia | 259,172 | 28.1% | 60.4% | +32.3 |
| Utah | 269,888 | 38.2% | 60.1% | +21.9 |
| Texas | 2,748,466 | 36.2% | 59.8% | +23.7 |
| Kentucky | 558,378 | 29.2% | 59.7% | +30.5 |
| Pennsylvania | 1,656,039 | 43.6% | 59.0% | +15.4 |
| Missouri | 748,653 | 32.4% | 58.5% | +26.1 |
| New York | 2,178,433 | 41.5% | 58.5% | +16.9 |
| Oregon | 523,293 | 48.0% | 57.9% | +9.9 |
| Nevada | 327,927 | 37.8% | 57.7% | +19.9 |
| Tennessee | 820,053 | 38.1% | 57.6% | +19.6 |
| Colorado | 566,181 | 40.5% | 56.6% | +16.1 |
| California | 3,730,640 | 46.0% | 56.1% | +10.1 |
| Arizona | 803,216 | 41.6% | 55.8% | +14.1 |
| New Mexico | 241,896 | 35.6% | 55.4% | +19.7 |
| Indiana | 729,218 | 26.9% | 54.7% | +27.7 |
| Washington | 788,217 | 33.0% | 54.4% | +21.4 |
| Arkansas | 327,123 | 22.3% | 50.6% | +28.3 |
| South Carolina | 601,518 | 26.2% | 49.9% | +23.6 |
| Idaho | 191,647 | 34.3% | 49.1% | +14.7 |
| Mississippi | 297,714 | 16.7% | 48.4% | +31.7 |
| Illinois | 1,093,748 | 24.2% | 48.1% | +23.9 |
| New Jersey | 763,856 | 18.7% | 46.5% | +27.8 |
| Oklahoma | 352,092 | 18.8% | 46.4% | +27.6 |
| Virginia | 695,772 | 20.4% | 43.8% | +23.5 |
| District of Columbia | 33,695 | 17.6% | 40.9% | +23.3 |
| Iowa | 267,167 | 18.7% | 40.1% | +21.4 |
| Massachusetts | 540,976 | 23.6% | 39.3% | +15.8 |
| South Dakota | 73,766 | 23.2% | 38.7% | +15.5 |
| North Dakota | 54,703 | 21.2% | 38.4% | +17.2 |
| Nebraska | 136,372 | 13.5% | 37.0% | +23.4 |
| Kansas | 203,934 | 15.7% | 36.2% | +20.5 |
| Delaware | 84,676 | 10.2% | 35.4% | +25.2 |
| New Hampshire | 112,725 | 9.4% | 34.6% | +25.2 |
| Montana | 81,228 | 21.4% | 32.1% | +10.6 |
| Maryland | 300,228 | 11.3% | 28.9% | +17.7 |
| Wyoming | 20,510 | 3.8% | 16.6% | +12.8 |
| Vermont | 21,597 | 8.4% | 13.7% | +5.3 |
| Alaska | 3,506 | 0.9% | 3.2% | +2.3 |
| United States (50 states and DC) | 35,440,697 | 34.8% | 55.5% | +20.7 |
Source: Centers for Medicare & Medicaid Services (CMS), Medicare Monthly Enrollment, July 2016 and July 2026.
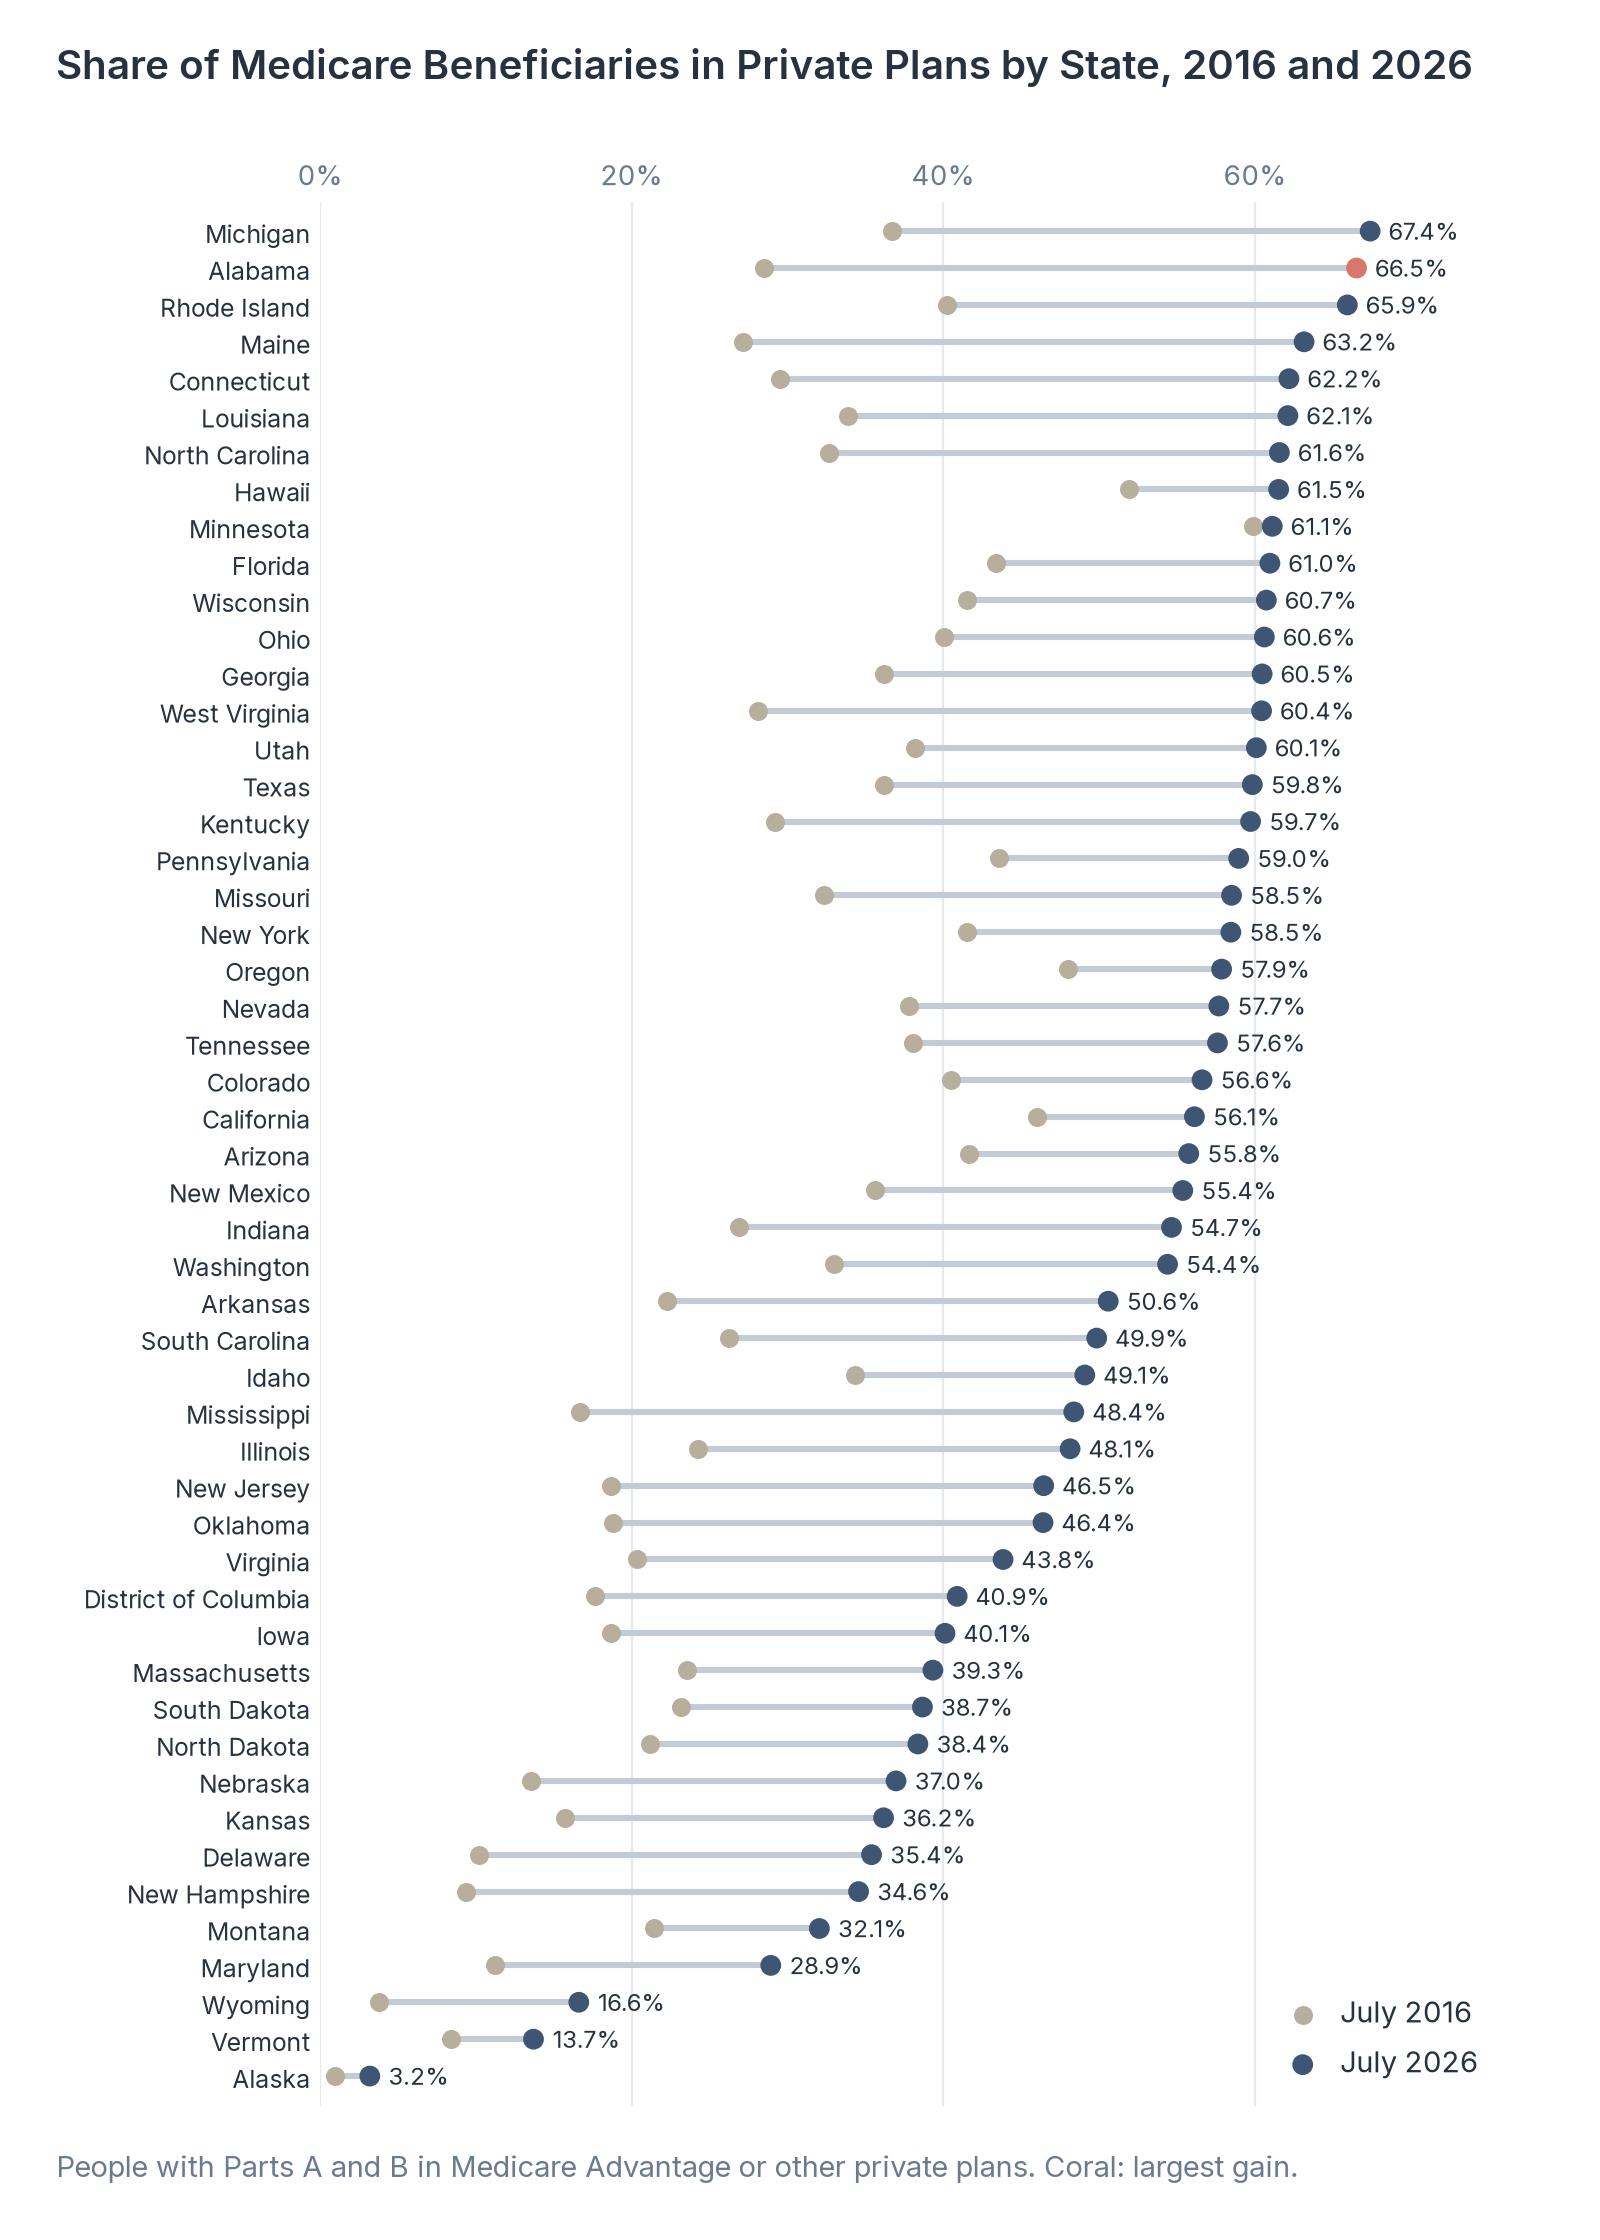
Source: Healthcare Industry Reviews analysis of CMS Medicare Monthly Enrollment data, conducted November 2026.
Key Findings
- Michigan (67.4%), Alabama (66.5%), Rhode Island (65.9%), Maine (63.2%), and Connecticut (62.2%) had the highest private plan shares in July 2026. Alaska (3.2%), Vermont (13.7%), and Wyoming (16.6%) had the lowest.
- Alabama gained the most, from 28.5% to 66.5%, an increase of 38.0 percentage points. Maine (+36.0), Connecticut (+32.7), and West Virginia (+32.3) followed.
- Minnesota changed least, rising from 59.9% to 61.1%, because private plans were already common there in 2016. Puerto Rico, not included in the table, had the highest share of any US jurisdiction at 96.3%.
Medicare Advantage Enrollment by County
The CMS penetration file reports Medicare Advantage enrollment as a share of all Medicare eligibles in each county, including people without Part B, so its shares run a few points lower than the state figures above. The October 2026 file leaves out Connecticut and Alaska.
| County | Medicare eligibles | Medicare Advantage enrollees | Penetration |
|---|---|---|---|
| Los Angeles, California | 1,728,391 | 987,690 | 57.1% |
| Cook, Illinois | 898,120 | 403,219 | 44.9% |
| Maricopa, Arizona | 823,407 | 423,846 | 51.5% |
| Harris, Texas | 668,487 | 410,227 | 61.4% |
| San Diego, California | 631,070 | 338,551 | 53.6% |
| Orange, California | 610,935 | 341,720 | 55.9% |
| Miami-Dade, Florida | 528,794 | 397,170 | 75.1% |
| Riverside, California | 457,503 | 289,812 | 63.4% |
| Clark, Nevada | 431,433 | 244,878 | 56.8% |
| Queens, New York | 426,987 | 261,102 | 61.1% |
| Kings, New York | 417,294 | 241,058 | 57.8% |
| Broward, Florida | 383,369 | 247,731 | 64.6% |
| Palm Beach, Florida | 371,693 | 179,484 | 48.3% |
| King, Washington | 370,069 | 198,653 | 53.7% |
| Dallas, Texas | 366,287 | 201,263 | 55.0% |
Source: CMS, Medicare Advantage State/County Penetration, October 2026.
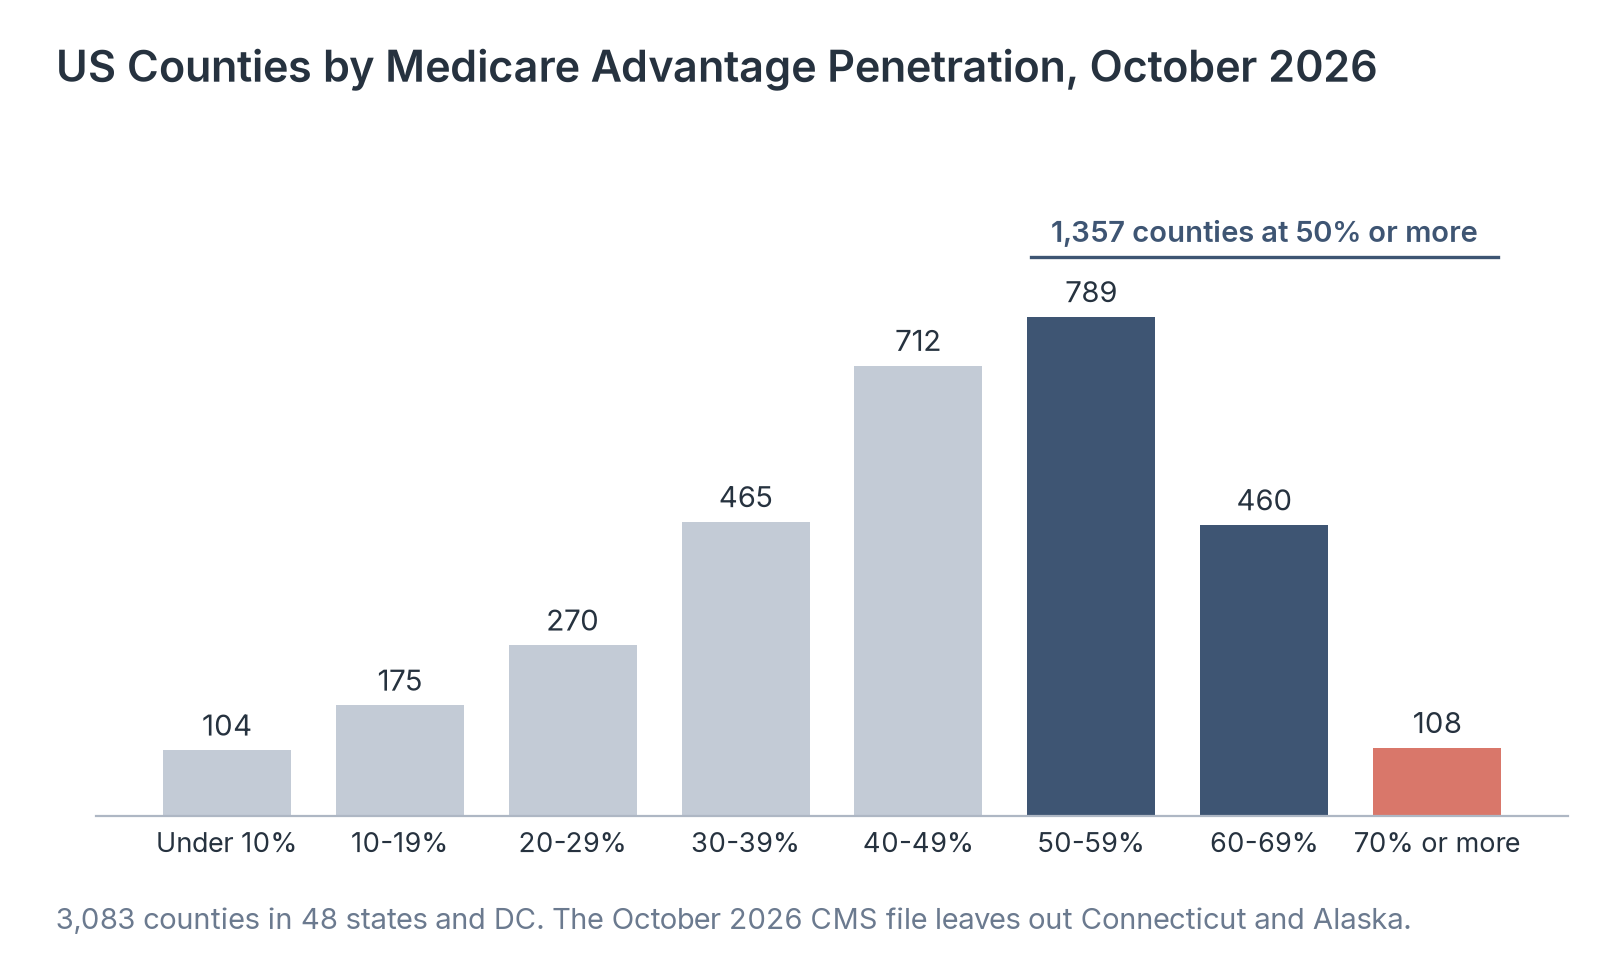
Source: Healthcare Industry Reviews analysis of CMS Medicare Advantage State/County Penetration data, conducted November 2026.
Key Findings
- 1,357 of 3,083 counties (44.0%) had Medicare Advantage penetration of 50% or more, and 108 had 70% or more. The median county was at 47.5%.
- Counties at 50% or more held 60.4% of Medicare eligibles, because counties with more eligibles tend to have higher penetration. Miami-Dade County, Florida, had the highest penetration of the 15 largest counties at 75.1%, and Cook County, Illinois, the lowest at 44.9%.
- Among counties with at least 10,000 eligibles, Starr County, Texas (84.5%), and Hidalgo County, Texas (78.0%), had the highest penetration. Los Angeles County had the most enrollees of any county, 987,690.
Medicare Advantage Enrollment by Plan Type
Medicare Advantage includes several plan types: plans open to anyone in the service area, employer and union group plans for retirees, and special needs plans for people with certain conditions or Medicaid coverage. The CMS contract summary also counts related private plans, such as cost plans and the PACE program, alongside Medicare Advantage.
| Plan type | October 2025 | October 2026 | Change | Change, percent |
|---|---|---|---|---|
| Medicare Advantage contracts | 696 | 703 | +7 | +1.0% |
| Medicare Advantage enrollees, total | 35,117,910 | 36,024,875 | +906,965 | +2.6% |
| Plans with Part D drug coverage | 32,436,534 | 32,105,702 | -330,832 | -1.0% |
| Plans without drug coverage | 2,681,376 | 3,919,173 | +1,237,797 | +46.2% |
| Special needs plans | 7,709,285 | 8,483,994 | +774,709 | +10.0% |
| Employer group plans | 5,865,219 | 5,847,113 | -18,106 | -0.3% |
| Local coordinated care plans (HMOs and local PPOs) | 34,861,413 | 35,839,044 | +977,631 | +2.8% |
| Regional PPOs | 215,145 | 148,640 | -66,505 | -30.9% |
| Private fee-for-service plans | 40,036 | 34,295 | -5,741 | -14.3% |
| Medical savings account plans | 1,316 | 2,896 | +1,580 | +120.1% |
| Section 1876 cost plans | 161,682 | 196,762 | +35,080 | +21.7% |
| PACE | 73,068 | 82,218 | +9,150 | +12.5% |
| Medicare-Medicaid plans | 228,673 | 0 | -228,673 | -100.0% |
| Stand-alone Part D drug plans | 23,553,202 | 25,481,671 | +1,928,469 | +8.2% |
Source: CMS, Monthly Contract and Enrollment Summary Report, October 2025 and October 2026. Contract and enrollee counts for drug coverage, special needs, employer, and plan type rows are subsets of the Medicare Advantage total, except cost plans, PACE, Medicare-Medicaid plans, and stand-alone drug plans.
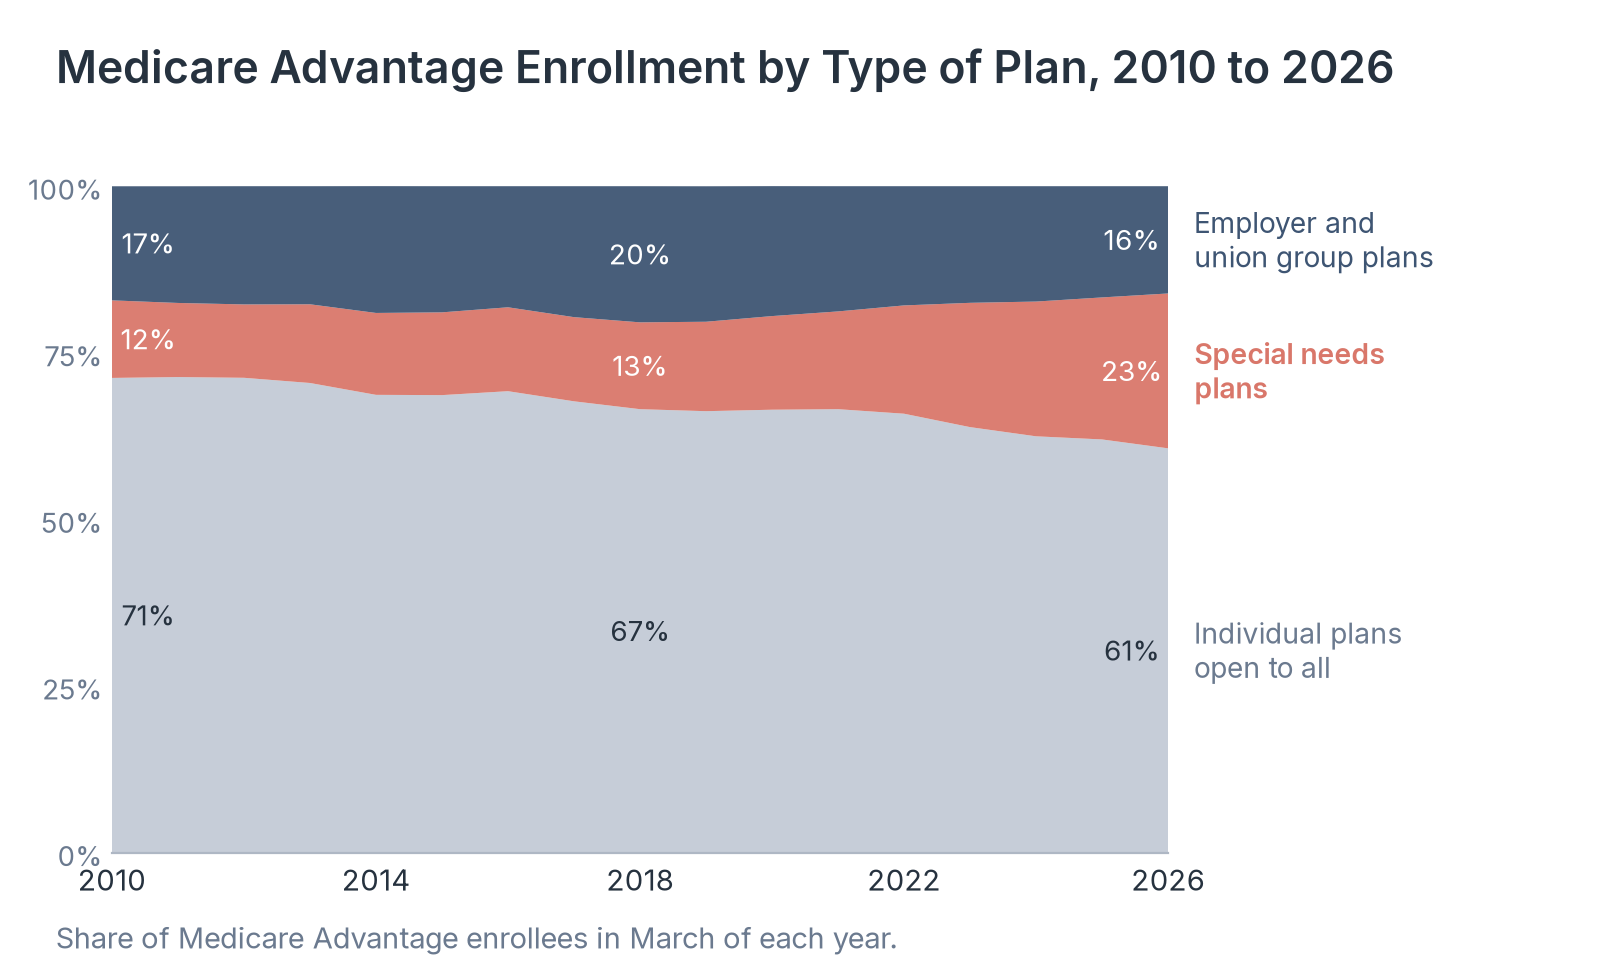
Source: Healthcare Industry Reviews analysis of KFF data, conducted November 2026.
Key Findings
- Medicare Advantage enrollment rose by 907,000 (2.6%) from October 2025 to October 2026, to 36.0 million. Enrollment in plans without drug coverage rose 46.2%, to 3.9 million, while enrollment in plans with drug coverage fell 1.0%.
- Medicare-Medicaid plans fell from 228,673 enrollees in October 2025 to none in October 2026, while special needs plan enrollment rose 10.0%. Regional PPO enrollment fell 30.9%.
- In KFF's March data, individual plans held 61% of enrollment in 2026, down from 71% in 2010. Employer group plans held 16%, and 13 states covered their Medicare-eligible retirees only through Medicare Advantage in 2024.
Special Needs Plan Enrollment
Special needs plans limit enrollment to three groups: people eligible for both Medicare and Medicaid (D-SNPs), people with certain chronic conditions (C-SNPs), and people living in nursing homes or needing that level of care (I-SNPs). They are the fastest-growing part of Medicare Advantage.
| Year | Dual eligible (D-SNP) | Chronic condition (C-SNP) | Institutional (I-SNP) | Total | Share of Medicare Advantage enrollees |
|---|---|---|---|---|---|
| 2010 | 943,965 | 211,206 | 96,605 | 1,251,776 | 11.6% |
| 2011 | 1,005,479 | 158,464 | 78,565 | 1,242,508 | 10.8% |
| 2012 | 1,158,052 | 190,329 | 45,427 | 1,393,808 | 11.0% |
| 2013 | 1,343,225 | 251,930 | 47,612 | 1,642,767 | 11.8% |
| 2014 | 1,539,832 | 281,899 | 48,891 | 1,870,622 | 12.3% |
| 2015 | 1,657,554 | 305,211 | 48,740 | 2,011,505 | 12.4% |
| 2016 | 1,759,133 | 325,809 | 55,439 | 2,140,381 | 12.6% |
| 2017 | 1,922,863 | 329,742 | 61,694 | 2,314,299 | 12.6% |
| 2018 | 2,157,682 | 345,951 | 71,474 | 2,575,107 | 13.0% |
| 2019 | 2,487,999 | 347,309 | 82,475 | 2,917,783 | 13.4% |
| 2020 | 2,875,819 | 372,251 | 98,637 | 3,346,707 | 14.0% |
| 2021 | 3,378,495 | 382,261 | 83,576 | 3,844,332 | 14.7% |
| 2022 | 4,124,983 | 399,128 | 92,771 | 4,616,882 | 16.3% |
| 2023 | 5,168,071 | 464,916 | 103,043 | 5,736,030 | 18.7% |
| 2024 | 5,845,597 | 674,512 | 115,078 | 6,635,187 | 20.2% |
| 2025 | 6,004,948 | 1,150,764 | 114,893 | 7,270,605 | 21.3% |
| 2026 | 6,388,978 | 1,668,487 | 124,013 | 8,181,478 | 23.2% |
Source: KFF, Medicare Advantage in 2026: Enrollment Update and Key Trends, July 2026. We calculated the share from KFF's total enrollment for each year.
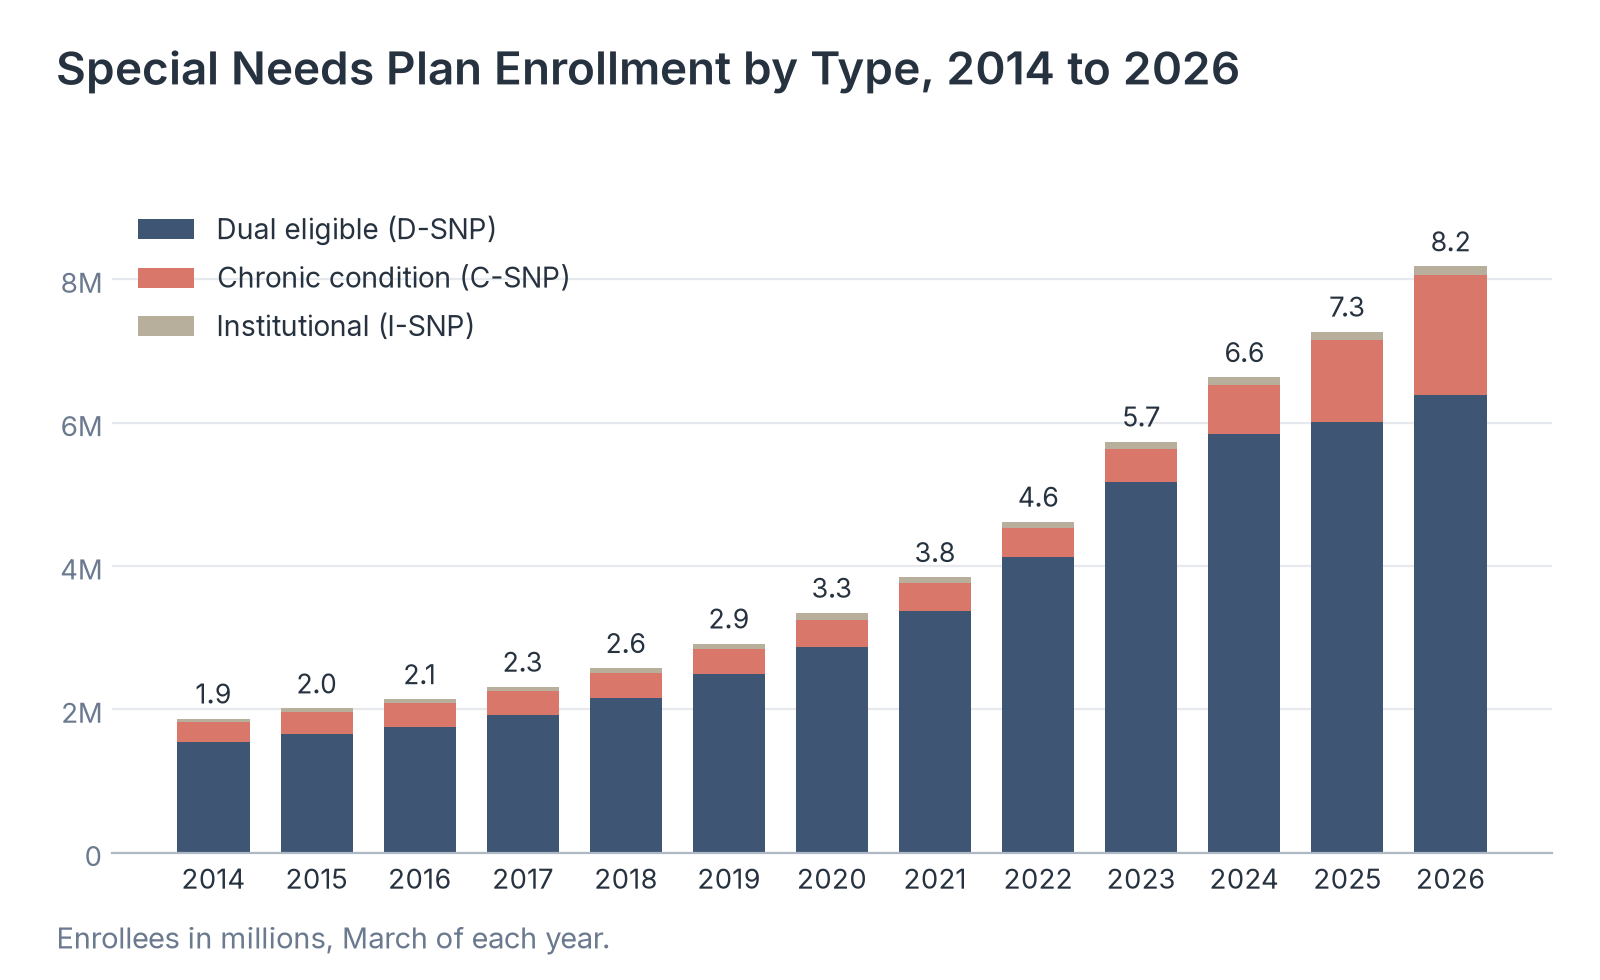
Source: Healthcare Industry Reviews analysis of KFF data, conducted November 2026.
Key Findings
- Special needs plan enrollment rose from 1.3 million in 2010 to 8.2 million in 2026, more than six times as many people. D-SNPs enrolled 6.4 million, 78% of all special needs plan members.
- C-SNP enrollment rose from 1,150,764 in 2025 to 1,668,487 in 2026, an increase of 45.0%. D-SNP enrollment grew 6.4% in the same year.
- In 11 states, special needs plans held at least a quarter of Medicare Advantage enrollment in 2026, led by Mississippi (46%), Arkansas (40%), and New York (37%). KFF found that 28% of dual-eligible Medicare Advantage enrollees with full Medicaid benefits were in plans open to all beneficiaries.
Medicare Advantage Enrollment by Parent Organization
Medicare Advantage plans are sold by hundreds of contracts, but most enrollees are in plans owned by a few large insurers. KFF groups plans by parent organization using CMS enrollment data for March of each year.
| Parent organization | Enrollees, 2025 | Enrollees, 2026 | Change | Share, 2026 |
|---|---|---|---|---|
| UnitedHealth Group | 9,902,837 | 9,256,079 | -646,758 | 26.3% |
| Humana | 5,721,711 | 7,023,428 | +1,301,717 | 19.9% |
| CVS Health (Aetna) | 4,078,959 | 4,050,030 | -28,929 | 11.5% |
| Kaiser Permanente (Kaiser Foundation Health Plan) | 1,951,484 | 2,038,285 | +86,801 | 5.8% |
| Elevance Health | 2,226,608 | 1,880,531 | -346,077 | 5.3% |
| All other parent organizations | 10,256,897 | 10,960,374 | +703,477 | 31.1% |
| Total | 34,138,496 | 35,208,727 | +1,070,231 | 100.0% |
Source: KFF, Medicare Advantage in 2026: Enrollment Update and Key Trends, July 2026.
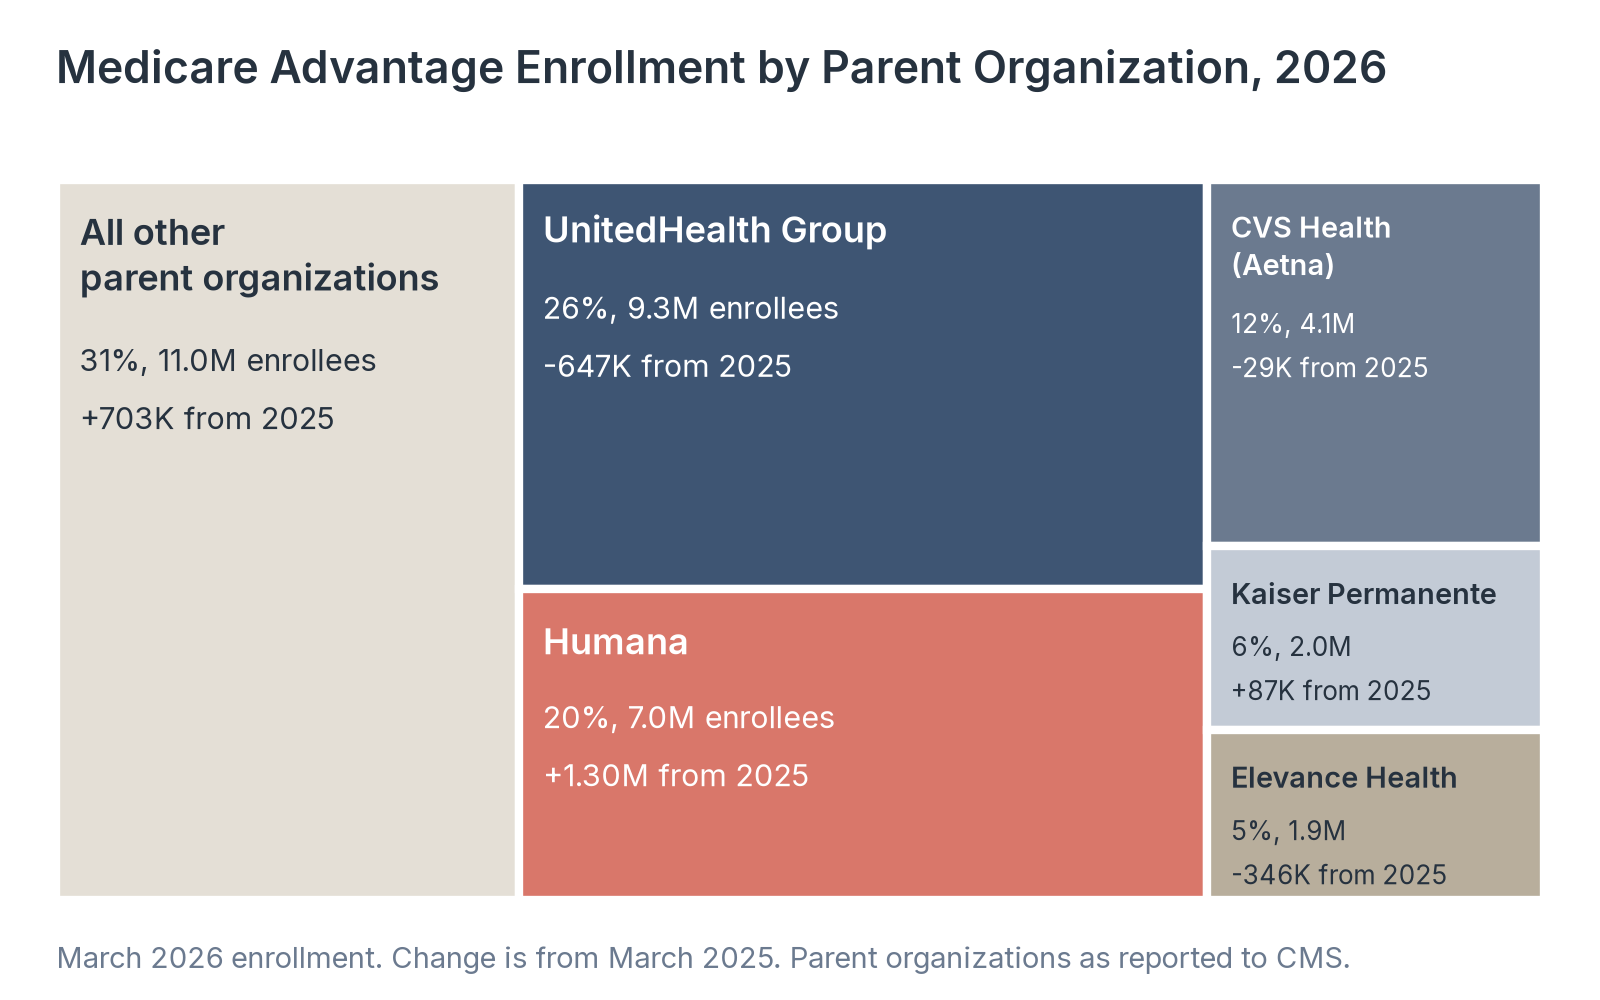
Source: Healthcare Industry Reviews analysis of KFF data, conducted November 2026.
Key Findings
- UnitedHealth Group enrolled 9.3 million people in 2026, 26% of the market, down 647,000 from 2025. Humana gained 1.3 million members, to 7.0 million (20%).
- Elevance Health lost 346,000 members (15.5%), and CVS Health was nearly flat. Among smaller insurers, Devoted Health added about 258,000 members, SCAN Group 136,000, and Aware Integrated 89,000.
- UnitedHealth Group and Humana together held 46% of enrollment, the same as in 2025. In 28% of counties (889), the two companies held at least 75% of Medicare Advantage enrollment.
What Medicare Advantage Enrollment Figures Show About Medicare
More than half of people eligible for Medicare Advantage now use it, and growth continued in 2026 at a slower pace. The program covers about two-thirds of beneficiaries in states such as Michigan, Alabama, and Rhode Island, and still small in Alaska, Vermont, and Wyoming.
The 2026 data also show two shifts inside the program. Special needs plans, especially for people with chronic conditions, account for a growing share of members, and enrollment moved between the largest insurers, with Humana gaining and UnitedHealth Group and Elevance Health losing members.
So if you are citing Medicare Advantage enrollment, give the month, the source, and the denominator, because KFF's 55%, CMS's 55.9% for beneficiaries with Parts A and B, and the 51% penetration rate for all eligibles all describe the same program in 2026.
Data Collection and Methodology
National enrollment, plan type, special needs plan, and parent organization figures come from KFF, which uses CMS Medicare Advantage enrollment files for March of each year and counts beneficiaries with both Part A and Part B as eligible. KFF excludes cost plans, PACE, health care prepayment plans, and Medicare-Medicaid plans. Its projections for 2027 to 2036 come from the Congressional Budget Office's February 2026 Medicare baseline, which uses people enrolled in Part B as the denominator.
We calculated state shares from the CMS Medicare Monthly Enrollment data for July 2016 and July 2026 by dividing beneficiaries with Parts A and B in Medicare Advantage and other private plans by all beneficiaries with Parts A and B. County figures are from the CMS State/County Penetration file for October 2026, which divides Medicare Advantage enrollment by all Medicare eligibles; we counted the 3,083 counties with a reported penetration rate in the 50 states and DC, excluding Connecticut and Alaska, which CMS left out of that month's file. Plan type counts are from the CMS Monthly Contract and Enrollment Summary Reports for October 2025 and October 2026. We calculated shares, changes, and medians from the published values.
Sources
- Healthcare Industry Reviews analysis of KFF Medicare Advantage enrollment data for 2007 to 2026 and CMS enrollment, penetration, and contract summary data for 2016 to 2026, conducted November 2026.
- KFF. Medicare Advantage in 2026: Enrollment Update and Key Trends. July 2026.
- Centers for Medicare & Medicaid Services. Medicare Monthly Enrollment. Data for July 2016 and July 2026.
- Centers for Medicare & Medicaid Services. Medicare Advantage State/County Penetration. October 2026.
- Centers for Medicare & Medicaid Services. Monthly Contract and Enrollment Summary Report. October 2025 and October 2026.