Medicare Telehealth Statistics: 2026 Report
Published
Our analysts worked through all 37,324 rows of the Centers for Medicare & Medicaid Services' Medicare Telehealth Trends file, which counts the traditional Medicare patients who used telehealth in each quarter from January 2020 to March 2026, by state, age, rural or urban home, and other patient traits. Together the counts show who in Medicare still uses telehealth six years after the pandemic expansion, and how use differs by state and patient group as of Q4 2026.
Key Findings
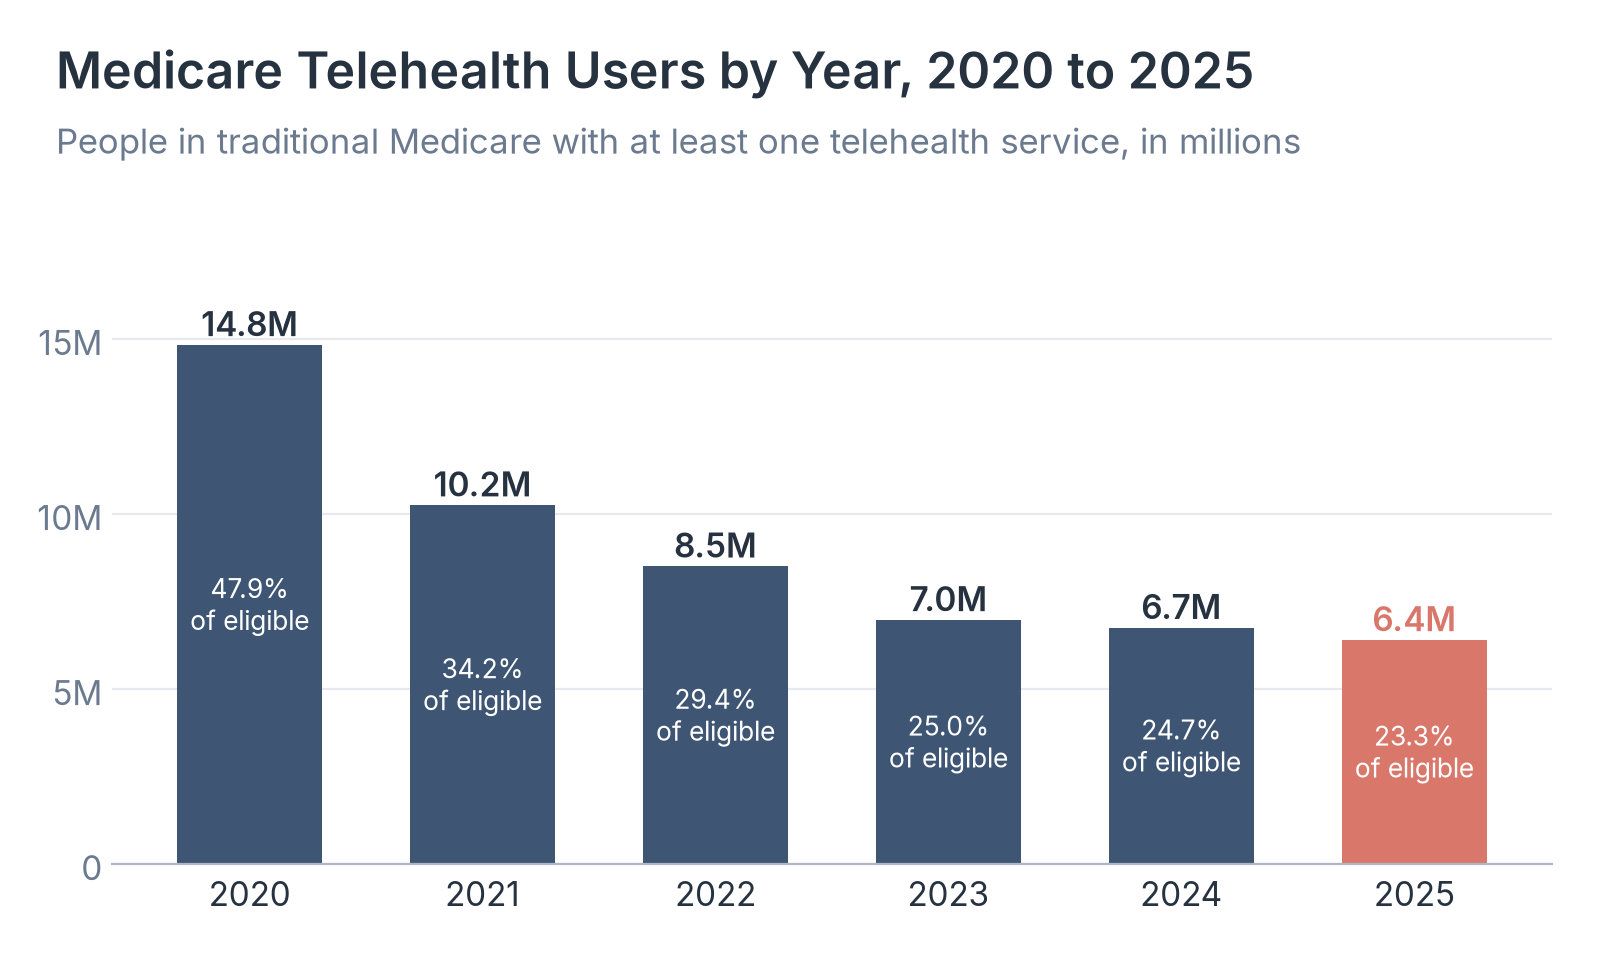
- 6.4 million people in traditional Medicare used telehealth in 2025, 23.3% of the 27.5 million who received a service that can be delivered by telehealth, down from 14.8 million and 47.9% in 2020.
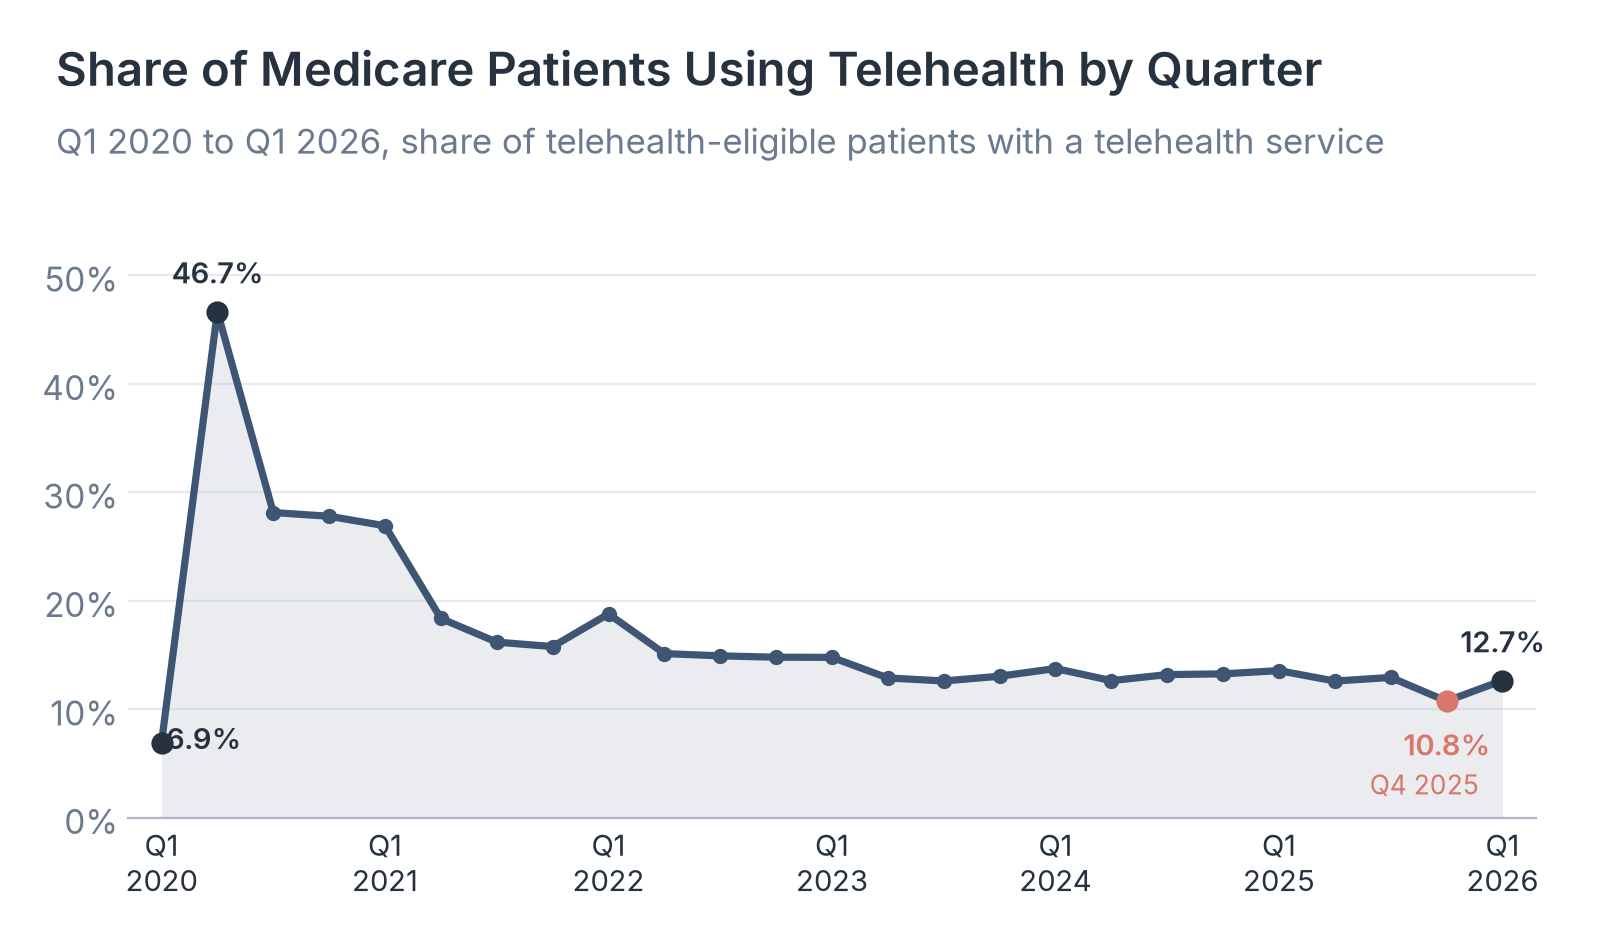
- Telehealth use fell to 10.8% of eligible patients in Q4 2025, the lowest quarter since Q1 2020, then rose to 12.7% in Q1 2026.
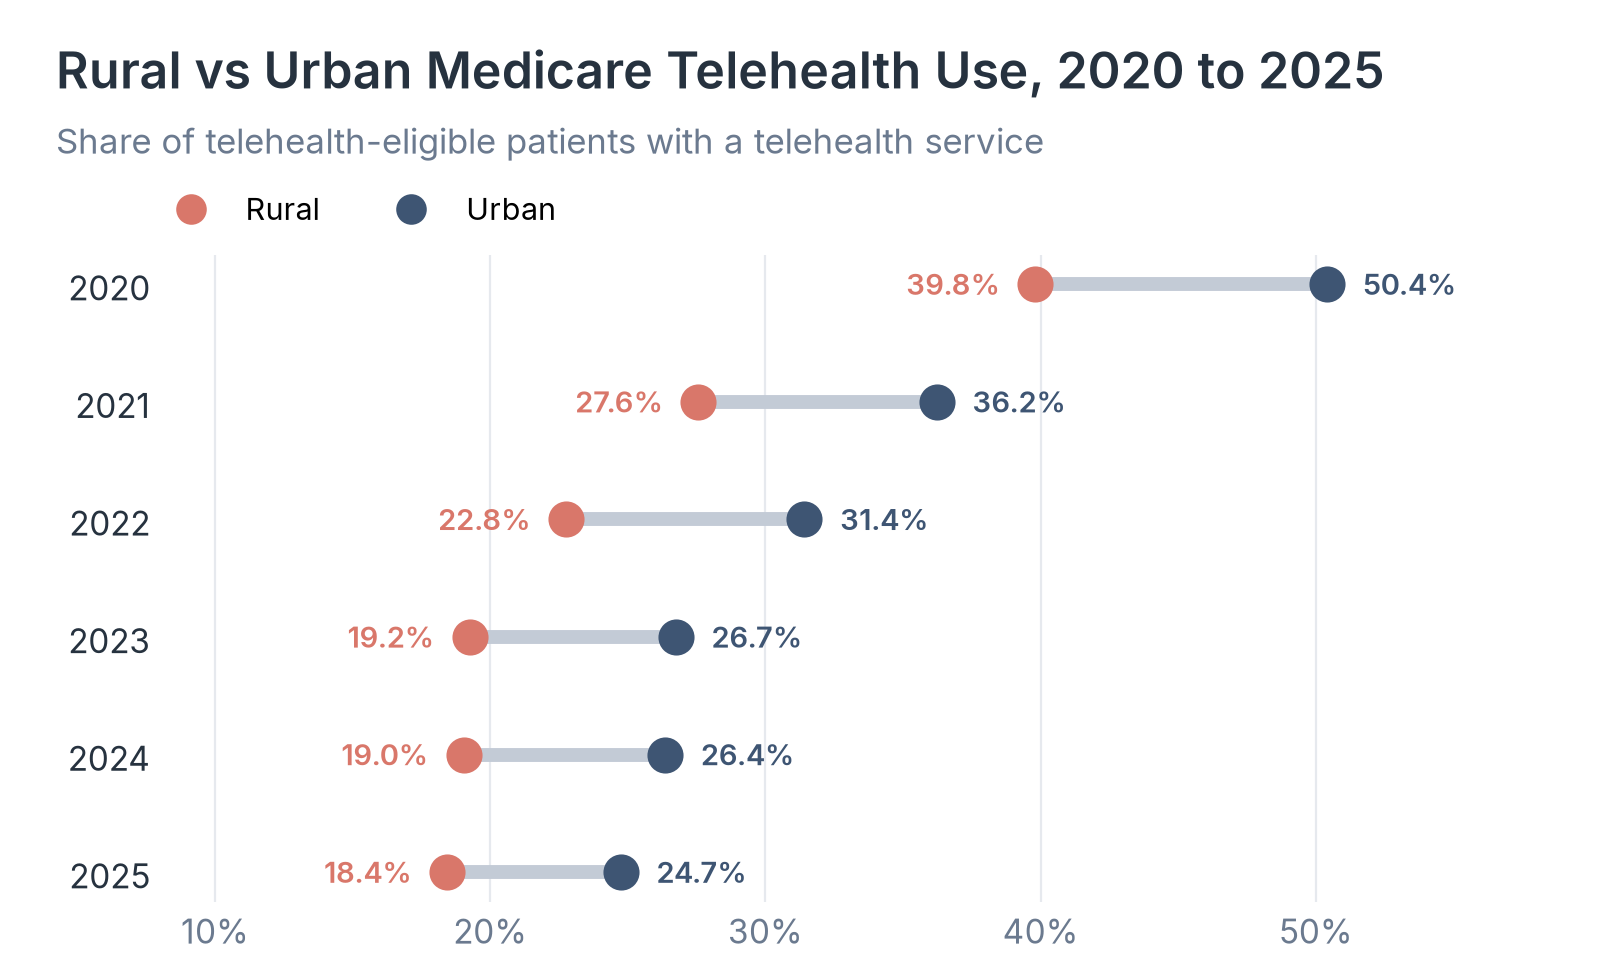
- Rural Medicare patients used telehealth at 18.4% in 2025, compared with 24.7% for urban patients.
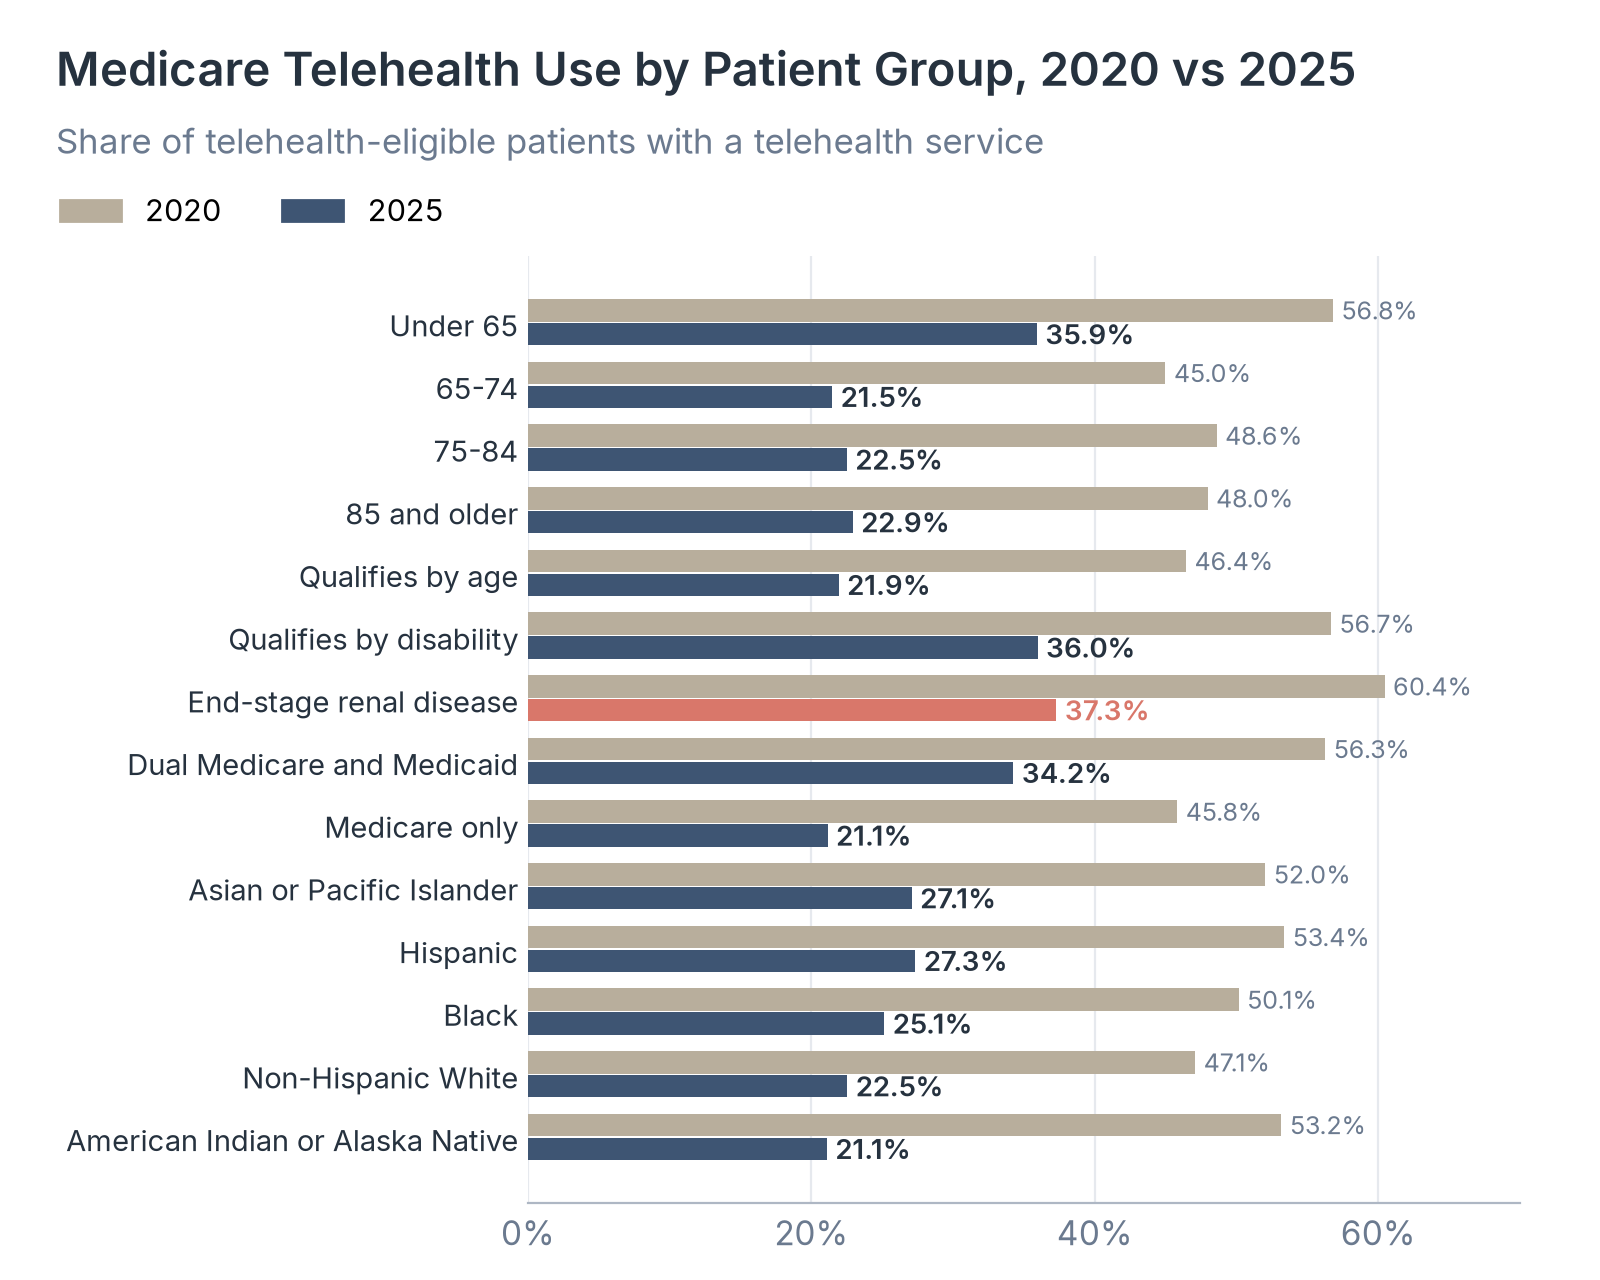
- Patients enrolled in both Medicare and Medicaid used telehealth at 34.2% in 2025, compared with 21.1% for patients in Medicare only.
- California had the highest state rate in 2025 at 40.3%, and Iowa had the lowest at 10.1%.
Before March 2020, Medicare paid for telehealth mainly for patients in rural areas, who usually had to travel to an approved clinic or doctor's office for the video visit. When the COVID-19 pandemic began, federal waivers let any Medicare patient see a clinician by video or phone from home, and use jumped almost overnight. Congress has extended most of those rules several times since, and they now run through December 31, 2027, according to KFF. Six years on, the question for clinicians, health systems, and virtual-care companies is how many Medicare patients kept using telehealth once the emergency passed. The answer differs a great deal by where patients live and why they qualify for Medicare.
Our analysts used the Medicare Telehealth Trends data file that CMS released in September 2026. It covers Medicare fee-for-service Part B claims for services from January 1, 2020 to March 31, 2026 that CMS had received by August 18, 2026. CMS counts a patient as telehealth-eligible if they received at least one service on Medicare's list of covered telehealth services, in person or remotely, and as a telehealth user if at least one of those services was delivered by telehealth, including audio-only calls. We calculated every share from the raw counts in the file. The file does not include Medicare Advantage.
In the following sections, we compare yearly and quarterly use, the gap between rural and urban patients, use by age, Medicare eligibility, Medicaid status, and race and ethnicity, and use in every state.
How Many People in Traditional Medicare Use Telehealth Each Year
Yearly counts are the simplest way to see how far telehealth has fallen from its 2020 peak and where it has leveled off. CMS reports both the number of patients who used telehealth and the number who received any service that could have been delivered that way, so the share accounts for changes in how many patients needed care.
| Year | Telehealth-eligible patients | Telehealth users | Share using telehealth |
|---|---|---|---|
| 2020 | 30,946,785 | 14,826,919 | 47.9% |
| 2021 | 29,967,346 | 10,249,756 | 34.2% |
| 2022 | 28,885,208 | 8,503,157 | 29.4% |
| 2023 | 27,896,098 | 6,971,495 | 25.0% |
| 2024 | 27,358,732 | 6,748,365 | 24.7% |
| 2025 | 27,524,672 | 6,400,135 | 23.3% |
Source: Centers for Medicare & Medicaid Services, Medicare Telehealth Trends data file, Q1 2026 release, September 2026.
Source: Healthcare Industry Reviews analysis of the Centers for Medicare & Medicaid Services Medicare Telehealth Trends data file, September 2026.
Key Findings
- The number of telehealth users fell 57% from 2020 to 2025, while the number of patients who received a telehealth-eligible service fell 11%. Most of the decline reflects fewer patients using telehealth for care they were still receiving.
- The decline slowed after 2023. The share using telehealth went from 25.0% in 2023 to 24.7% in 2024 and 23.3% in 2025, a drop of 1.7 points in two years after a drop of 22.9 points in the three years before.
- Nearly one in four Medicare patients who receive a telehealth-eligible service now uses telehealth at least once a year. For practices and virtual-care companies, that is a steady group of patients who use telehealth alongside in-person visits, and the next test is whether the share holds through 2027, when the current coverage rules end.
Medicare Telehealth Use by Quarter, 2020 to 2026
Quarterly figures show the shape of the decline in more detail, including short swings that yearly totals smooth over. Each quarter counts patients who used telehealth during those three months, so quarterly shares run lower than yearly ones.
| Year | Q1 | Q2 | Q3 | Q4 |
|---|---|---|---|---|
| 2020 | 6.9% | 46.7% | 28.1% | 27.8% |
| 2021 | 26.9% | 18.4% | 16.2% | 15.8% |
| 2022 | 18.8% | 15.1% | 14.9% | 14.8% |
| 2023 | 14.8% | 12.9% | 12.6% | 13.1% |
| 2024 | 13.8% | 12.6% | 13.2% | 13.3% |
| 2025 | 13.6% | 12.6% | 12.9% | 10.8% |
| 2026 | 12.7% | Not yet reported | Not yet reported | Not yet reported |
Source: Centers for Medicare & Medicaid Services, Medicare Telehealth Trends data file, Q1 2026 release, September 2026.
Source: Healthcare Industry Reviews analysis of the Centers for Medicare & Medicaid Services Medicare Telehealth Trends data file, September 2026.
Key Findings
- Use peaked at 46.7% of eligible patients in Q2 2020, up from 6.9% in Q1 2020, the quarter the pandemic waivers began. By Q2 2023 it had fallen to 12.9%, and it stayed between 12.6% and 13.8% in every quarter from then through Q3 2025.
- Q4 2025 fell to 10.8%, the lowest quarter since early 2020. That quarter included the six weeks from October 1 to November 12, 2025, when Medicare coverage of many telehealth services lapsed during the federal government shutdown before Congress restored it retroactively, according to KFF.
- Use recovered to 12.7% in Q1 2026, 0.9 points below the 13.6% of Q1 2025. CMS calls all of these figures preliminary because more claims arrive over time, so a small quarter-to-quarter change is worth rechecking in the next release.
How Telehealth Use Differs for Rural and Urban Medicare Patients
Medicare first covered telehealth as a way to reach rural patients, so the rural rate is a useful test of who the expansion has served since 2020. CMS assigns each patient to a rural or urban area using the ZIP code of their mailing address.
| Year | Rural share | Urban share | Gap (points) | Rural telehealth users |
|---|---|---|---|---|
| 2020 | 39.8% | 50.4% | 10.6 | 2,859,483 |
| 2021 | 27.6% | 36.2% | 8.7 | 1,900,548 |
| 2022 | 22.8% | 31.4% | 8.7 | 1,483,958 |
| 2023 | 19.2% | 26.7% | 7.5 | 1,238,658 |
| 2024 | 19.0% | 26.4% | 7.3 | 1,183,957 |
| 2025 | 18.4% | 24.7% | 6.3 | 1,187,794 |
Source: Centers for Medicare & Medicaid Services, Medicare Telehealth Trends data file, Q1 2026 release, September 2026.
Source: Healthcare Industry Reviews analysis of the Centers for Medicare & Medicaid Services Medicare Telehealth Trends data file, September 2026.
Key Findings
- Urban patients have used telehealth more than rural patients in every year since 2020. The gap narrowed from 10.6 points in 2020 to 6.3 points in 2025, because urban use fell 25.7 points and rural use fell 21.4 points.
- Rural patients made up 23.4% of telehealth-eligible patients in 2025 but 18.6% of telehealth users. Rural use has changed little since 2023, moving from 19.2% to 18.4%.
- KFF points to gaps in broadband and other communication technology as one likely reason for the lower rural rate. It also notes that rural patients without reliable video could lose more access if Medicare's coverage of audio-only visits is reduced.
Which Medicare Patients Use Telehealth Most
Medicare covers people 65 and older as well as younger people with long-term disabilities or kidney failure, and these groups use health care very differently. We compared telehealth use by age, reason for Medicare eligibility, Medicaid status, sex, and race and ethnicity.
| Patient group | Category | 2020 | 2025 | Change (points) |
|---|---|---|---|---|
| Under 65 | Age | 56.8% | 35.9% | -20.9 |
| 65-74 | Age | 45.0% | 21.5% | -23.5 |
| 75-84 | Age | 48.6% | 22.5% | -26.1 |
| 85 and older | Age | 48.0% | 22.9% | -25.0 |
| Qualifies by age | Medicare eligibility | 46.4% | 21.9% | -24.5 |
| Qualifies by disability | Medicare eligibility | 56.7% | 36.0% | -20.7 |
| End-stage renal disease | Medicare eligibility | 60.4% | 37.3% | -23.2 |
| Dual Medicare and Medicaid | Medicaid status | 56.3% | 34.2% | -22.0 |
| Medicare only | Medicaid status | 45.8% | 21.1% | -24.7 |
| Female | Sex | 49.8% | 24.5% | -25.3 |
| Male | Sex | 45.5% | 21.6% | -23.9 |
| Asian or Pacific Islander | Race and ethnicity | 52.0% | 27.1% | -25.0 |
| Hispanic | Race and ethnicity | 53.4% | 27.3% | -26.0 |
| Black | Race and ethnicity | 50.1% | 25.1% | -25.0 |
| Non-Hispanic White | Race and ethnicity | 47.1% | 22.5% | -24.6 |
| American Indian or Alaska Native | Race and ethnicity | 53.2% | 21.1% | -32.1 |
Source: Centers for Medicare & Medicaid Services, Medicare Telehealth Trends data file, Q1 2026 release, September 2026. Groups within each category do not overlap; groups in different categories do.
Source: Healthcare Industry Reviews analysis of the Centers for Medicare & Medicaid Services Medicare Telehealth Trends data file, September 2026.
Key Findings
- Patients with end-stage renal disease (37.3%), patients who qualify through a disability (36.0%), and patients under 65 (35.9%) had the highest rates in 2025. Patients who qualify by age used telehealth at 21.9%.
- The gap between dual-eligible patients and patients in Medicare only grew from 10.4 points in 2020 to 13.1 points in 2025. KFF notes that dual-eligible patients are four times as likely as other Medicare patients to live on incomes under $20,000.
- American Indian and Alaska Native patients had the second-highest rate of the five racial and ethnic groups in 2020 at 53.2% and the lowest in 2025 at 21.1%, a drop of 32.1 points. Hispanic (27.3%) and Asian or Pacific Islander (27.1%) patients had the highest rates in 2025.
Medicare Telehealth Use in Every State
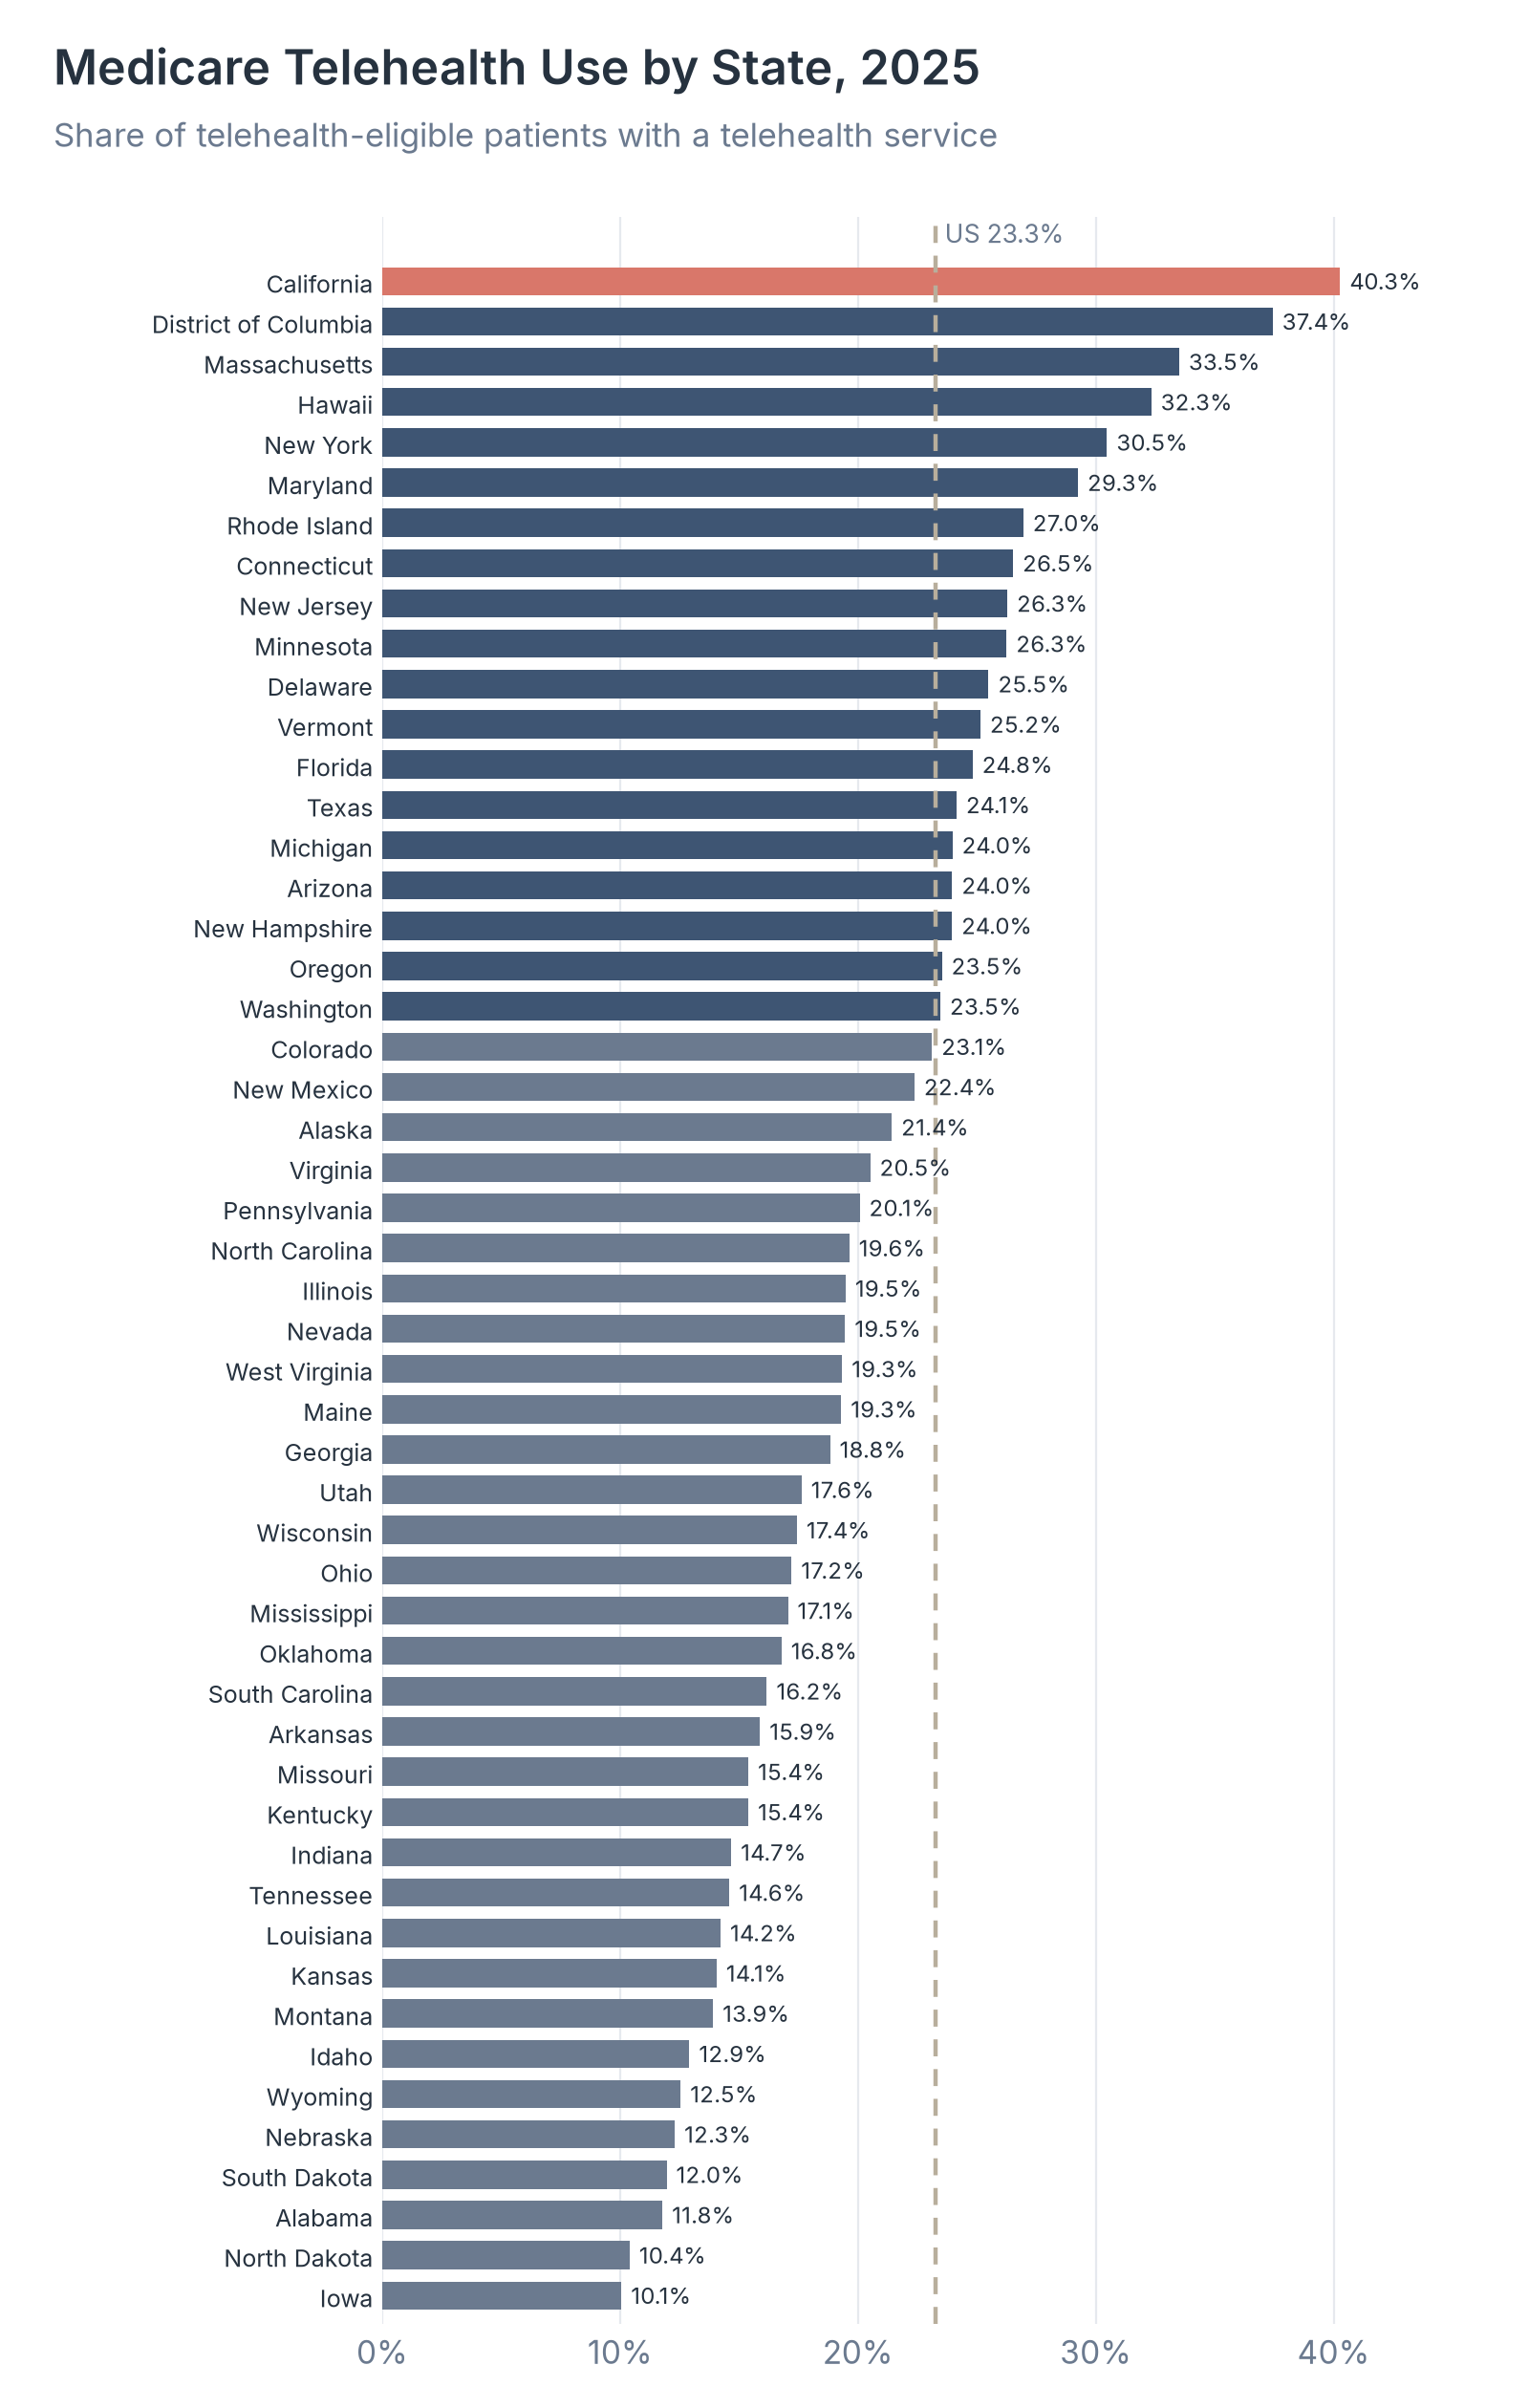
Where a patient lives shapes how likely they are to use telehealth, and CMS links the differences to broadband access, state rules on care delivered across state lines, and how hard the pandemic hit each area. The table lists every state and the District of Columbia, ranked by 2025 use, with 2020 for comparison.
| State | Telehealth-eligible patients, 2025 | Telehealth users, 2025 | Share, 2025 | Share, 2020 |
|---|---|---|---|---|
| California | 2,703,250 | 1,088,771 | 40.3% | 59.7% |
| District of Columbia | 46,398 | 17,370 | 37.4% | 58.8% |
| Massachusetts | 801,413 | 268,530 | 33.5% | 69.3% |
| Hawaii | 98,112 | 31,722 | 32.3% | 51.3% |
| New York | 1,537,839 | 468,624 | 30.5% | 53.5% |
| Maryland | 695,803 | 203,539 | 29.3% | 59.1% |
| Rhode Island | 76,111 | 20,515 | 27.0% | 66.2% |
| Connecticut | 259,034 | 68,704 | 26.5% | 58.6% |
| New Jersey | 873,763 | 229,646 | 26.3% | 55.7% |
| Minnesota | 381,085 | 100,042 | 26.3% | 51.2% |
| Delaware | 150,994 | 38,493 | 25.5% | 61.6% |
| Vermont | 99,691 | 25,074 | 25.2% | 55.3% |
| Florida | 1,931,649 | 479,458 | 24.8% | 48.2% |
| Texas | 1,763,112 | 425,738 | 24.1% | 50.8% |
| Michigan | 706,044 | 169,263 | 24.0% | 48.7% |
| Arizona | 615,690 | 147,538 | 24.0% | 50.9% |
| New Hampshire | 185,311 | 44,393 | 24.0% | 55.1% |
| Oregon | 346,485 | 81,530 | 23.5% | 48.9% |
| Washington | 616,791 | 144,728 | 23.5% | 42.7% |
| Colorado | 406,033 | 93,851 | 23.1% | 45.7% |
| New Mexico | 189,141 | 42,324 | 22.4% | 54.5% |
| Alaska | 94,239 | 20,188 | 21.4% | 47.7% |
| Virginia | 874,352 | 179,373 | 20.5% | 45.6% |
| Pennsylvania | 1,139,901 | 228,776 | 20.1% | 50.7% |
| North Carolina | 838,271 | 164,619 | 19.6% | 43.6% |
| Illinois | 1,154,734 | 224,971 | 19.5% | 45.7% |
| Nevada | 224,648 | 43,722 | 19.5% | 44.1% |
| West Virginia | 169,190 | 32,716 | 19.3% | 43.9% |
| Maine | 125,810 | 24,279 | 19.3% | 46.8% |
| Georgia | 737,693 | 138,887 | 18.8% | 40.9% |
| Utah | 177,771 | 31,338 | 17.6% | 40.4% |
| Wisconsin | 477,088 | 83,178 | 17.4% | 40.2% |
| Ohio | 932,711 | 160,528 | 17.2% | 47.5% |
| Mississippi | 323,015 | 55,093 | 17.1% | 42.9% |
| Oklahoma | 401,128 | 67,332 | 16.8% | 40.7% |
| South Carolina | 603,625 | 97,606 | 16.2% | 37.7% |
| Arkansas | 317,964 | 50,498 | 15.9% | 39.7% |
| Missouri | 522,266 | 80,393 | 15.4% | 35.5% |
| Kentucky | 393,586 | 60,585 | 15.4% | 45.9% |
| Indiana | 598,112 | 87,766 | 14.7% | 44.9% |
| Tennessee | 597,200 | 87,159 | 14.6% | 31.0% |
| Louisiana | 349,611 | 49,728 | 14.2% | 42.5% |
| Kansas | 351,127 | 49,356 | 14.1% | 31.3% |
| Montana | 159,671 | 22,210 | 13.9% | 30.8% |
| Idaho | 169,407 | 21,879 | 12.9% | 33.7% |
| Wyoming | 89,826 | 11,270 | 12.5% | 30.1% |
| Nebraska | 223,839 | 27,534 | 12.3% | 28.1% |
| South Dakota | 106,966 | 12,787 | 12.0% | 33.8% |
| Alabama | 364,263 | 42,912 | 11.8% | 42.0% |
| North Dakota | 83,419 | 8,675 | 10.4% | 25.8% |
| Iowa | 384,197 | 38,638 | 10.1% | 35.2% |
Source: Centers for Medicare & Medicaid Services, Medicare Telehealth Trends data file, Q1 2026 release, September 2026.
Source: Healthcare Industry Reviews analysis of the Centers for Medicare & Medicaid Services Medicare Telehealth Trends data file, September 2026.
Key Findings
- California (40.3%), the District of Columbia (37.4%), and Massachusetts (33.5%) had the highest rates in 2025. Iowa (10.1%), North Dakota (10.4%), and Alabama (11.8%) had the lowest.
- Rhode Island had the largest drop of any state from 2020 to 2025, from 66.2% to 27.0%, followed by Delaware and Massachusetts, which had the highest 2020 rate at 69.3%. States with lower rates in 2020, such as North Dakota and Nebraska, fell the least.
- Only 18 states and the District of Columbia were above the national rate of 23.3% in 2025. California alone accounted for 1,088,771 telehealth users, 17.0% of the national total. Without California, the national rate would have been 21.4%.
What Medicare Telehealth Statistics Show About Virtual Care in 2026
For people with Medicare, telehealth has become a regular but minority way of seeing a clinician. It is used most by people with disabilities, kidney failure, or low incomes, and least by rural patients and by patients in states such as Iowa and North Dakota.
Use has been close to flat since 2023 while Congress extended coverage several times on short deadlines. The Q4 2025 dip came in the same quarter as a six-week lapse in coverage, and the current rules run through December 31, 2027.
So if you cite a Medicare telehealth rate, say whether it is a yearly or a quarterly figure, because the 2025 rate is 23.3% for the full year and between 10.8% and 13.6% for each quarter.
Data Collection and Methodology
All counts come from the Centers for Medicare & Medicaid Services (CMS) Medicare Telehealth Trends public use file for Q1 2026 (file TMEDTREND_PUBLIC_260914, 37,324 rows), which we downloaded and analyzed on November 3, 2026, along with the accompanying Medicare Telehealth Trends Report snapshot. The file covers Medicare fee-for-service Part B claims for services from January 1, 2020 to March 31, 2026, received by August 18, 2026. CMS describes all figures as preliminary, and counts can change as more claims are processed. Medicare Advantage encounters are not included.
A telehealth-eligible patient received at least one service on the CMS list of covered telehealth services during the period, delivered in person or by telehealth. A telehealth user received at least one of those services by telehealth, including audio-only telehealth. Each share is telehealth users divided by telehealth-eligible patients, which we calculated from the raw counts and rounded once to one decimal place, so some values differ by 0.1 point from the rounded shares in the CMS file and report. Yearly figures count each patient once per year; quarterly figures count each patient once per quarter. The 2026 figures cover Q1 only.
Rural and urban status comes from the patient's mailing ZIP code using the Rural-Urban Commuting Area crosswalk. Eligibility groups follow CMS: patients who had end-stage renal disease at any time in the period are counted as end-stage renal disease, and the rest as qualifying by age or disability. Patients enrolled in Medicare and Medicaid at any time in the period are counted as dual-eligible. Race and ethnicity use the Research Triangle Institute race code that CMS applies to its enrollment data; the Other or Unknown group has no values in the file and is not shown. State tables cover the 50 states and the District of Columbia and leave out Puerto Rico, other territories, and records with no state. We calculated products, differences, and ratios from the published values.
Sources
- Healthcare Industry Reviews, Medicare Telehealth Study: analysis of 37,324 rows of the CMS Medicare Telehealth Trends file covering Q1 2020 to Q1 2026, by year, quarter, rural or urban area, patient group, and state, conducted November 2026.
- Centers for Medicare & Medicaid Services. Medicare Telehealth Trends. Data page, Q1 2026 release, September 2026. Data file (CSV).
- Centers for Medicare & Medicaid Services. Medicare Telehealth Trends Report: Medicare FFS Part B Claims Data, January 1, 2020 to March 31, 2026. September 2026.
- Cottrill A., Cubanski J., Neuman T. KFF. What to Know About Medicare Coverage of Telehealth. March 19, 2026.