Mental Health Provider Shortage Statistics: 2026 Report
Published
Our analysts reviewed the 7,127 mental health shortage areas the federal government had designated as of September 30, 2026, matched each state's designated population against 2025 Census estimates, and compared the results with HRSA's December 2025 behavioral health workforce projections for 2038. The figures show how large the current mental health provider shortage is, which states and rural places it affects most, and which occupations are projected to remain short as of Q4 2026.
Key Findings
- 7,127 mental health Health Professional Shortage Areas covered 154,557,656 people as of September 30, 2026 and only 26.24% of the need in those areas was met.
- 7,796 more mental health practitioners would be needed to remove every mental health HPSA designation.
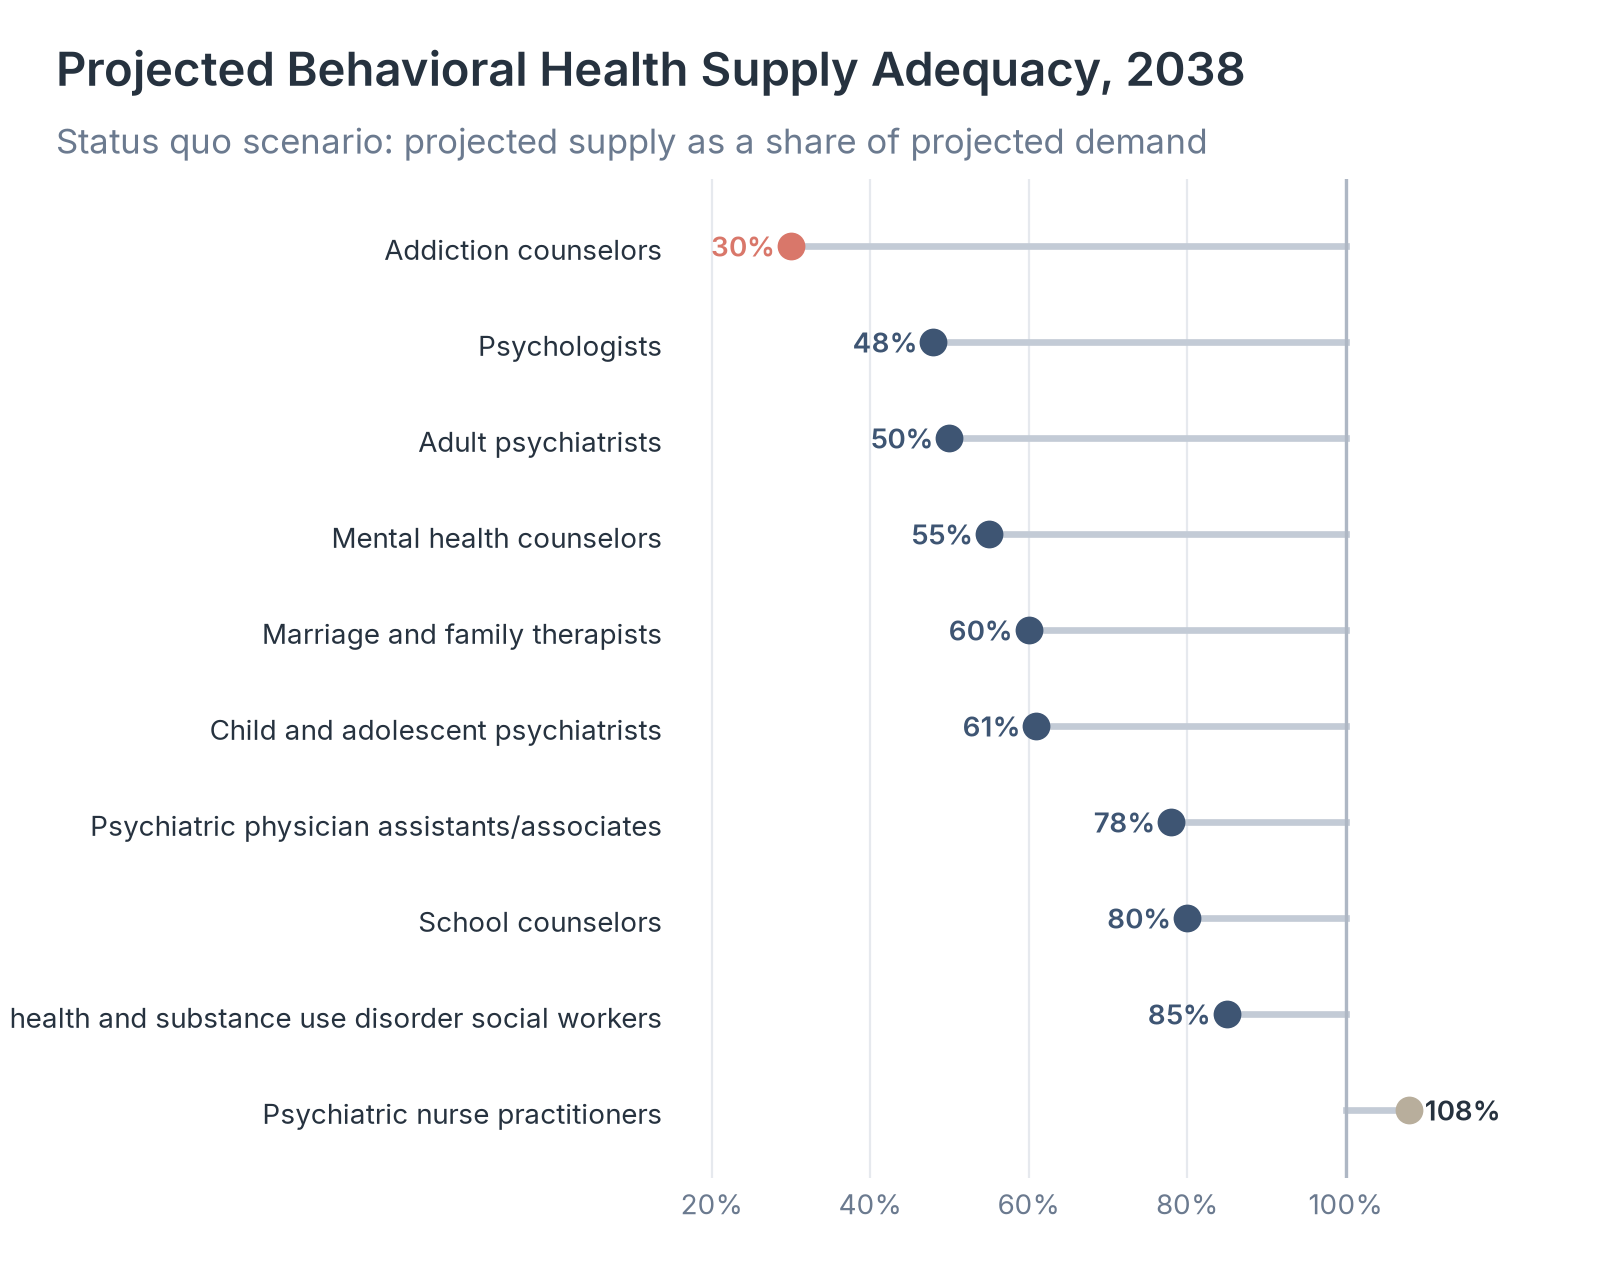
- HRSA projects shortages in 2038 for adult psychiatrists (supply meeting 50% of demand), psychologists (48%), and mental health counselors (55%) under its status quo scenario.
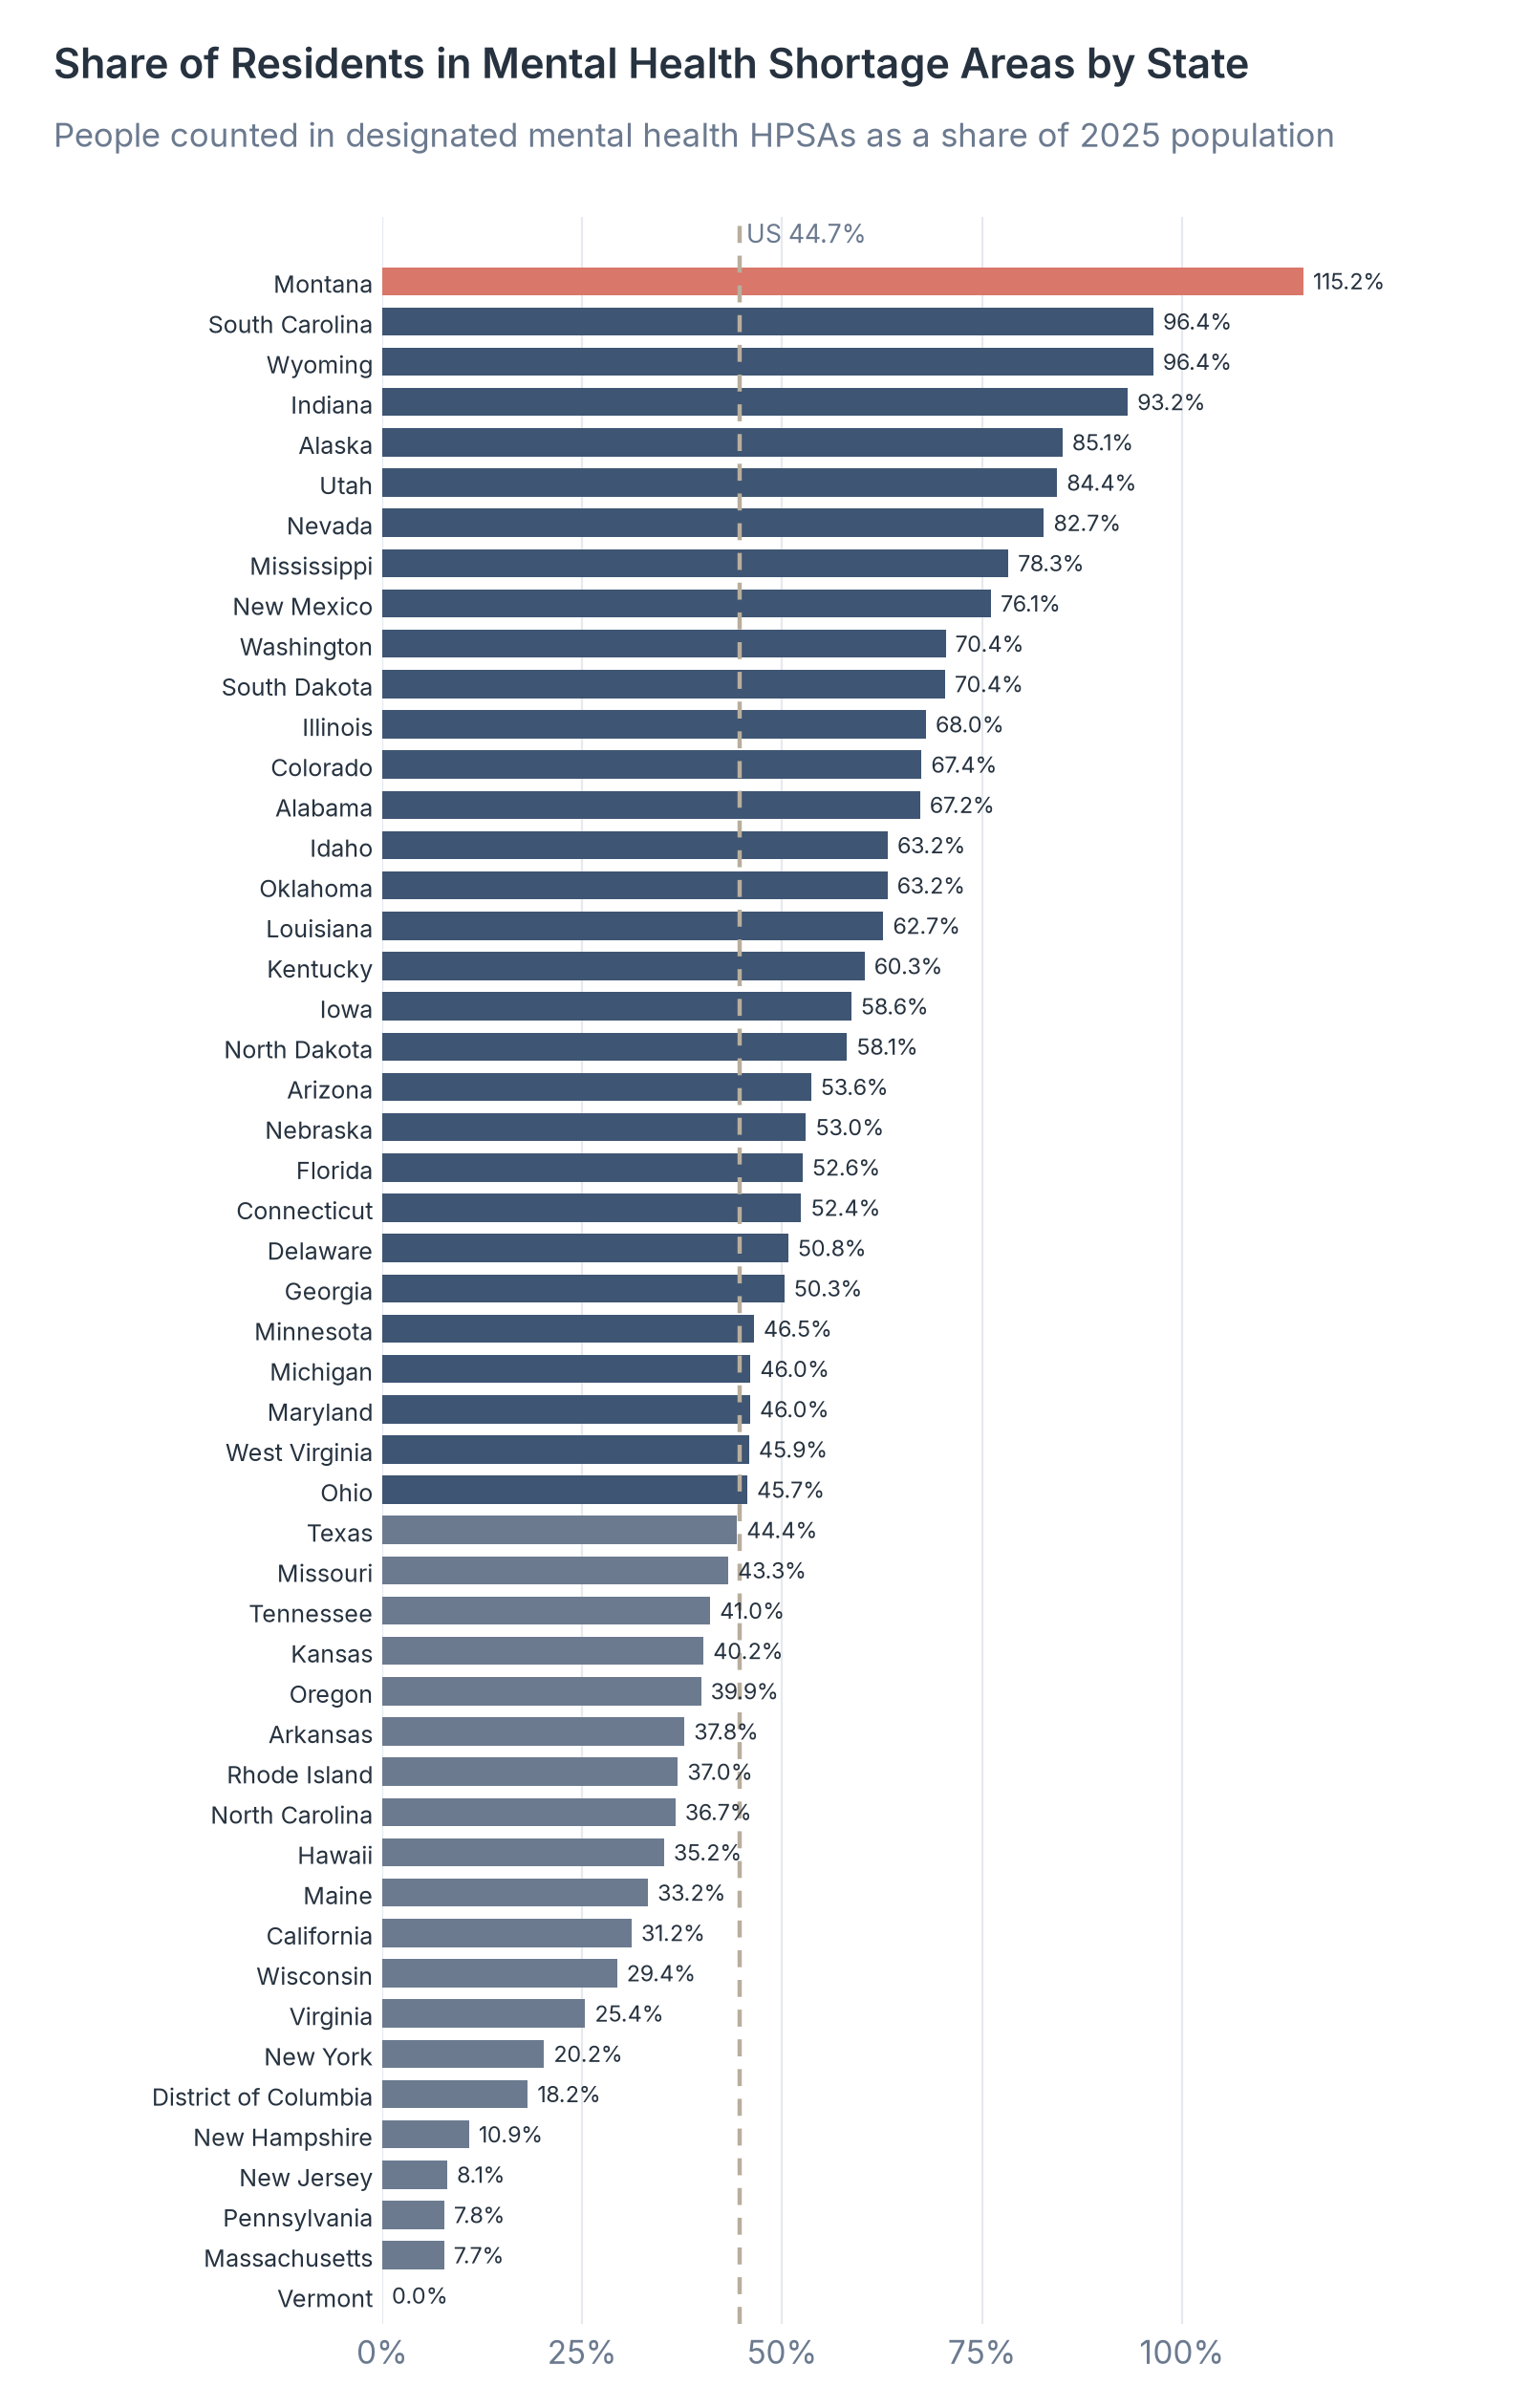
- Montana had the highest share of residents counted in mental health shortage areas at 115.2%, reflecting overlapping designations, followed by South Carolina and Wyoming at 96.4%.
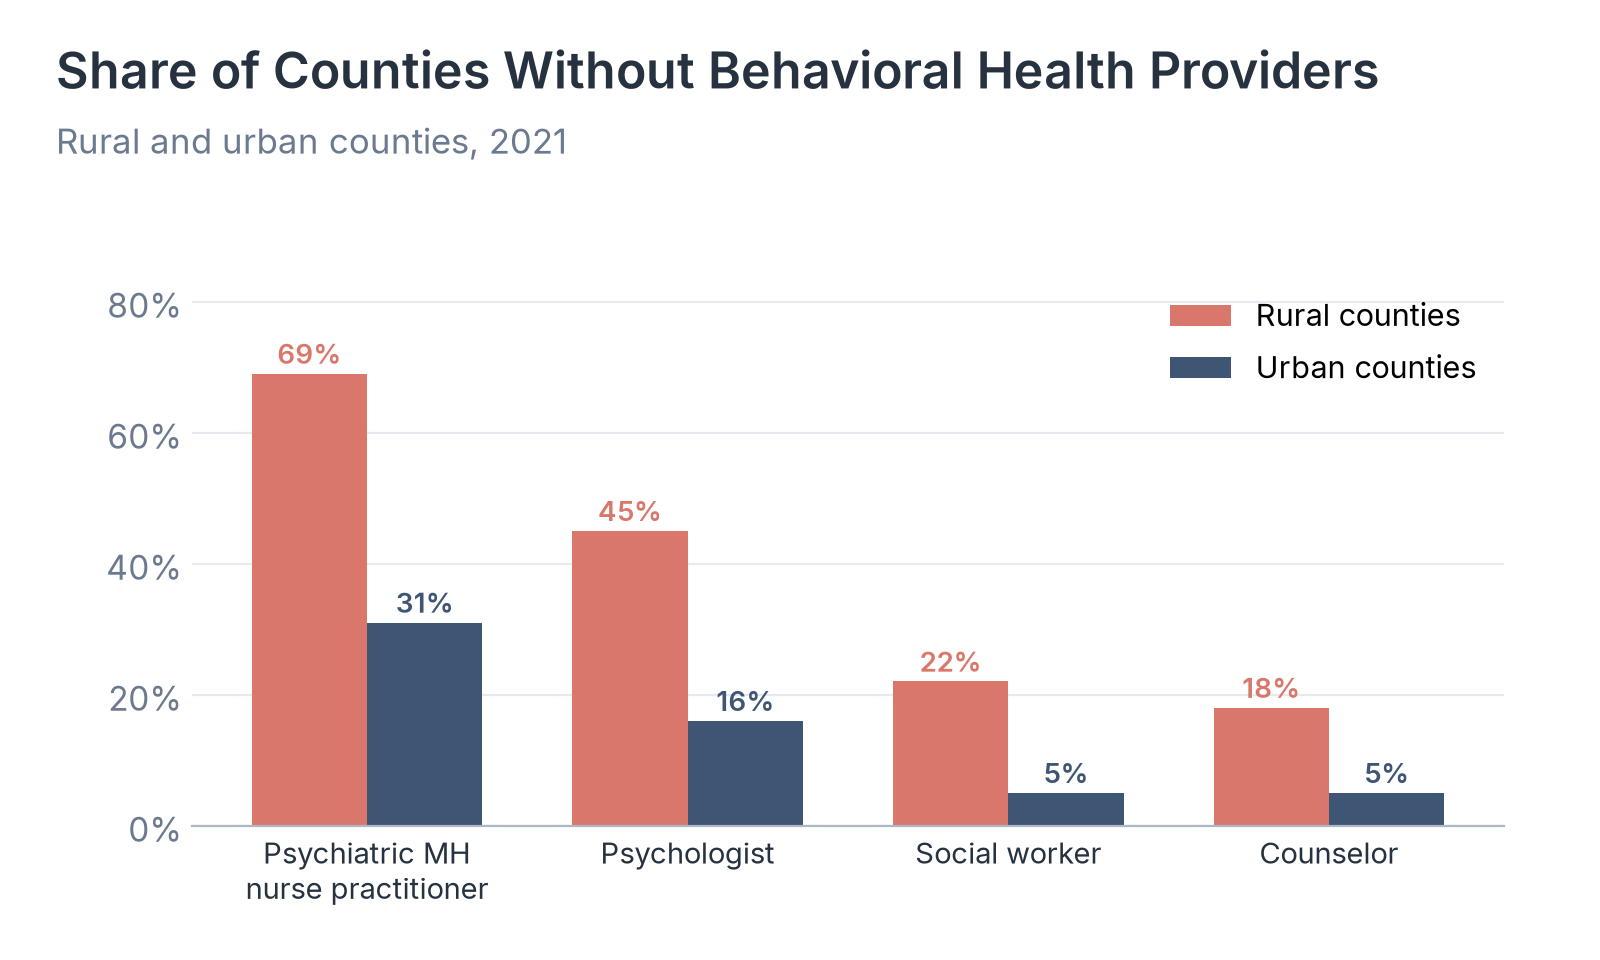
- 69% of rural counties had no psychiatric mental health nurse practitioner in 2021, compared with 31% of urban counties.
A mental health provider shortage means longer waits for counseling and psychiatry, more untreated illness, and heavier loads for the clinicians who remain. About 62 million US adults (23%) had a mental illness in 2024, and nearly half of them (48%) did not receive treatment, according to the Substance Abuse and Mental Health Services Administration (SAMHSA) as cited by HRSA. Hospitals, community clinics, telehealth companies, and staffing firms plan around where those shortages are and which occupations are scarcest.
Our analysts used HRSA's Designated HPSA Quarterly Summary as of September 30, 2026 for current shortage areas by type, rurality and state. We divided each state's mental health HPSA population by its 2025 Census Bureau population estimate. For the outlook, we used HRSA's State of the Behavioral Health Workforce brief published in December 2025, which reports Health Workforce Simulation Model projections for 2038.
In the following sections, we compare mental health shortage areas by type and rurality, projected adequacy by occupation, rural and urban county gaps, shortage areas in every state, and the practitioners each state still needs.
Mental Health Shortage Areas by Type
HRSA designates a mental health HPSA when a geographic area, population group, or facility has too few mental health providers for its population. Designations can be based on psychiatrists alone, on a broader group of core mental health providers, or on both.
| Type | Designations | People in designated areas | Share of need met | Practitioners needed |
|---|---|---|---|---|
| All mental health HPSAs | 7,127 | 154,557,656 | 26.24% | 7,796 |
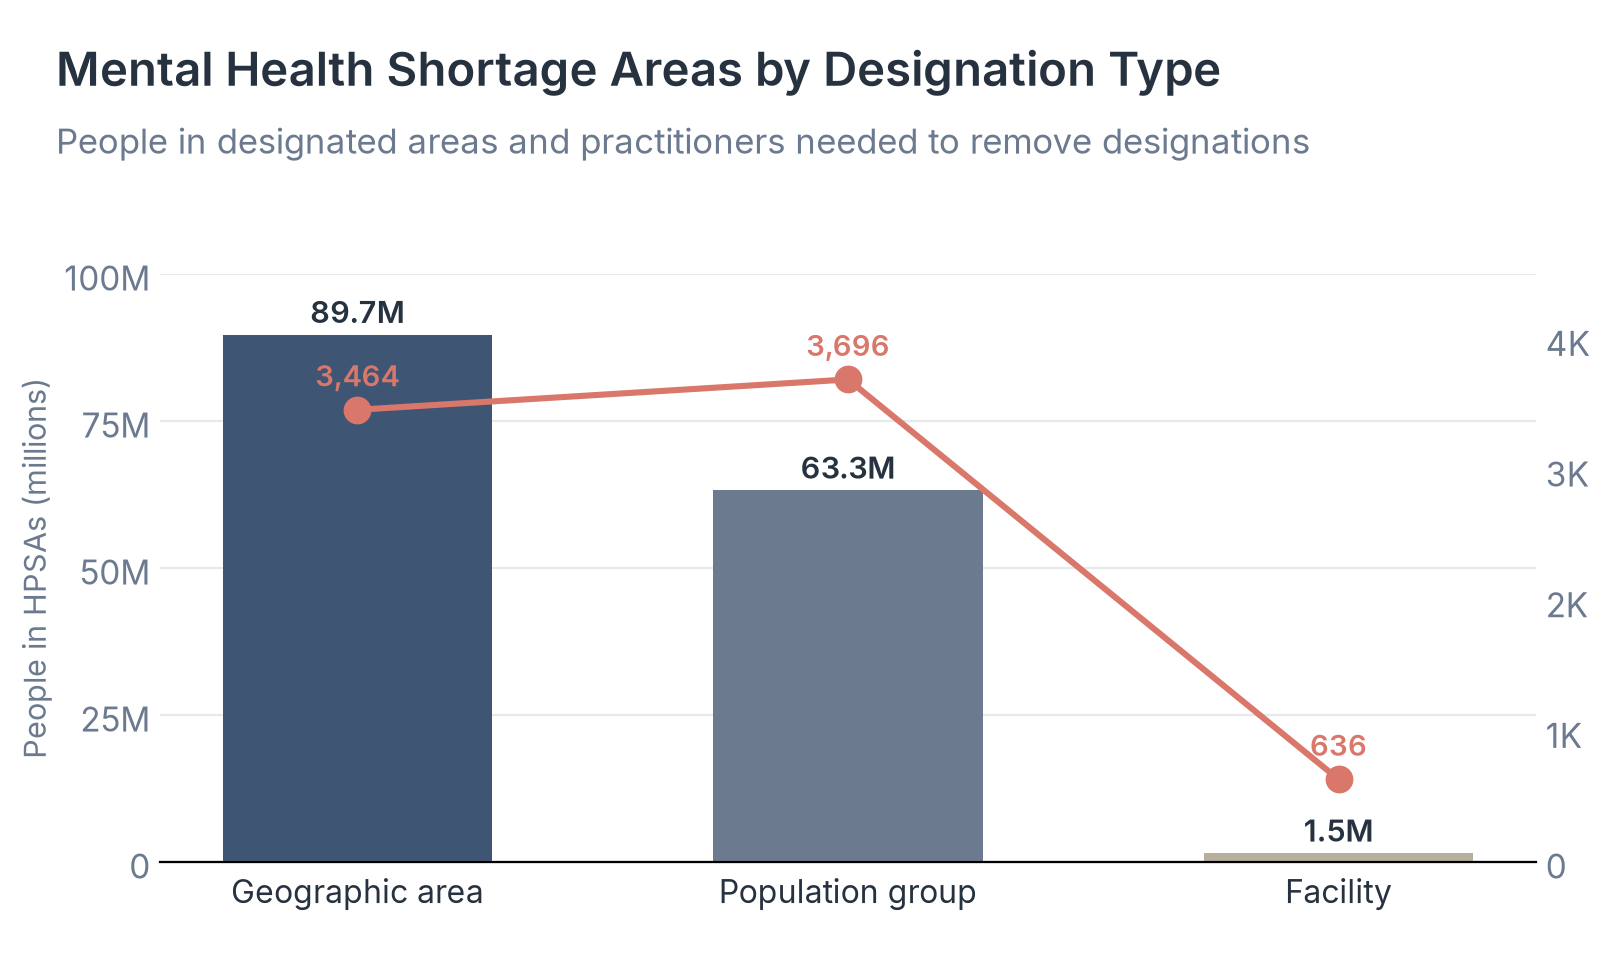
| Geographic area | 1,173 | 89,745,770 | 32.74% | 3,464 |
| Population group | 960 | 63,270,010 | 17.16% | 3,696 |
| Facility | 4,994 | 1,541,876 | 33.69% | 636 |
Source: Health Resources and Services Administration, Designated HPSA Quarterly Summary, fourth quarter of fiscal year 2026, as of September 30, 2026.
Source: Health Resources and Services Administration, Designated HPSA Quarterly Summary, fourth quarter of fiscal year 2026, as of September 30, 2026.
Key Findings
- Geographic area designations cover the most people, 89,745,770, and need 3,464 more practitioners to be removed. Population group designations cover 63,270,010 people and need 3,696 practitioners, the largest practitioner gap of the three types.
- Facility designations are the most numerous at 4,994 of 7,127, but they cover only 1,541,876 people because they mainly count correctional internees and mental hospital inpatients.
- Across all mental health HPSAs, only 26.24% of need was met as of September 30, 2026, far below the 46.75% need-met rate for primary care HPSAs on the same date.
Projected Behavioral Health Shortages for 2038
HRSA's Health Workforce Simulation Model projects supply and demand for behavioral health occupations in full-time equivalents of 40 hours a week. The status quo scenario assumes current production and use patterns continue.
| Occupation | Projected gap (FTE) | Supply as share of demand | Projected position |
|---|---|---|---|
| Addiction counselors | 77,050 | 30% | Shortage |
| Adult psychiatrists | 36,780 | 50% | Shortage |
| Child and adolescent psychiatrists | 7,030 | 61% | Shortage |
| Marriage and family therapists | 33,840 | 60% | Shortage |
| Mental health counselors | 99,780 | 55% | Shortage |
| Mental health and substance use disorder social workers | 17,030 | 85% | Shortage |
| Psychologists | 99,840 | 48% | Shortage |
| Psychiatric nurse practitioners | 2,940 | 108% | Surplus |
| Psychiatric physician assistants/associates | 1,310 | 78% | Shortage |
| School counselors | 39,680 | 80% | Shortage |
Source: Health Resources and Services Administration, National Center for Health Workforce Analysis, State of the Behavioral Health Workforce, 2025, December 2025.
Source: Health Resources and Services Administration, National Center for Health Workforce Analysis, State of the Behavioral Health Workforce, 2025, December 2025.
Key Findings
- Addiction counselors have the lowest projected adequacy at 30%, with a shortage of 77,050 FTE. Psychologists (48%) and adult psychiatrists (50%) are also projected to meet only about half of demand.
- Mental health counselors face a projected shortage of 99,780 FTE, and psychologists 99,840 FTE, the largest absolute gaps among the occupations HRSA lists.
- Psychiatric nurse practitioners are the main exception under status quo assumptions, with a projected surplus of 2,940 FTE and adequacy of 108%. Under HRSA's elevated-need scenario, that group also turns into a shortage.
Rural and Urban Gaps in Behavioral Health Providers
Shortage area totals mix rural and urban places. Separate county research summarized by HRSA shows how often rural counties have no local behavioral health provider at all.
| Rurality | Designations | Share of designations | People in designated areas | Practitioners needed |
|---|---|---|---|---|
| Rural | 4,311 | 60.49% | 30,046,129 | 1,812 |
| Non-rural | 2,079 | 29.17% | 37,984,931 | 2,166 |
| Partially rural | 717 | 10.06% | 86,296,216 | 3,800 |
| Unknown | 20 | 0.28% | 230,380 | 18 |
Source: Health Resources and Services Administration, Designated HPSA Quarterly Summary, fourth quarter of fiscal year 2026, as of September 30, 2026.
| Profession | Rural counties | Urban counties |
|---|---|---|
| Psychiatric mental health nurse practitioner | 69% | 31% |
| Psychologist | 45% | 16% |
| Social worker | 22% | 5% |
| Counselor | 18% | 5% |
Source: Andrilla et al., WWAMI Rural Health Research Center, as reported in HRSA, State of the Behavioral Health Workforce, 2025, December 2025.
Source: Andrilla et al., WWAMI Rural Health Research Center, as reported in HRSA, State of the Behavioral Health Workforce, 2025, December 2025.
Key Findings
- Rural areas hold 60.49% of mental health HPSA designations, but partially rural designations cover 86,296,216 people, the largest population block, because they span large mixed areas.
- In 2021, 69% of rural counties had no psychiatric mental health nurse practitioner and 45% had no psychologist, compared with 31% and 16% of urban counties.
- Non-rural HPSAs still need 2,166 practitioners to be removed, more than rural HPSAs at 1,812, because urban shortage areas serve denser populations.
Mental Health Shortage Areas by State
To compare states of different sizes, we divided the people counted in each state's mental health HPSAs by the state's 2025 population. Because designations can overlap, a state share can exceed 100%.
| State | Share of residents in HPSAs | People in HPSAs | Designations | Share of need met | Practitioners needed | Needed per 100,000 residents |
|---|---|---|---|---|---|---|
| Montana | 115.2% | 1,318,372 | 115 | 40.9% | 55 | 4.8 |
| South Carolina | 96.4% | 5,371,248 | 101 | 32.7% | 233 | 4.2 |
| Wyoming | 96.4% | 567,575 | 26 | 30.6% | 23 | 3.9 |
| Indiana | 93.2% | 6,500,041 | 117 | 37.9% | 251 | 3.6 |
| Alaska | 85.1% | 627,057 | 343 | 27.8% | 29 | 3.9 |
| Utah | 84.4% | 2,986,377 | 63 | 48.0% | 97 | 2.7 |
| Nevada | 82.7% | 2,715,680 | 66 | 21.7% | 185 | 5.6 |
| Mississippi | 78.3% | 2,312,386 | 87 | 33.3% | 107 | 3.6 |
| New Mexico | 76.1% | 1,617,847 | 100 | 25.7% | 83 | 3.9 |
| Washington | 70.4% | 5,635,742 | 244 | 21.1% | 249 | 3.1 |
| South Dakota | 70.4% | 657,991 | 65 | 18.7% | 36 | 3.8 |
| Illinois | 68.0% | 8,646,794 | 245 | 21.0% | 395 | 3.1 |
| Colorado | 67.4% | 4,054,296 | 85 | 40.4% | 137 | 2.3 |
| Alabama | 67.2% | 3,491,919 | 72 | 23.2% | 227 | 4.4 |
| Idaho | 63.2% | 1,282,788 | 65 | 20.1% | 56 | 2.8 |
| Oklahoma | 63.2% | 2,604,390 | 139 | 24.0% | 148 | 3.6 |
| Louisiana | 62.7% | 2,893,539 | 179 | 27.7% | 139 | 3.0 |
| Kentucky | 60.3% | 2,778,040 | 228 | 19.7% | 151 | 3.3 |
| Iowa | 58.6% | 1,899,150 | 174 | 20.1% | 82 | 2.5 |
| North Dakota | 58.1% | 464,452 | 69 | 37.4% | 16 | 2.0 |
| Arizona | 53.6% | 4,088,063 | 282 | 15.7% | 224 | 2.9 |
| Nebraska | 53.0% | 1,069,236 | 91 | 44.8% | 30 | 1.5 |
| Florida | 52.6% | 12,331,976 | 241 | 21.8% | 710 | 3.0 |
| Connecticut | 52.4% | 1,932,543 | 55 | 17.2% | 126 | 3.4 |
| Delaware | 50.8% | 537,966 | 16 | 6.6% | 61 | 5.8 |
| Georgia | 50.3% | 5,680,979 | 93 | 46.1% | 194 | 1.7 |
| Minnesota | 46.5% | 2,709,724 | 150 | 24.3% | 123 | 2.1 |
| Michigan | 46.0% | 4,663,345 | 276 | 37.3% | 195 | 1.9 |
| Maryland | 46.0% | 2,882,446 | 69 | 19.8% | 150 | 2.4 |
| West Virginia | 45.9% | 810,123 | 124 | 5.7% | 94 | 5.3 |
| Ohio | 45.7% | 5,432,847 | 138 | 34.3% | 240 | 2.0 |
| Texas | 44.4% | 14,065,653 | 414 | 31.9% | 631 | 2.0 |
| Missouri | 43.3% | 2,713,118 | 265 | 21.4% | 140 | 2.2 |
| Tennessee | 41.0% | 2,999,680 | 98 | 14.9% | 220 | 3.0 |
| Kansas | 40.2% | 1,196,031 | 118 | 19.9% | 52 | 1.7 |
| Oregon | 39.9% | 1,703,364 | 135 | 25.4% | 90 | 2.1 |
| Arkansas | 37.8% | 1,176,745 | 94 | 26.3% | 73 | 2.3 |
| Rhode Island | 37.0% | 411,900 | 14 | 45.4% | 15 | 1.3 |
| North Carolina | 36.7% | 4,104,845 | 224 | 11.8% | 253 | 2.3 |
| Hawaii | 35.2% | 504,844 | 33 | 32.2% | 23 | 1.6 |
| Maine | 33.2% | 470,030 | 82 | 11.4% | 21 | 1.5 |
| California | 31.2% | 12,270,229 | 643 | 21.9% | 673 | 1.7 |
| Wisconsin | 29.4% | 1,753,519 | 170 | 35.9% | 85 | 1.4 |
| Virginia | 25.4% | 2,253,193 | 133 | 18.0% | 150 | 1.7 |
| New York | 20.2% | 4,047,428 | 213 | 14.4% | 256 | 1.3 |
| District of Columbia | 18.2% | 126,214 | 10 | 0.0% | 8 | 1.2 |
| New Hampshire | 10.9% | 153,649 | 22 | 48.1% | 4 | 0.3 |
| New Jersey | 8.1% | 776,426 | 43 | 50.5% | 37 | 0.4 |
| Pennsylvania | 7.8% | 1,012,322 | 130 | 34.3% | 67 | 0.5 |
| Massachusetts | 7.7% | 553,097 | 56 | 26.5% | 30 | 0.4 |
| Vermont | 0.0% | 0 | 12 | N/A | 0 | 0.0 |
Source: Healthcare Industry Reviews analysis of HRSA mental health HPSA designations and US Census Bureau 2025 population estimates, November 2026.
Source: Healthcare Industry Reviews analysis of HRSA mental health HPSA designations and US Census Bureau 2025 population estimates, November 2026.
Key Findings
- Montana (115.2%), South Carolina (96.4%), Wyoming (96.4%), Indiana (93.2%), and Alaska (85.1%) had the highest shares of residents counted in mental health HPSAs. Overlaps across designations push some shares above 100%.
- Vermont (0.0%), Massachusetts (7.7%), Pennsylvania (7.8%), New Jersey (8.1%), and New Hampshire (10.9%) had the lowest shares. A low share can reflect how a state applies for designations as well as how many providers it has.
- Relative to population, Delaware (5.8 per 100,000 residents), Nevada (5.6) and West Virginia (5.3) need the most additional practitioners. Florida needs the most in total at 710, followed by California at 673 and Texas at 631.
Mental Health Practitioners Needed by State
HRSA also reports how many additional practitioners would remove every mental health HPSA in a state. That count is a direct measure of the gap, separate from how large a share of residents lives in a shortage area.
| State | Practitioners needed | Designations | People in HPSAs | Needed per 100,000 residents |
|---|---|---|---|---|
| Florida | 710 | 241 | 12,331,976 | 3.0 |
| California | 673 | 643 | 12,270,229 | 1.7 |
| Texas | 631 | 414 | 14,065,653 | 2.0 |
| Illinois | 395 | 245 | 8,646,794 | 3.1 |
| New York | 256 | 213 | 4,047,428 | 1.3 |
| North Carolina | 253 | 224 | 4,104,845 | 2.3 |
| Indiana | 251 | 117 | 6,500,041 | 3.6 |
| Washington | 249 | 244 | 5,635,742 | 3.1 |
| Ohio | 240 | 138 | 5,432,847 | 2.0 |
| South Carolina | 233 | 101 | 5,371,248 | 4.2 |
| Alabama | 227 | 72 | 3,491,919 | 4.4 |
| Arizona | 224 | 282 | 4,088,063 | 2.9 |
| Tennessee | 220 | 98 | 2,999,680 | 3.0 |
| Michigan | 195 | 276 | 4,663,345 | 1.9 |
| Georgia | 194 | 93 | 5,680,979 | 1.7 |
Source: Healthcare Industry Reviews analysis of HRSA mental health HPSA designations and US Census Bureau 2025 population estimates, November 2026.
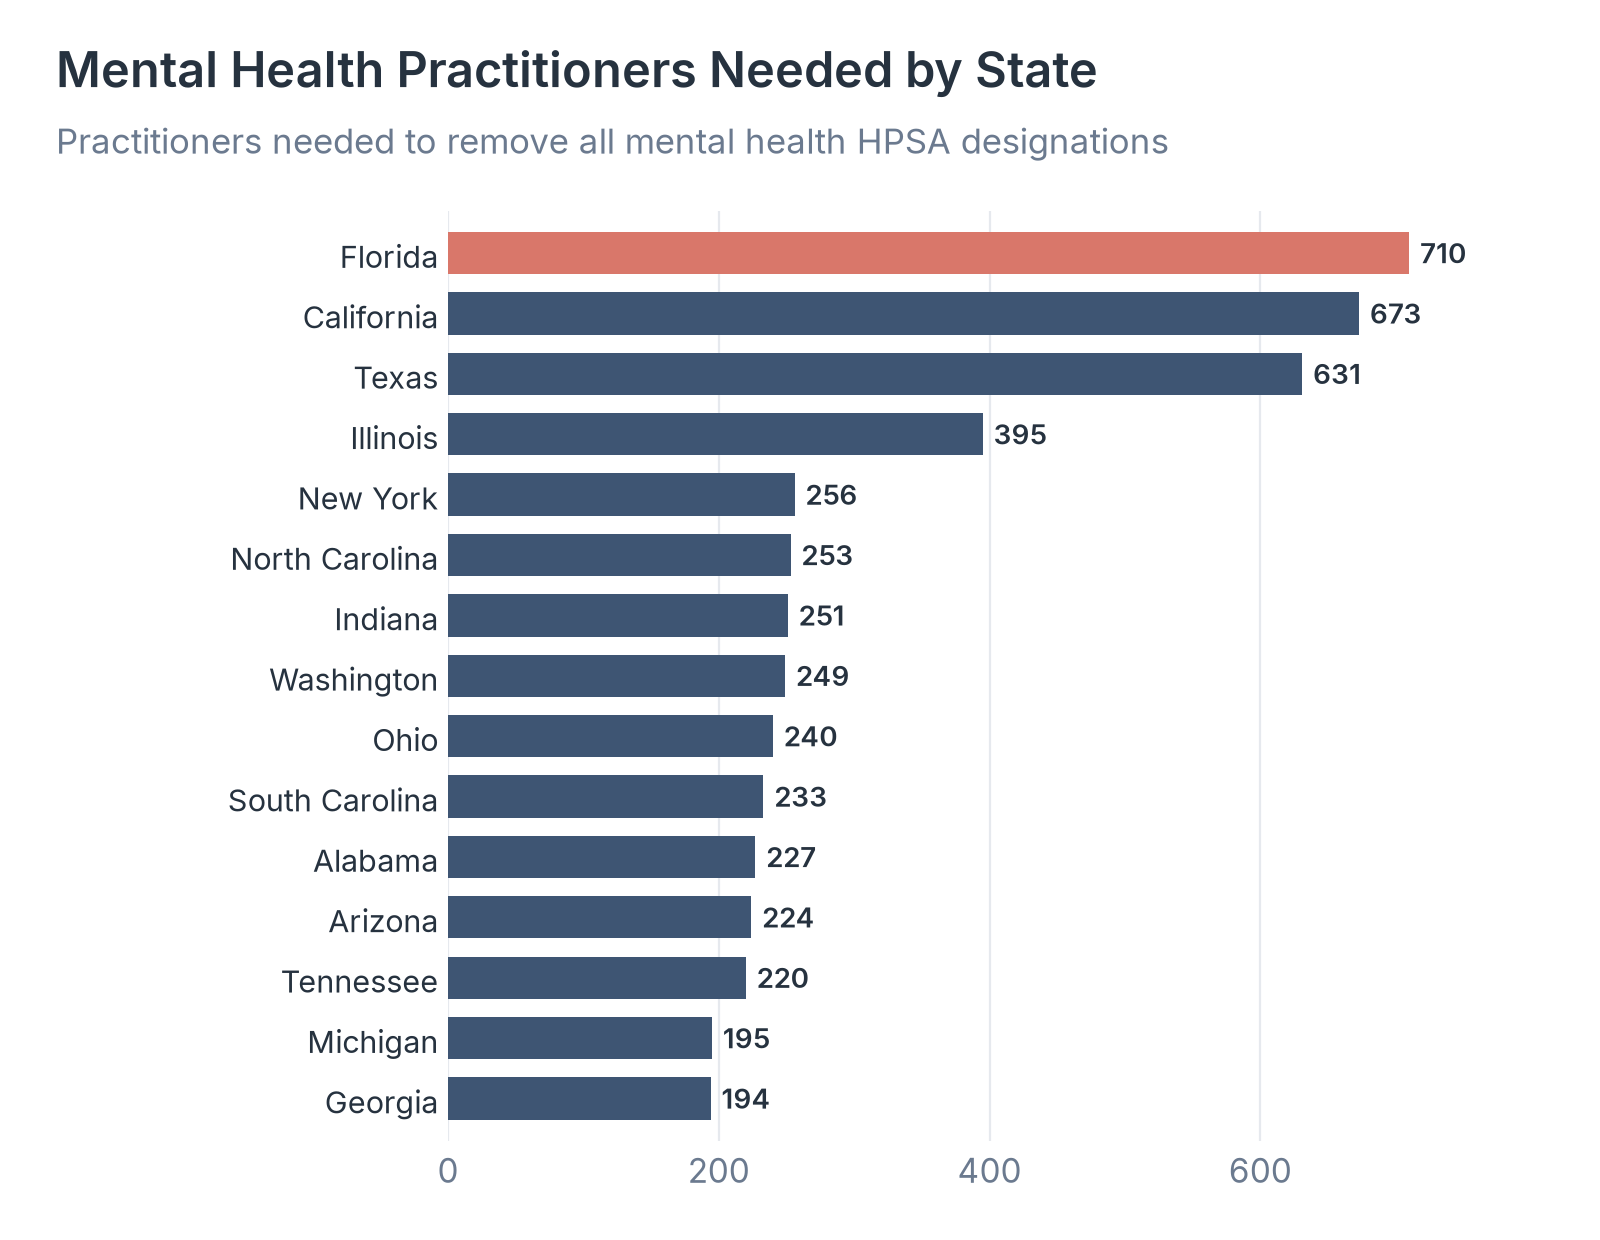
Source: Healthcare Industry Reviews analysis of HRSA mental health HPSA designations and US Census Bureau 2025 population estimates, November 2026.
Key Findings
- Florida needs 710 practitioners, California 673, and Texas 631, the three largest absolute gaps. Together they account for about one quarter of the national total of 7,796.
- Illinois (395), New York (256), Indiana (251), North Carolina (253), and Washington (249) round out the next tier of states with the largest practitioner needs.
- States with high resident shares are not always the ones that need the most practitioners in total. Montana ranks first by share but needs only 55 practitioners because its population is small.
What Mental Health Provider Shortage Statistics Show for 2026
About 155 million people live in designated mental health shortage areas, and only about one in four of the practitioners those areas need is in place. HRSA's projections say adult psychiatry, psychology and counseling will still meet only about half of demand in 2038 if current patterns hold, while rural counties remain far more likely to have no local behavioral health clinician.
So if you plan mental health staffing, clinic sites, or telehealth coverage, use HPSA counts and state shares for where the shortage is today, the practitioner-needed figures for the size of each state's gap, and the 2038 occupation projections for which roles will stay hardest to fill.
Data Collection and Methodology
Current shortage figures come from HRSA's Designated HPSA Quarterly Summary for the fourth quarter of fiscal year 2026, with data as of September 30, 2026, which we opened on November 5, 2026. Designation counts include HPSAs proposed for withdrawal. For each state and the District of Columbia, we divided the population of designated mental health HPSAs by the Census Bureau's Vintage 2025 resident population estimate and divided practitioners needed by population per 100,000 residents. HPSA population counts can include people in overlapping designations, so state shares are approximate and can exceed 100%.
Projection figures and current supply counts come from HRSA's State of the Behavioral Health Workforce brief (December 2025), which uses the Health Workforce Simulation Model and reports full-time equivalents of 40 hours a week. Adequacy is projected supply divided by projected demand. Rural and urban county shares without providers are from Andrilla et al. (2022), as reported in that brief. Adult mental illness and treatment figures are SAMHSA 2024 National Survey on Drug Use and Health results as cited by HRSA.
We calculated products, differences and ratios from the published values.
Sources
- Healthcare Industry Reviews, Mental Health Provider Shortage Study: analysis of HRSA mental health HPSA designations as of September 30, 2026 for all 50 states and the District of Columbia, with US Census Bureau 2025 population estimates and HRSA behavioral health workforce projections, conducted November 2026.
- Health Resources and Services Administration. Designated Health Professional Shortage Areas Statistics: Designated HPSA Quarterly Summary. Fourth quarter of fiscal year 2026, as of September 30, 2026.
- Health Resources and Services Administration, National Center for Health Workforce Analysis. State of the Behavioral Health Workforce, 2025. December 2025.
- Health Resources and Services Administration. Workforce Projections Dashboard.
- US Census Bureau. Annual Estimates of the Resident Population for the United States, Regions, States, District of Columbia, and Puerto Rico (Vintage 2025).