Nursing Home Staffing Statistics: 2026 Report
Published
Our analysts worked through 12,023,011 daily staffing records that US nursing homes filed with the Centers for Medicare & Medicaid Services (CMS) for the second quarter of every year from 2018 to 2026, covering more than 14,000 homes each year. Together the records show how many nurse hours each resident receives, how much of that work is done by agency staff, and how staffing differs from state to state as of Q4 2026.
Key Findings
- US nursing homes provided 3.79 nurse staff hours per resident day in Q2 2026, up from 3.63 in Q2 2022 and close to the 3.77 recorded in Q2 2018.
- 29.8% of nursing homes reached 4.1 total nurse hours per resident day in Q2 2026, and 17.0% reached both 4.1 total hours and 0.75 registered nurse hours.
- Agency and contract staff worked 5.4% of nurse hours in Q2 2026, down from a peak of 10.3% in Q2 2022.
- Alaska had the highest statewide level in Q2 2026 at 5.79 hours per resident day, and Illinois had the lowest at 3.31.
- Total nursing staff turnover averaged 45.3% across US nursing homes in the October 2026 Care Compare data, and registered nurse turnover averaged 42.5%.
Most of the hands-on care in a nursing home comes from nurse aides, who help residents eat, bathe, dress, and move, with licensed practical nurses (LPNs) and registered nurses (RNs) giving medications and handling clinical decisions. Families comparing homes, state inspectors, and companies that sell staffing and scheduling software all look at the same measure to judge whether a home has enough of those people on shift: nurse staff hours per resident day, the total hours worked by nurses and aides divided by the number of residents. The COVID-19 pandemic pushed many aides and nurses out of the field, and homes filled gaps with agency staff at higher cost. A federal rule finalized in 2024 would have required at least 3.48 hours per resident day, but Congress blocked it and CMS repealed it in December 2025, according to the Federal Register. That leaves staffing levels to states and to each home, so we looked at where they stand now.
Our analysts used the Payroll Based Journal (PBJ) daily nurse staffing files, which every Medicare and Medicaid certified nursing home submits to CMS from its payroll and timekeeping records. We took the second quarter of each year from 2018 to 2026, added up hours for RNs (including directors of nursing and RN administrators), LPNs, and nurse aides (including aides in training and medication aides), and divided by resident days. We also split hours between employees and contract staff and compared each state. For turnover and weekend staffing, we used the state and national averages CMS published on Care Compare in October 2026.
In the following sections, we compare national staffing hours from 2018 to 2026, the share of homes that meet common staffing benchmarks, the use of contract staff, staffing in every state, and nursing staff turnover.
How Many Nurse Staff Hours Nursing Home Residents Receive
The national hours-per-resident-day figure is the number most often quoted in coverage of nursing home staffing, and the yearly series shows how it moved through the pandemic and after. Splitting it by type of staff shows whether changes came from aides, LPNs, or RNs.
| Quarter | Total nurse staff | RNs | LPNs | Nurse aides | Nursing homes reporting | Residents per day |
|---|---|---|---|---|---|---|
| Q2 2018 | 3.77 | 0.61 | 0.88 | 2.28 | 14,662 | 1,267,984 |
| Q2 2019 | 3.75 | 0.62 | 0.87 | 2.27 | 15,020 | 1,296,552 |
| Q2 2020 | 3.89 | 0.67 | 0.92 | 2.31 | 14,763 | 1,155,436 |
| Q2 2021 | 3.75 | 0.66 | 0.90 | 2.19 | 14,812 | 1,106,502 |
| Q2 2022 | 3.63 | 0.60 | 0.87 | 2.16 | 14,694 | 1,149,561 |
| Q2 2023 | 3.66 | 0.59 | 0.88 | 2.20 | 14,595 | 1,187,769 |
| Q2 2024 | 3.71 | 0.60 | 0.87 | 2.24 | 14,564 | 1,214,881 |
| Q2 2025 | 3.78 | 0.62 | 0.87 | 2.29 | 14,537 | 1,231,503 |
| Q2 2026 | 3.79 | 0.63 | 0.86 | 2.29 | 14,474 | 1,247,182 |
Source: Centers for Medicare & Medicaid Services, Payroll Based Journal Daily Nurse Staffing data files, Q2 2018 to Q2 2026.
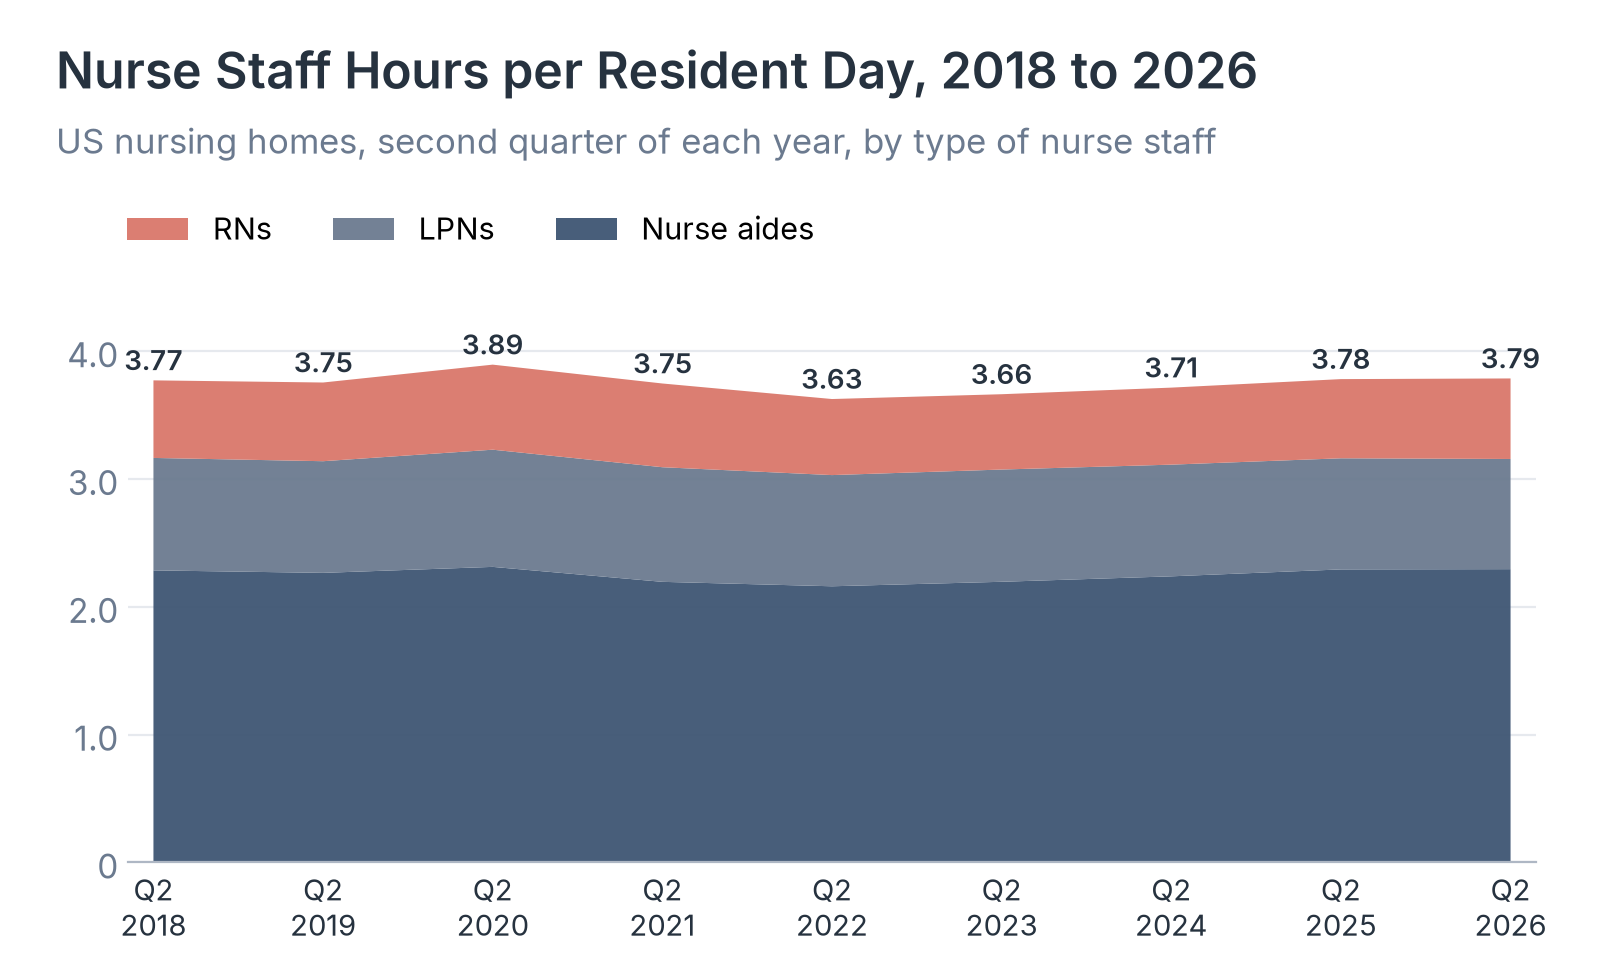
Source: Healthcare Industry Reviews analysis of the Centers for Medicare & Medicaid Services Payroll Based Journal Daily Nurse Staffing files, November 2026.
Key Findings
- Staffing peaked at 3.89 hours per resident day in Q2 2020, when the number of residents fell to 1,155,436 a day. Hours per resident rose that quarter mainly because there were fewer residents, and the measure fell back to 3.63 by Q2 2022 as staff left.
- Nurse aides provide most of the care time: 2.29 of the 3.79 hours in Q2 2026, compared with 0.86 hours from LPNs and 0.63 hours from RNs. RN hours per resident day are now 0.02 hours above their Q2 2018 level, while aide hours are 0.01 hours above it.
- The number of residents per day has grown every year since 2021 and reached 1,247,182 in Q2 2026, while the number of homes reporting fell to 14,474. Homes have added staff hours at about the same pace as residents, so the next few quarters will show whether that holds as demand from an aging population keeps rising.
How Many Nursing Homes Meet Common Staffing Benchmarks
A national average can hide a wide spread between homes. Researchers and advocates often compare each home with 4.1 total nurse hours and 0.75 RN hours per resident day, the two levels from a 2001 federal study that the Long Term Care Community Coalition still uses as benchmarks, and with the 3.48-hour floor from the repealed 2024 federal rule.
| Quarter | At least 3.48 total hours | At least 4.1 total hours | At least 0.75 RN hours | Both 4.1 total and 0.75 RN | Median home |
|---|---|---|---|---|---|
| Q2 2018 | 65.4% | 30.1% | 30.0% | 17.2% | 3.72 |
| Q2 2019 | 63.7% | 29.9% | 30.7% | 17.7% | 3.71 |
| Q2 2020 | 70.2% | 37.2% | 36.3% | 23.4% | 3.85 |
| Q2 2021 | 63.5% | 30.9% | 35.0% | 19.6% | 3.72 |
| Q2 2022 | 57.8% | 26.5% | 29.3% | 16.1% | 3.62 |
| Q2 2023 | 59.2% | 26.8% | 28.2% | 15.5% | 3.62 |
| Q2 2024 | 62.8% | 27.4% | 28.9% | 16.0% | 3.67 |
| Q2 2025 | 66.7% | 30.1% | 30.4% | 17.2% | 3.72 |
| Q2 2026 | 67.2% | 29.8% | 31.1% | 17.0% | 3.72 |
Source: Healthcare Industry Reviews analysis of the Centers for Medicare & Medicaid Services Payroll Based Journal Daily Nurse Staffing files, November 2026.
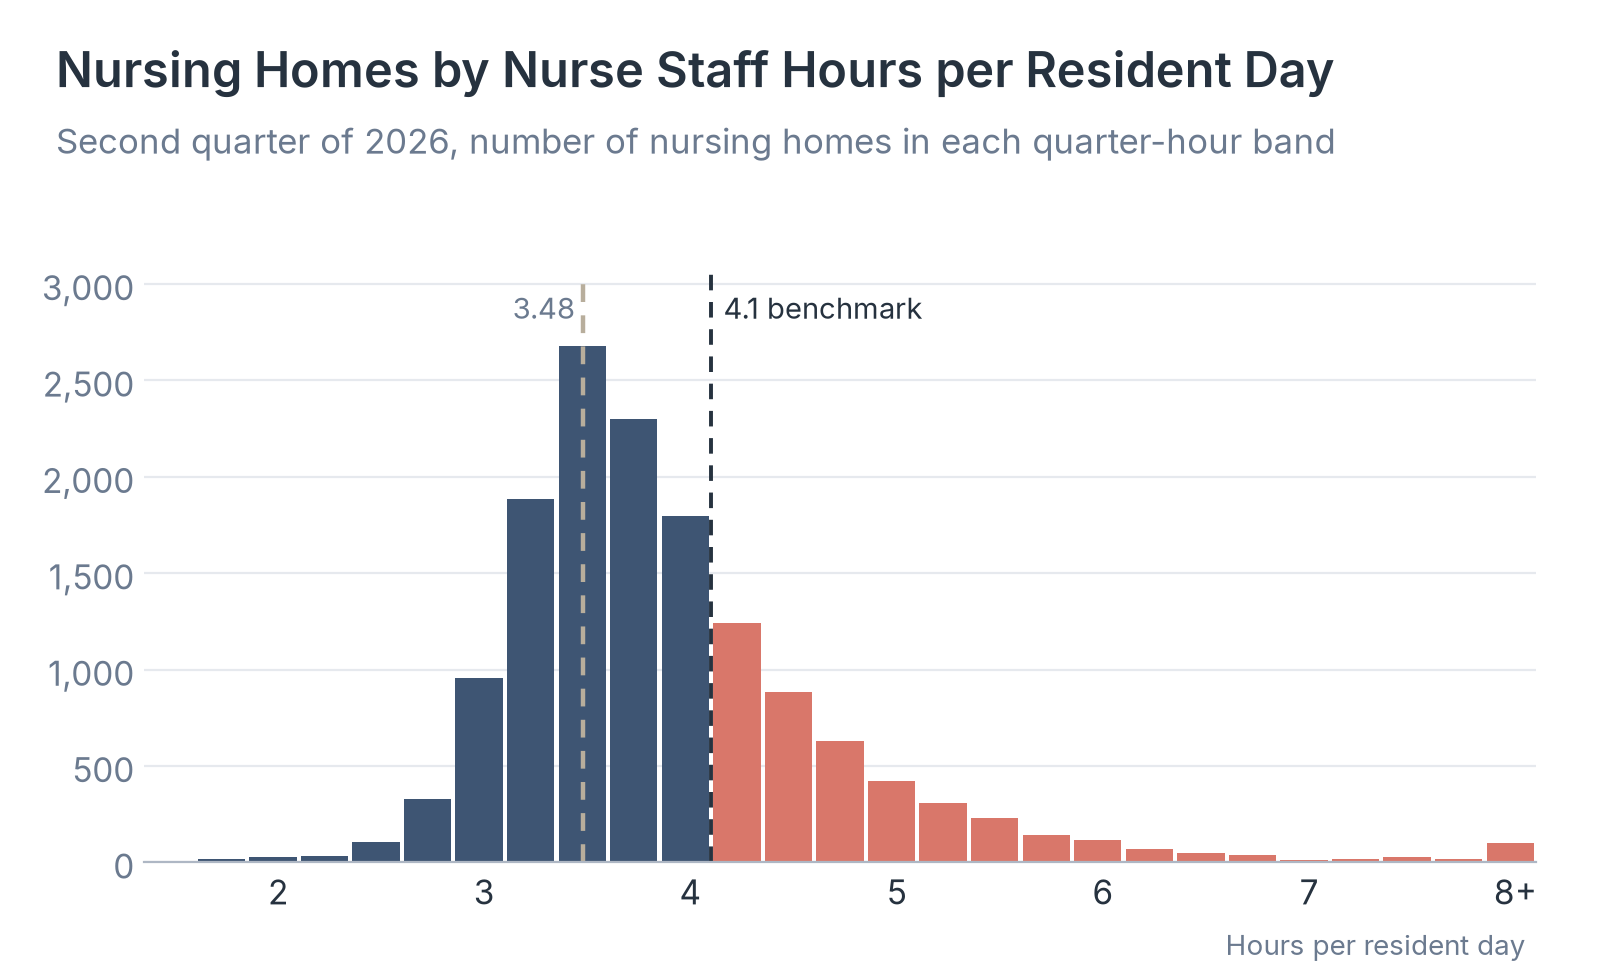
Source: Healthcare Industry Reviews analysis of the Centers for Medicare & Medicaid Services Payroll Based Journal Daily Nurse Staffing files, November 2026.
Key Findings
- In Q2 2026, 32.8% of nursing homes staffed below 3.48 hours per resident day, the floor in the repealed 2024 rule. The median home provided 3.72 hours, below the national average of 3.79, because a smaller group of homes with high staffing pulls the average up.
- The share of homes reaching 4.1 total hours was 29.8% in Q2 2026, close to the 30.1% of Q2 2018. The share reaching 0.75 RN hours rose from 30.0% to 31.1% over the same period.
- Only 17.0% of homes reached both the total and the RN benchmark in Q2 2026. With no federal minimum in force, any rise in that share over the next few years will depend on state rules and on whether homes can hire RNs.
How Much Nursing Homes Rely on Agency and Contract Staff
When homes cannot hire enough of their own staff, they bring in nurses and aides from staffing agencies, usually at higher hourly cost. The PBJ files separate those contract hours from employee hours, which lets us track how far homes leaned on agencies during and after the pandemic.
| Quarter | All nurse staff | RNs | LPNs | Nurse aides | Homes using any contract nurse staff |
|---|---|---|---|---|---|
| Q2 2018 | 2.7% | 2.4% | 3.2% | 2.6% | 43.8% |
| Q2 2019 | 3.2% | 2.7% | 3.6% | 3.2% | 45.9% |
| Q2 2020 | 3.6% | 3.2% | 3.9% | 3.6% | 46.4% |
| Q2 2021 | 5.7% | 4.2% | 6.4% | 5.9% | 58.3% |
| Q2 2022 | 10.3% | 7.4% | 11.7% | 10.6% | 68.7% |
| Q2 2023 | 9.7% | 7.7% | 11.1% | 9.6% | 65.4% |
| Q2 2024 | 7.0% | 6.3% | 8.5% | 6.7% | 60.5% |
| Q2 2025 | 6.0% | 5.8% | 7.4% | 5.5% | 58.5% |
| Q2 2026 | 5.4% | 5.4% | 6.5% | 4.9% | 56.3% |
Source: Centers for Medicare & Medicaid Services, Payroll Based Journal Daily Nurse Staffing data files, Q2 2018 to Q2 2026.
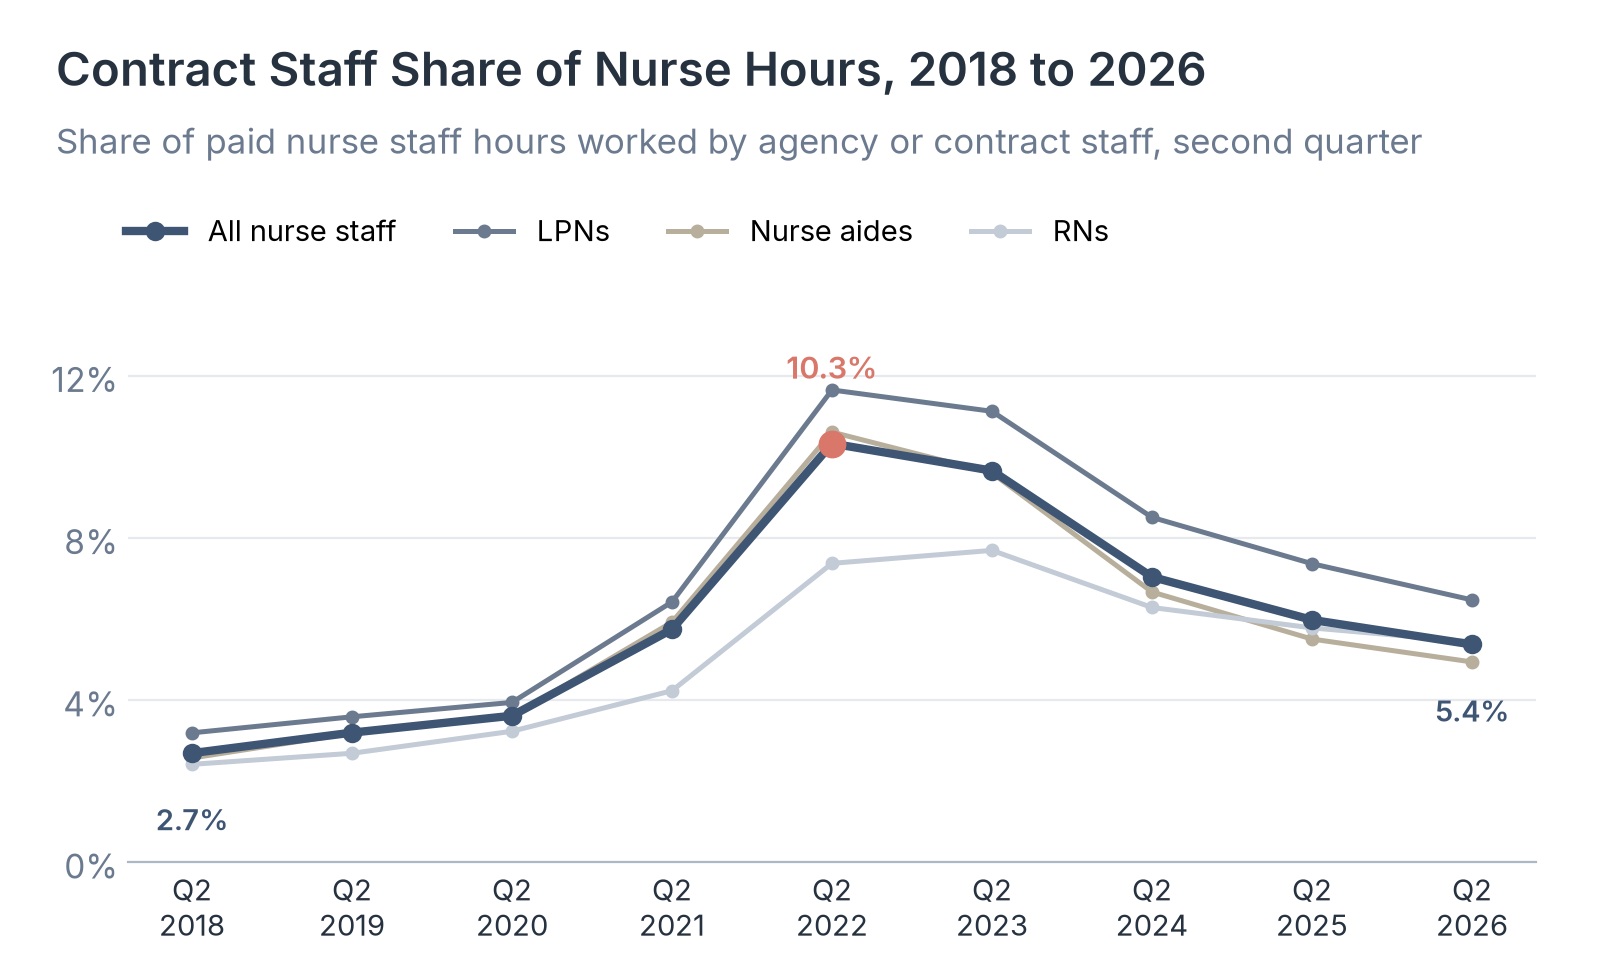
Source: Healthcare Industry Reviews analysis of the Centers for Medicare & Medicaid Services Payroll Based Journal Daily Nurse Staffing files, November 2026.
Key Findings
- Contract staff worked 10.3% of nurse hours in Q2 2022, almost four times the 2.7% of Q2 2018. The share has fallen every year since and was 5.4% in Q2 2026, still double the pre-pandemic level.
- LPNs have the highest contract share of any group, at 6.5% in Q2 2026. The RN contract share was the slowest to fall after the peak and reached 7.7% in Q2 2023, a year after the share for all staff had started to drop.
- 56.3% of homes used at least some contract nurse staff in Q2 2026, down from 68.7% in Q2 2022 but above the 43.8% of Q2 2018. For staffing agencies, the share of nursing home hours they fill has fallen by about half from its peak, while more homes than before the pandemic still buy some agency hours.
Nursing Home Staffing Levels by State
Staffing differs a great deal between states, partly because many states set their own minimum hours and partly because labor markets and Medicaid payment rates differ. The table below ranks every state and the District of Columbia by total nurse staff hours per resident day in Q2 2026.
| State | Total nurse staff hours | RN hours | Contract share of hours | Homes at 4.1 hours or more | Nursing homes |
|---|---|---|---|---|---|
| Alaska | 5.79 | 1.70 | 10.3% | 100.0% | 15 |
| Oregon | 5.02 | 0.68 | 5.6% | 99.1% | 115 |
| Hawaii | 4.79 | 1.64 | 6.6% | 78.6% | 42 |
| North Dakota | 4.62 | 0.93 | 12.1% | 76.4% | 72 |
| District of Columbia | 4.61 | 1.35 | 4.6% | 81.2% | 16 |
| Maine | 4.39 | 1.06 | 7.6% | 66.7% | 78 |
| California | 4.39 | 0.60 | 2.2% | 66.0% | 1,146 |
| Vermont | 4.28 | 0.83 | 22.0% | 57.6% | 33 |
| Washington | 4.26 | 0.94 | 3.4% | 52.1% | 188 |
| Wisconsin | 4.22 | 0.95 | 8.0% | 47.8% | 319 |
| Minnesota | 4.22 | 1.06 | 5.0% | 56.1% | 335 |
| Delaware | 4.11 | 0.80 | 5.5% | 35.7% | 42 |
| Nebraska | 4.11 | 0.66 | 6.8% | 40.2% | 174 |
| Mississippi | 4.11 | 0.59 | 5.9% | 43.9% | 199 |
| Arkansas | 4.10 | 0.40 | 2.3% | 43.6% | 220 |
| Kansas | 4.06 | 0.67 | 5.1% | 43.4% | 289 |
| Michigan | 4.00 | 0.71 | 3.3% | 33.7% | 421 |
| Arizona | 3.96 | 0.65 | 3.0% | 34.5% | 139 |
| Utah | 3.92 | 1.11 | 2.8% | 30.9% | 97 |
| Alabama | 3.91 | 0.64 | 0.9% | 34.7% | 222 |
| Nevada | 3.89 | 0.86 | 2.0% | 42.2% | 64 |
| Kentucky | 3.89 | 0.72 | 3.4% | 26.2% | 263 |
| Iowa | 3.86 | 0.72 | 4.7% | 29.7% | 384 |
| Massachusetts | 3.86 | 0.62 | 4.6% | 24.9% | 341 |
| Idaho | 3.85 | 0.79 | 4.1% | 29.1% | 79 |
| South Dakota | 3.83 | 0.78 | 10.8% | 29.7% | 91 |
| Montana | 3.83 | 0.86 | 13.1% | 39.7% | 58 |
| Connecticut | 3.82 | 0.63 | 6.2% | 26.9% | 171 |
| Oklahoma | 3.80 | 0.32 | 2.6% | 27.3% | 274 |
| New Hampshire | 3.79 | 0.74 | 12.8% | 30.6% | 72 |
| Florida | 3.79 | 0.69 | 1.2% | 19.7% | 690 |
| Tennessee | 3.78 | 0.56 | 4.1% | 22.8% | 303 |
| Maryland | 3.78 | 0.77 | 7.9% | 23.9% | 213 |
| Rhode Island | 3.77 | 0.70 | 5.4% | 20.6% | 68 |
| Pennsylvania | 3.73 | 0.65 | 11.8% | 27.4% | 647 |
| New Jersey | 3.72 | 0.60 | 11.2% | 25.4% | 347 |
| Louisiana | 3.69 | 0.26 | 4.4% | 20.9% | 251 |
| Wyoming | 3.69 | 0.87 | 9.7% | 32.4% | 35 |
| North Carolina | 3.68 | 0.54 | 7.8% | 20.9% | 407 |
| Virginia | 3.68 | 0.58 | 6.0% | 23.2% | 289 |
| Indiana | 3.67 | 0.62 | 3.4% | 18.3% | 507 |
| Ohio | 3.67 | 0.61 | 4.9% | 19.9% | 920 |
| South Carolina | 3.64 | 0.52 | 7.9% | 25.3% | 186 |
| New York | 3.60 | 0.70 | 10.2% | 18.5% | 590 |
| West Virginia | 3.58 | 0.69 | 3.6% | 18.0% | 122 |
| New Mexico | 3.57 | 0.63 | 13.4% | 19.1% | 68 |
| Colorado | 3.56 | 0.76 | 5.7% | 23.1% | 208 |
| Georgia | 3.56 | 0.47 | 3.3% | 15.1% | 352 |
| Texas | 3.36 | 0.41 | 2.2% | 10.0% | 1,167 |
| Missouri | 3.32 | 0.40 | 3.7% | 13.6% | 482 |
| Illinois | 3.31 | 0.66 | 5.9% | 16.7% | 655 |
Source: Healthcare Industry Reviews analysis of the Centers for Medicare & Medicaid Services Payroll Based Journal Daily Nurse Staffing files, November 2026.
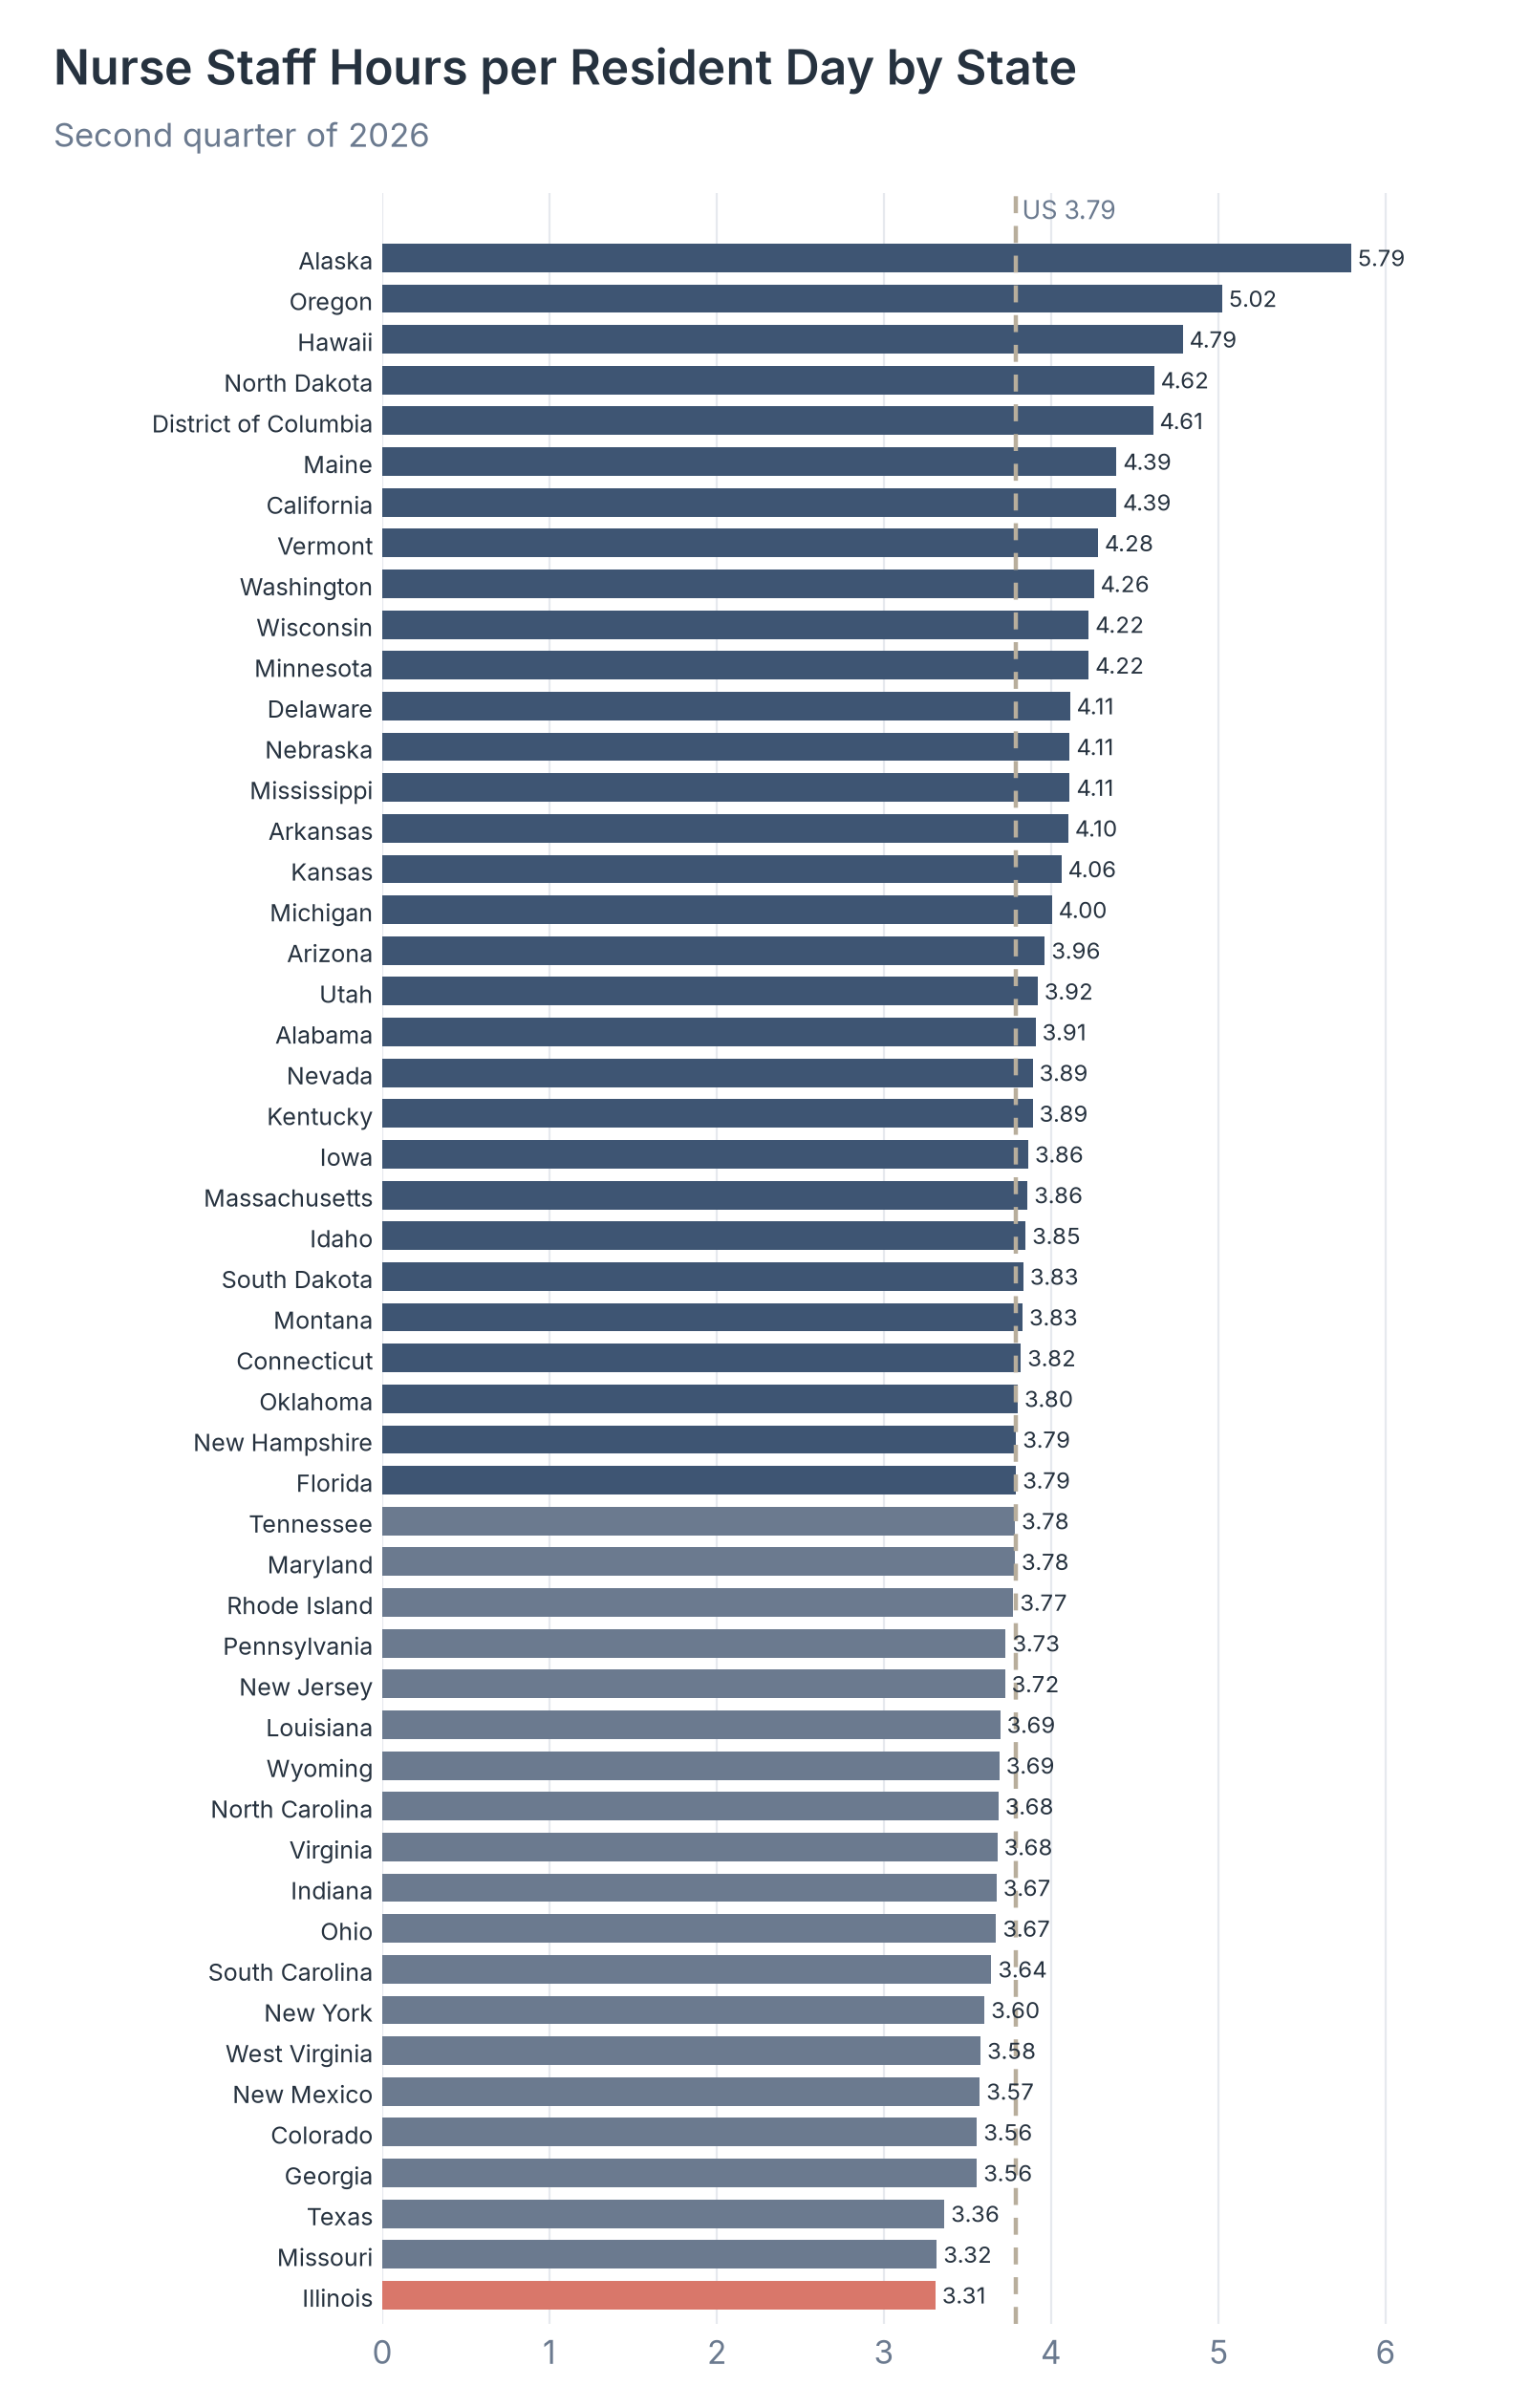
Source: Healthcare Industry Reviews analysis of the Centers for Medicare & Medicaid Services Payroll Based Journal Daily Nurse Staffing files, November 2026.
Key Findings
- Alaska (5.79 hours), Oregon (5.02), and Hawaii (4.79) had the highest statewide levels in Q2 2026. Illinois (3.31), Missouri (3.32), and Texas (3.36) had the lowest, and in Texas only 10.0% of homes reached 4.1 hours.
- RN time varied more than total time. Alaska homes averaged 1.70 RN hours per resident day and Hawaii homes 1.64, while Louisiana averaged 0.26 and Oklahoma 0.32.
- Vermont relied on contract staff for 22.0% of nurse hours, far above any other state, followed by New Mexico (13.4%) and Montana (13.1%). Alabama (0.9%) and Florida (1.2%) used the least.
Nursing Staff Turnover and Weekend Staffing
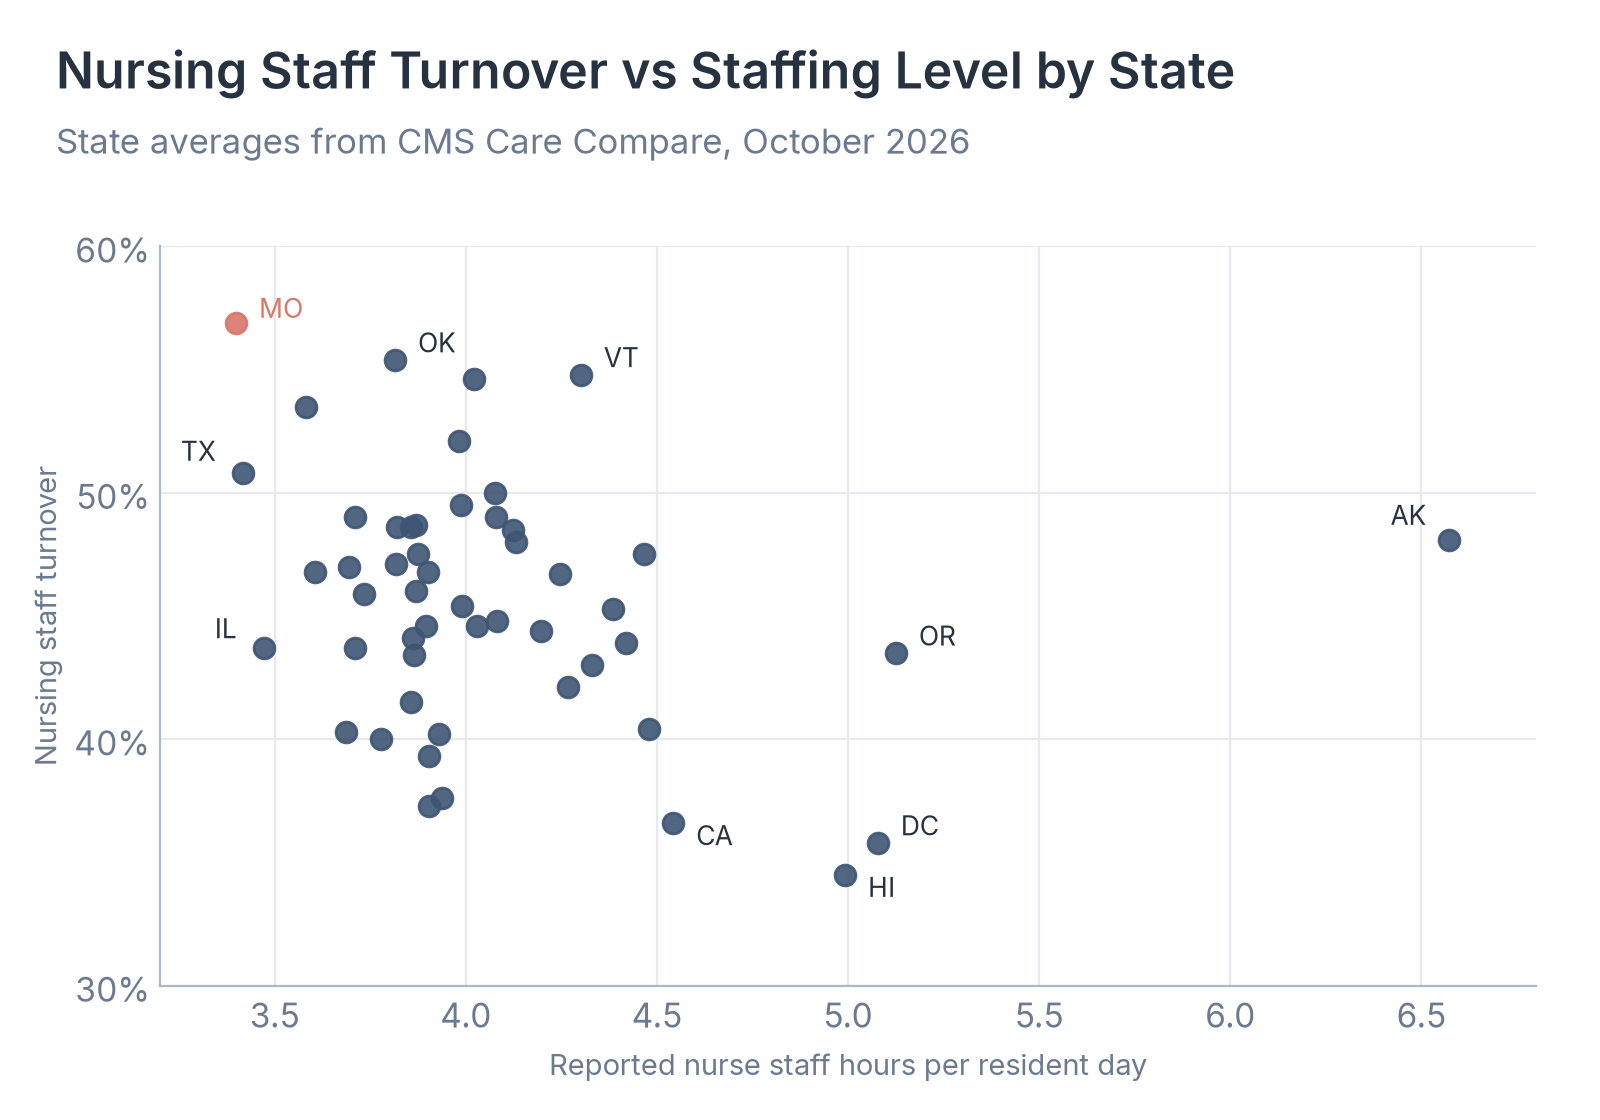
Hours per resident day say how much staff time a home pays for, but not how stable its team is or whether the hours hold up on weekends. CMS publishes both measures on Care Compare, and we compared them across states to see whether better-staffed states also keep their staff longer.
| Measure | US average |
|---|---|
| Total nurse staff hours per resident day | 3.90 |
| Weekend total nurse staff hours per resident day | 3.43 |
| RN hours per resident day | 0.69 |
| Weekend RN hours per resident day | 0.48 |
| Total nursing staff turnover | 45.3% |
| Registered nurse turnover | 42.5% |
| Administrators who left, average per home | 0.5 |
Source: Centers for Medicare & Medicaid Services, Nursing Home State and US Averages, Care Compare data released October 2026.
Source: Healthcare Industry Reviews analysis of the Centers for Medicare & Medicaid Services Nursing Home State and US Averages, October 2026.
Key Findings
- Weekend staffing averaged 3.43 hours per resident day, 12% below the 3.90-hour all-days average CMS reports, and weekend RN time averaged 0.48 hours against 0.69 hours for all days.
- Missouri had the highest nursing staff turnover at 56.9%, followed by Oklahoma (55.4%) and Vermont (54.8%). Hawaii (34.5%), the District of Columbia (35.8%), and California (36.6%) had the lowest.
- The 10 states with the most staff hours per resident averaged 41.9% turnover, compared with 47.8% in the 10 states with the fewest hours. The link is weak across all states, so a home's own turnover figure on Care Compare tells a family more than its state average.
What Nursing Home Staffing Statistics Show for 2026
For residents, the numbers mean that a typical home provides a little under four hours of nurse and aide time per person each day, most of it from aides, and that about one in three homes falls below the 3.48-hour floor that was briefly federal policy. Homes have recovered the staffing they lost in 2021 and 2022 and have cut their use of agency staff by about half, but nearly half of the nursing staff in a typical home still turns over in a year.
With the federal minimum repealed, the gap between states such as Oregon and Alaska and states such as Illinois and Texas is likely to stay wide unless states change their own rules. So if you compare nursing home staffing, use hours per resident day from the same quarter for every home or state, and check turnover and weekend hours alongside it.
Data Collection and Methodology
Staffing figures come from the CMS Payroll Based Journal (PBJ) Daily Nurse Staffing public use files for the second quarter (April to June) of each year from 2018 to 2026, 12,023,011 facility-day records in all, which we downloaded and analyzed on November 4, 2026. We used the second quarter because Q2 2026 is the most recent quarter CMS has released. Each record lists a nursing home's resident census and paid hours by job type for one day.
Total nurse staff hours include RNs (with directors of nursing and RN administrative staff), LPNs (with LPN administrative staff), certified nurse aides, aides in training, and medication aides. National and state hours per resident day are total hours divided by total resident days. Contract share is contract hours divided by all hours. For benchmark shares and the distribution chart we computed each home's quarterly hours per resident day and left out homes with no residents or with values below 1.5 or above 12 hours, which are most likely reporting errors (30 homes in Q2 2026). The last bar of the distribution chart includes all homes at 7.85 hours or more. Other published PBJ analyses, such as the 3.75 hours LTCCC reported for Q1 2026, cover different quarters and can group staff differently, so their figures differ slightly from ours.
Turnover and weekend figures are CMS Care Compare state and national averages released October 1, 2026, which use CMS's own reporting periods and calculations and so differ slightly from our PBJ figures. State tables cover the 50 states and the District of Columbia. The 4.1 total and 0.75 RN benchmarks come from a 2001 federal staffing study as cited by LTCCC; the 3.48-hour level comes from the 2024 federal rule repealed in December 2025. We calculated products, differences, and ratios from the published values.
Sources
- Healthcare Industry Reviews, Nursing Home Staffing Study: analysis of 12,023,011 daily staffing records from the CMS Payroll Based Journal for Q2 2018 to Q2 2026, by staff type, contract use, benchmark, and state, conducted November 2026.
- Centers for Medicare & Medicaid Services. Payroll Based Journal Daily Nurse Staffing. Data files, Q2 2018 to Q2 2026. Q2 2026 data file (CSV).
- Centers for Medicare & Medicaid Services. Nursing Home State and US Averages. Provider Data Catalog, October 2026.
- Long Term Care Community Coalition. LTCCC Alert: Nearly 9 in 10 U.S. Nursing Homes Understaffed (Q1 2026). August 31, 2026.
- Centers for Medicare & Medicaid Services. Medicare and Medicaid Programs; Repeal of Minimum Staffing Standards for Long-Term Care Facilities. Federal Register, December 3, 2025.