Organ Transplant Waiting List Statistics: 2026 Report
Published
Our analysts reviewed OPTN waiting list counts as of July 30, 2026, five years of national candidate, transplant, and donor records from HRSA covering 2021 through 2025, and removal and outcome data from the OPTN/SRTR 2024 Annual Data Report to show how large the US organ transplant waiting list is, who is on it, and how many people die or become too sick while waiting, as of Q4 2026.
Key Findings
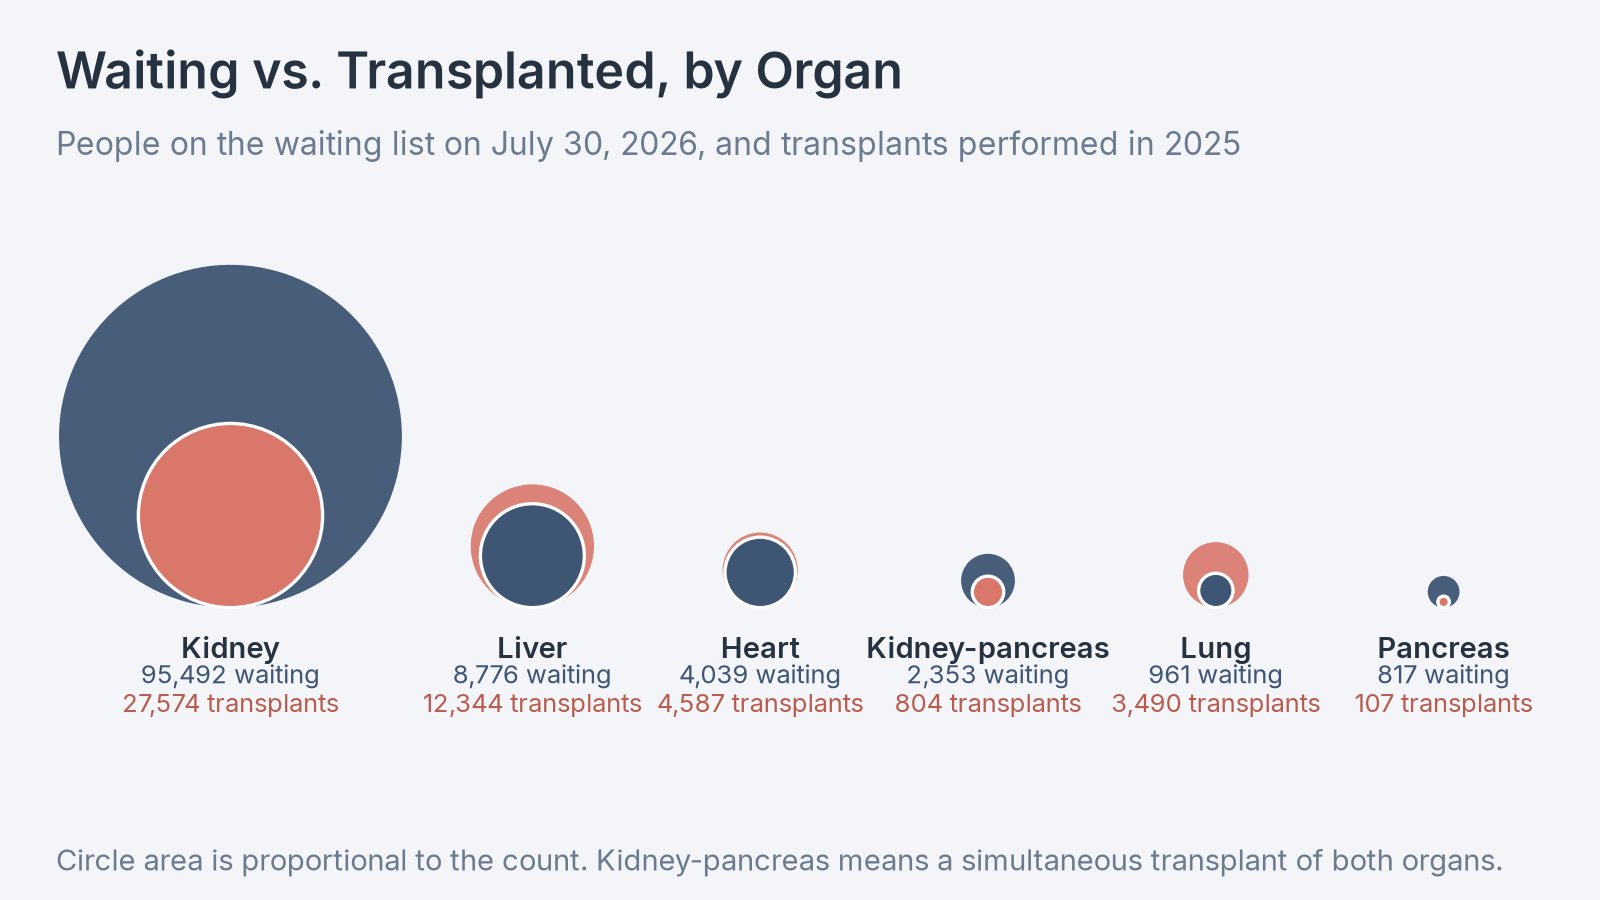
- 109,817 people were on the US organ transplant waiting list on July 30, 2026, and 95,492 of them were waiting for a kidney.
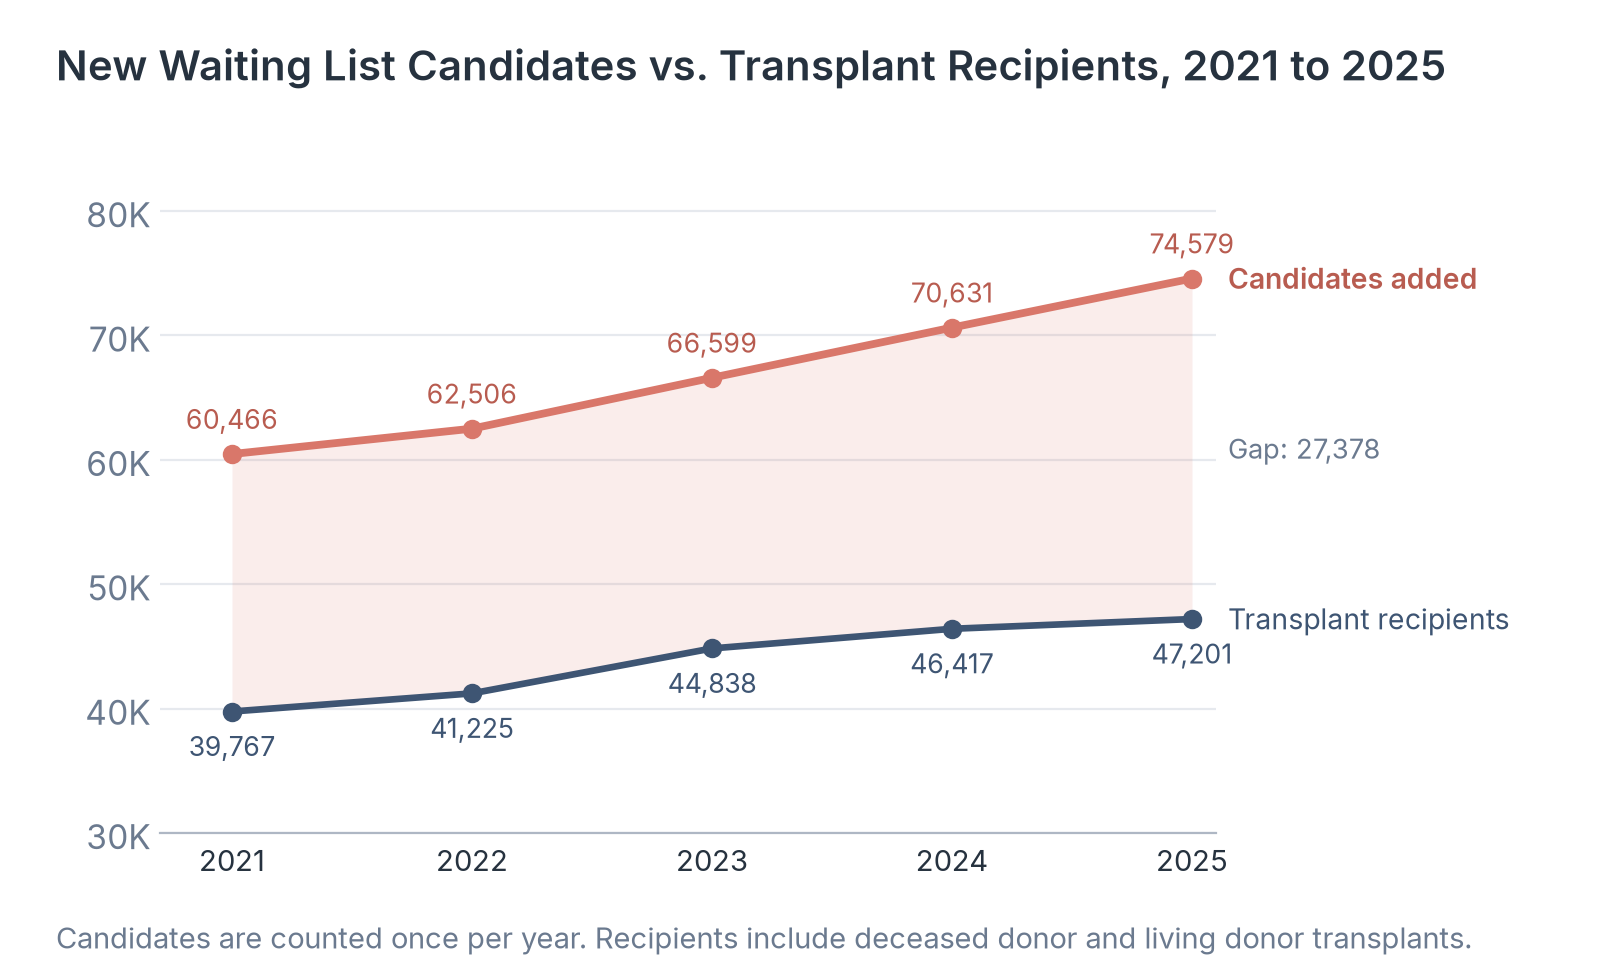
- 74,579 new candidates joined the waiting list in 2025, while 47,201 people received a transplant, a gap of 27,378 that has widened from 20,699 in 2021.
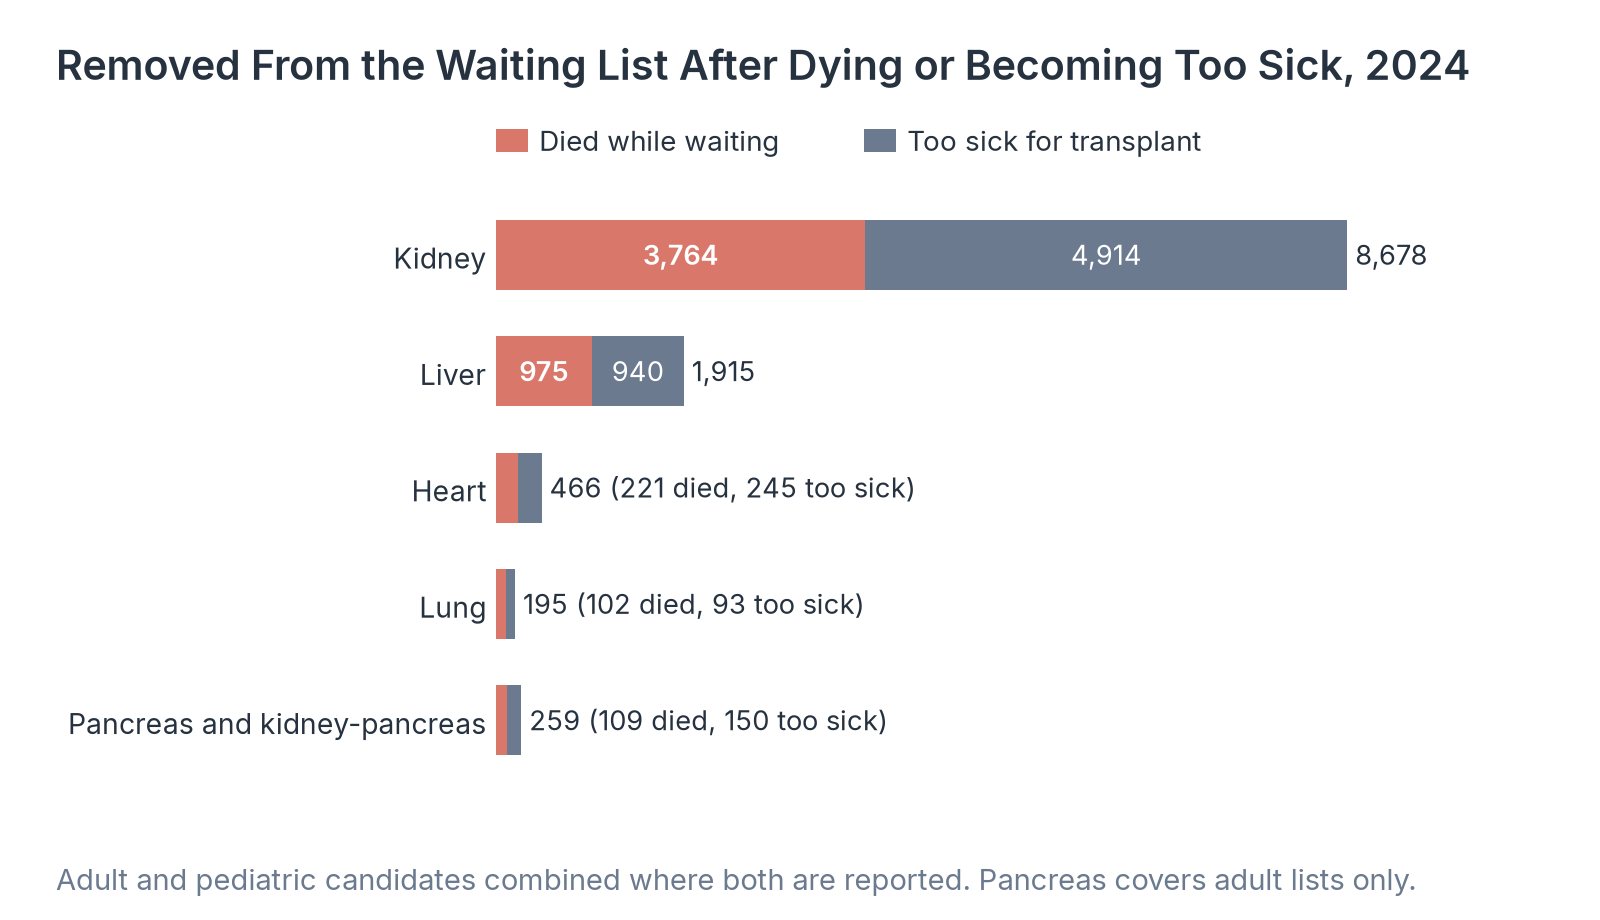
- In 2024, 5,171 people died while on the waiting list and another 6,342 were removed because they had become too sick for a transplant, about 31 people a day combined.
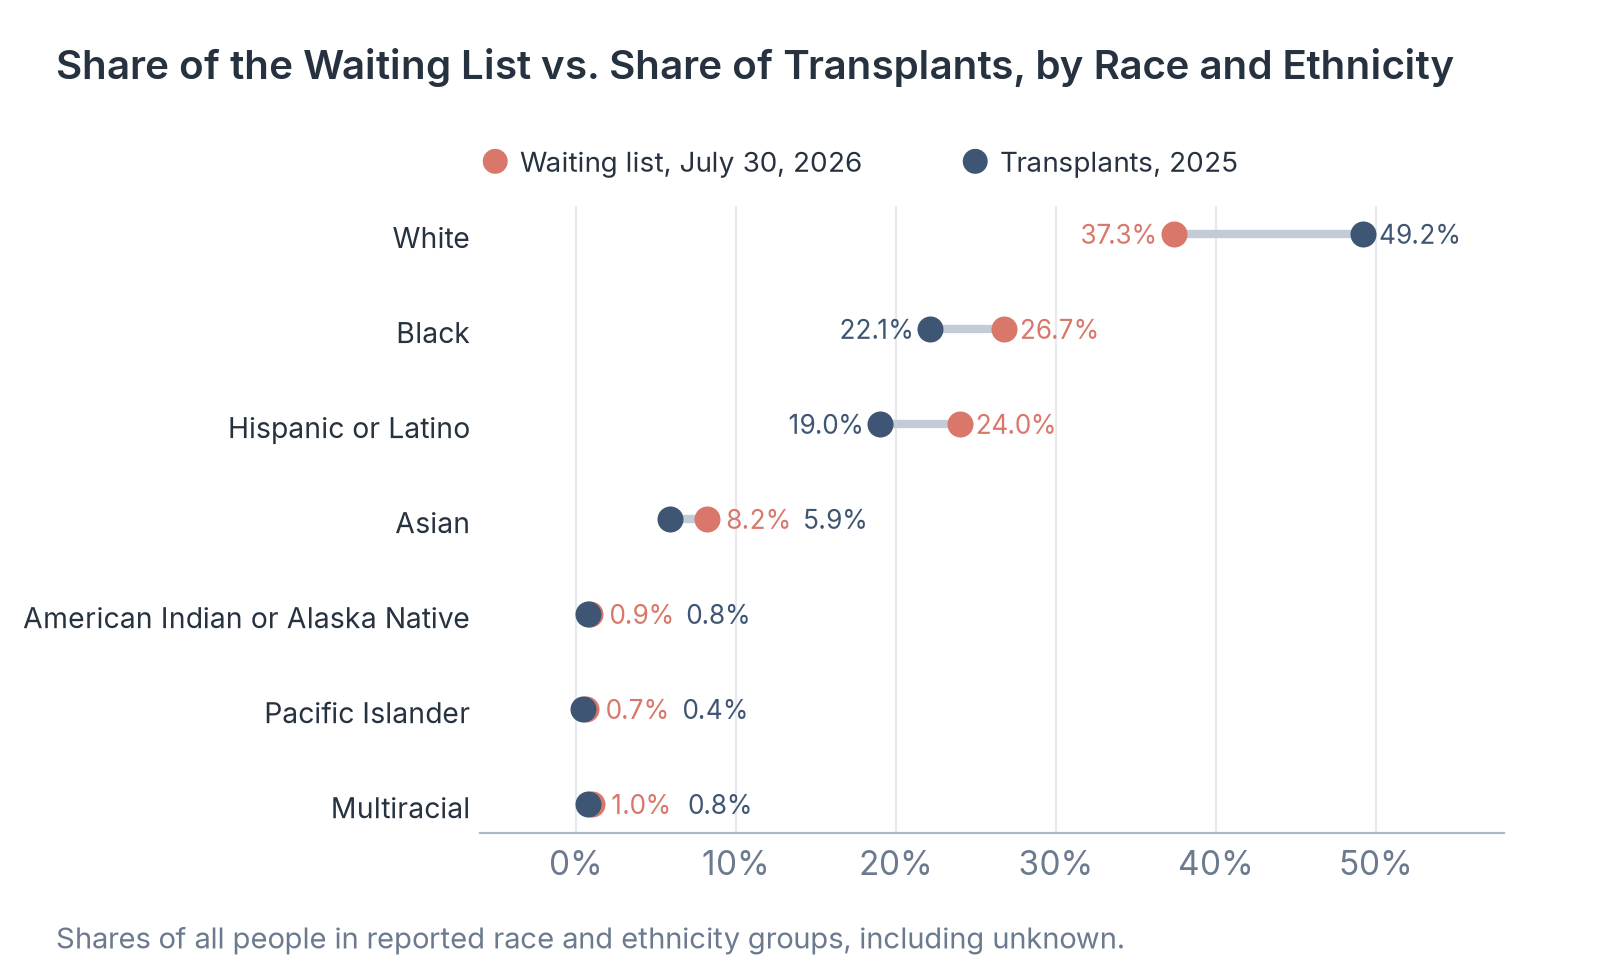
- Black patients made up 26.7% of the waiting list in mid-2026 and 22.1% of 2025 transplant recipients. Hispanic or Latino patients made up 24.0% of the list and 19.0% of recipients.
- The number of deceased organ donors fell 2.6% in 2025, from 16,989 to 16,553, the first decline in the five years we reviewed.
HRSA manages the national organ donation, procurement, and transplantation program for people with end-stage organ failure, such as failed kidneys, liver, heart, or lungs, for whom a transplant is the most appropriate treatment.3 Patients join a single national waiting list kept by the Organ Procurement and Transplantation Network (OPTN), and most wait for an organ from a deceased donor, although many kidney and some liver patients receive one from a living donor. US hospitals performed a record 49,064 transplants in 2025, the fifth record year in a row.5 Even so, someone new is added to the waiting list about every 7 minutes.2 More people join the list each year than leave it with a new organ.
Our analysts combined three public sources built on OPTN records. We took the waiting list by organ, age, and race and ethnicity as of July 30, 2026, along with 2025 transplants by organ and recipient race, from organdonor.gov.2 We took yearly national counts of new candidates, transplant recipients, and donors for 2021 through 2025 from HRSA's Organ Donation and Transplantation dashboard data, refreshed October 23, 2026.3 We took removals for death or for being too sick, outcomes after listing, and death rates on the list from the OPTN/SRTR 2024 Annual Data Report, and added adult and pediatric counts together for each organ.4
In the following sections, we compare the waiting list by organ, the yearly gap between new candidates and transplants, growth by organ, the makeup of the list by race, ethnicity, and age, removals for death or illness, and what happens to patients after they join the list.
How Many People Are Waiting for Each Organ
The waiting list count is a snapshot of everyone registered on a single day, so we set the count for each organ beside the number of transplants of that organ performed in a full year.
| Organ | People waiting, July 30, 2026 | Transplants performed, 2025 | People waiting per transplant performed |
|---|---|---|---|
| Kidney | 95,492 | 27,574 | 3.46 |
| Liver | 8,776 | 12,344 | 0.71 |
| Heart | 4,039 | 4,587 | 0.88 |
| Kidney-pancreas | 2,353 | 804 | 2.93 |
| Lung | 961 | 3,490 | 0.28 |
| Pancreas | 817 | 107 | 7.64 |
| Heart-lung | 31 | 61 | 0.51 |
| Other | 174 | 98 | 1.78 |
Source: Health Resources and Services Administration (HRSA), organdonor.gov Organ Donation Statistics, based on Organ Procurement and Transplantation Network (OPTN) data as of July 30, 2026. Other includes intestine and transplants such as face, hands, and abdominal wall. People waiting for more than one organ appear in more than one row, so the rows add to more than the 109,817 people on the list.
Source: Healthcare Industry Reviews analysis of OPTN waiting list, donor, and transplant data and the OPTN/SRTR 2024 Annual Data Report, conducted November 2026.
Key Findings
- Kidney patients made up 95,492 of the 109,817 people on the list on July 30, 2026, or 3.46 people waiting for every kidney transplant performed in 2025. The pancreas-only list had the highest ratio, with 817 people waiting and 107 transplants.
- For liver, heart, and lung, more transplants were performed in 2025 than there were people waiting on July 30, 2026. The liver list held 8,776 people against 12,344 transplants, the heart list 4,039 against 4,587, and the lung list 961 against 3,490.
- Those ratios track how quickly patients move off each list. Among adults listed in 2023, 24.4% of kidney candidates received a transplant within a year, compared with 61.9% of liver candidates who received a deceased donor liver, and 84.6% of lung candidates on the list in 2024 received a transplant within a year of listing.4 For most kidney patients, the wait is measured in years.
How Fast the Waiting List Grows Compared With Transplants
Each year, new patients join the list while others leave it after a transplant or for other reasons, so we compared new candidates with transplant recipients and with the donors who made those transplants possible.
| Year | New candidates added | Deceased donor transplant recipients | Living donor transplant recipients | Total transplant recipients | Candidates added minus recipients | Deceased donors | Living donors |
|---|---|---|---|---|---|---|---|
| 2021 | 60,466 | 33,229 | 6,538 | 39,767 | 20,699 | 13,862 | 6,542 |
| 2022 | 62,506 | 34,762 | 6,463 | 41,225 | 21,281 | 14,904 | 6,467 |
| 2023 | 66,599 | 37,898 | 6,940 | 44,838 | 21,761 | 16,336 | 6,955 |
| 2024 | 70,631 | 39,398 | 7,019 | 46,417 | 24,214 | 16,989 | 7,031 |
| 2025 | 74,579 | 39,975 | 7,226 | 47,201 | 27,378 | 16,553 | 7,237 |
Source: HRSA, Organ Donation and Transplantation Dashboard data file, refreshed October 23, 2026. Recipients are counted once per year even if they received more than one organ.
Source: Healthcare Industry Reviews analysis of OPTN waiting list, donor, and transplant data and the OPTN/SRTR 2024 Annual Data Report, conducted November 2026.
Key Findings
- The number of new candidates added to the list rose 23.3% from 2021 to 2025, while the number of transplant recipients rose 18.7%. The yearly gap grew from 20,699 to 27,378.
- Deceased donors fell from 16,989 in 2024 to 16,553 in 2025 after rising every year from 2021. Living donors rose 2.9% to 7,237, the most in the five years.
- Deceased donors supplied the organs for 39,975 of the 47,201 transplant recipients in 2025, or 84.7%. A drop in deceased donation therefore limits how many transplants are possible in a year, even as more patients are added to the list.
Which Organ Waiting Lists Are Growing Fastest
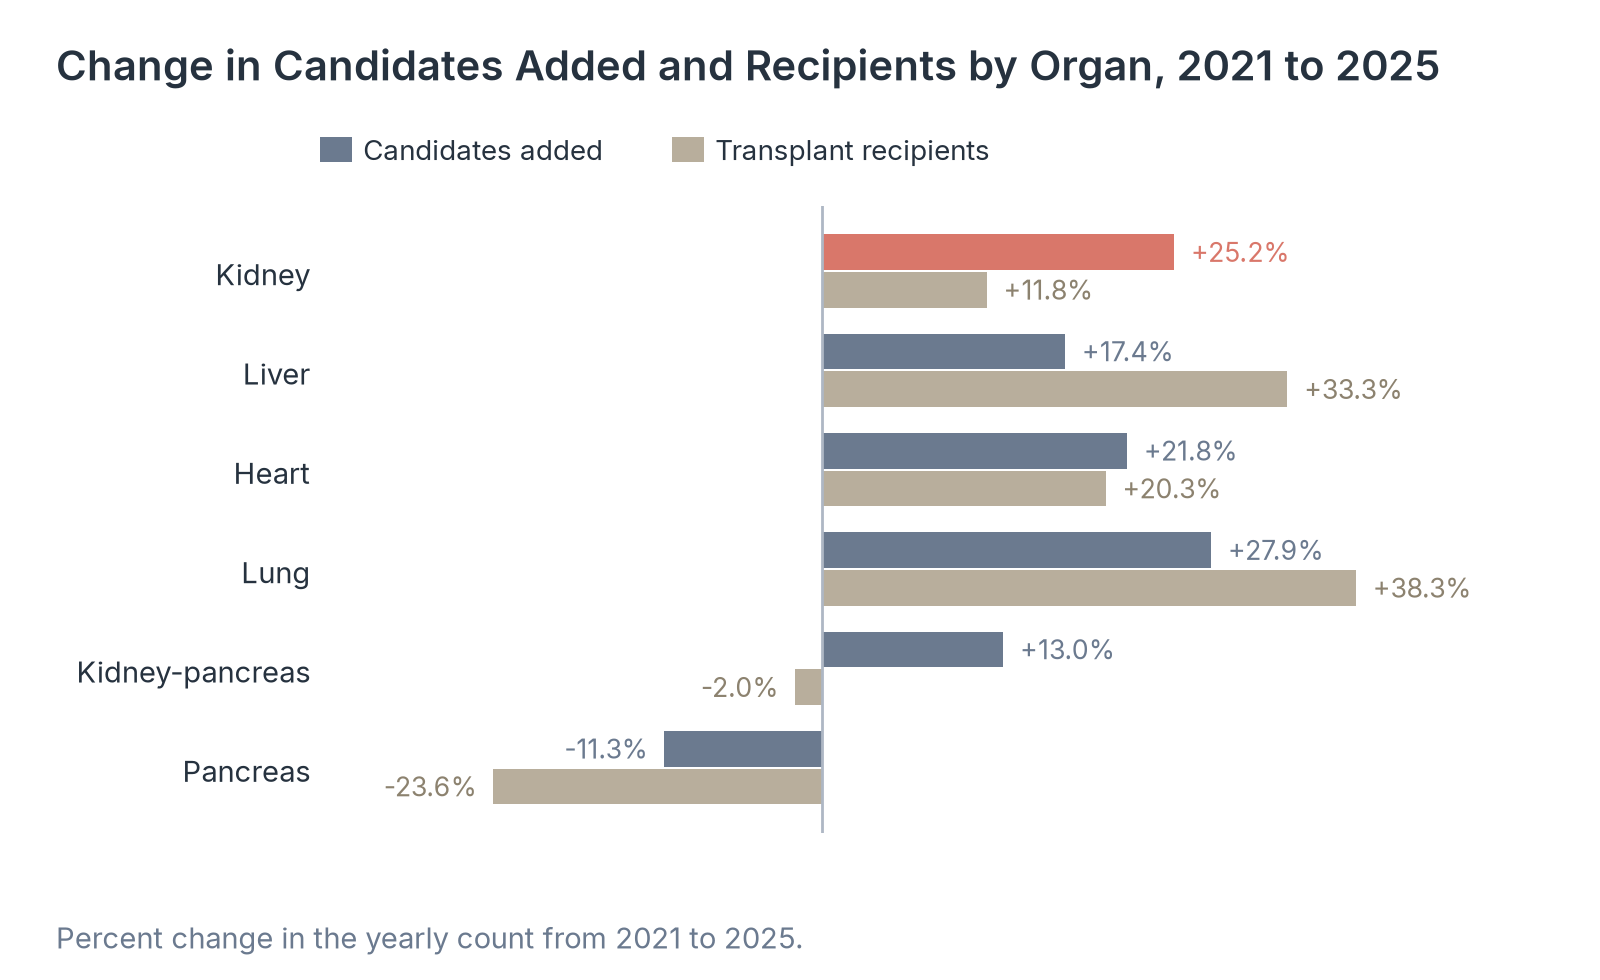
Growth has not been the same for every organ, so we compared new candidates and transplant recipients for each organ in 2021 and 2025.
| Organ | Candidates added, 2021 | Candidates added, 2025 | Change | Recipients, 2021 | Recipients, 2025 | Change |
|---|---|---|---|---|---|---|
| Kidney | 40,081 | 50,190 | +25.2% | 24,653 | 27,559 | +11.8% |
| Liver | 13,439 | 15,778 | +17.4% | 9,116 | 12,155 | +33.3% |
| Heart | 4,948 | 6,029 | +21.8% | 3,806 | 4,579 | +20.3% |
| Lung | 3,064 | 3,918 | +27.9% | 2,520 | 3,484 | +38.3% |
| Kidney-pancreas | 1,434 | 1,620 | +13.0% | 820 | 804 | -2.0% |
| Pancreas | 433 | 384 | -11.3% | 140 | 107 | -23.6% |
Source: HRSA, Organ Donation and Transplantation Dashboard data file, refreshed October 23, 2026.
Source: Healthcare Industry Reviews analysis of OPTN waiting list, donor, and transplant data and the OPTN/SRTR 2024 Annual Data Report, conducted November 2026.
Key Findings
- Kidney candidates added each year rose 25.2%, from 40,081 in 2021 to 50,190 in 2025, while kidney transplant recipients rose 11.8%, from 24,653 to 27,559.
- Transplants grew faster than new candidates for liver and lung. Liver recipients rose 33.3% against 17.4% growth in candidates, and lung recipients rose 38.3% against 27.9%.
- In 2025, kidney candidates added outnumbered kidney recipients by 22,631. The kidney list is where the shortfall between need and transplants is largest, and where any change in deceased donation has the biggest effect.
Who Is on the Organ Transplant Waiting List
We compared each racial and ethnic group's share of the waiting list with its share of the people who received transplants, and we looked at the ages of the people waiting.
| Race and ethnicity | People waiting, July 30, 2026 | Share of waiting list | Transplants, 2025 | Share of transplants | People waiting per transplant |
|---|---|---|---|---|---|
| White | 41,201 | 37.3% | 24,136 | 49.2% | 1.71 |
| Black | 29,506 | 26.7% | 10,864 | 22.1% | 2.72 |
| Hispanic or Latino | 26,465 | 24.0% | 9,330 | 19.0% | 2.84 |
| Asian | 9,037 | 8.2% | 2,891 | 5.9% | 3.13 |
| American Indian or Alaska Native | 983 | 0.9% | 378 | 0.8% | 2.60 |
| Pacific Islander | 723 | 0.7% | 215 | 0.4% | 3.36 |
| Multiracial | 1,106 | 1.0% | 380 | 0.8% | 2.91 |
| Unknown | 1,307 | 1.2% | 871 | 1.8% | 1.50 |
Source: Health Resources and Services Administration (HRSA), organdonor.gov Organ Donation Statistics, based on Organ Procurement and Transplantation Network (OPTN) data as of July 30, 2026. Shares are of the sum of all groups shown.
Source: Healthcare Industry Reviews analysis of OPTN waiting list, donor, and transplant data and the OPTN/SRTR 2024 Annual Data Report, conducted November 2026.
Key Findings
- White patients made up 37.3% of the waiting list and 49.2% of 2025 transplants. Black, Hispanic or Latino, and Asian patients each made up a larger share of the list than of transplants, with 2.72, 2.84, and 3.13 people waiting per transplant, compared with 1.71 for White patients.
- Most people on the list are middle-aged or older. On July 30, 2026, 45,207 people aged 50 to 64 and 28,113 aged 65 and over were waiting, together 66.9% of everyone with a reported age, and 2,116 children under 18 were waiting.
- In January 2023, the OPTN changed kidney allocation rules to grant waiting time credit based on estimated glomerular filtration rate (eGFR), a measure of kidney function. In 2024, Black kidney candidates had the highest deceased donor transplant rate of any racial or ethnic group, at 26.5 transplants per 100 patient-years, which SRTR ties to that change.4
How Many People Die or Become Too Sick While Waiting
Patients leave the list without a transplant when they die or when their transplant team decides they are too sick for surgery, so we added up both kinds of removals by organ for 2022 through 2024.
| Organ | Died, 2022 | Died, 2023 | Died, 2024 | Too sick, 2022 | Too sick, 2023 | Too sick, 2024 |
|---|---|---|---|---|---|---|
| Kidney | 4,758 | 4,063 | 3,764 | 4,516 | 4,865 | 4,914 |
| Liver | 1,061 | 973 | 975 | 1,121 | 987 | 940 |
| Heart | 220 | 216 | 221 | 247 | 277 | 245 |
| Lung | 149 | 95 | 102 | 153 | 92 | 93 |
| Pancreas and kidney-pancreas | 103 | 110 | 109 | 114 | 142 | 150 |
| Total | 6,291 | 5,457 | 5,171 | 6,151 | 6,363 | 6,342 |
Source: OPTN/SRTR 2024 Annual Data Report, Scientific Registry of Transplant Recipients, 2026, removal reason tables for adult and pediatric kidney, liver, heart, and lung candidates and adult pancreas candidates.
Source: Healthcare Industry Reviews analysis of OPTN waiting list, donor, and transplant data and the OPTN/SRTR 2024 Annual Data Report, conducted November 2026.
Key Findings
- In 2024, 11,513 people left the list after dying or becoming too sick for a transplant, about 31 a day. Kidney candidates accounted for 8,678 of them, or 75.4%.
- Deaths on the list fell 17.8%, from 6,291 in 2022 to 5,171 in 2024. Removals for being too sick rose from 6,151 to 6,342 over the same years.
- Since 2023, more people have been removed for being too sick than have died on the list. A count of deaths alone leaves out more than half of the people who lose their chance at a transplant while waiting.
What Happens to Patients After They Join the List
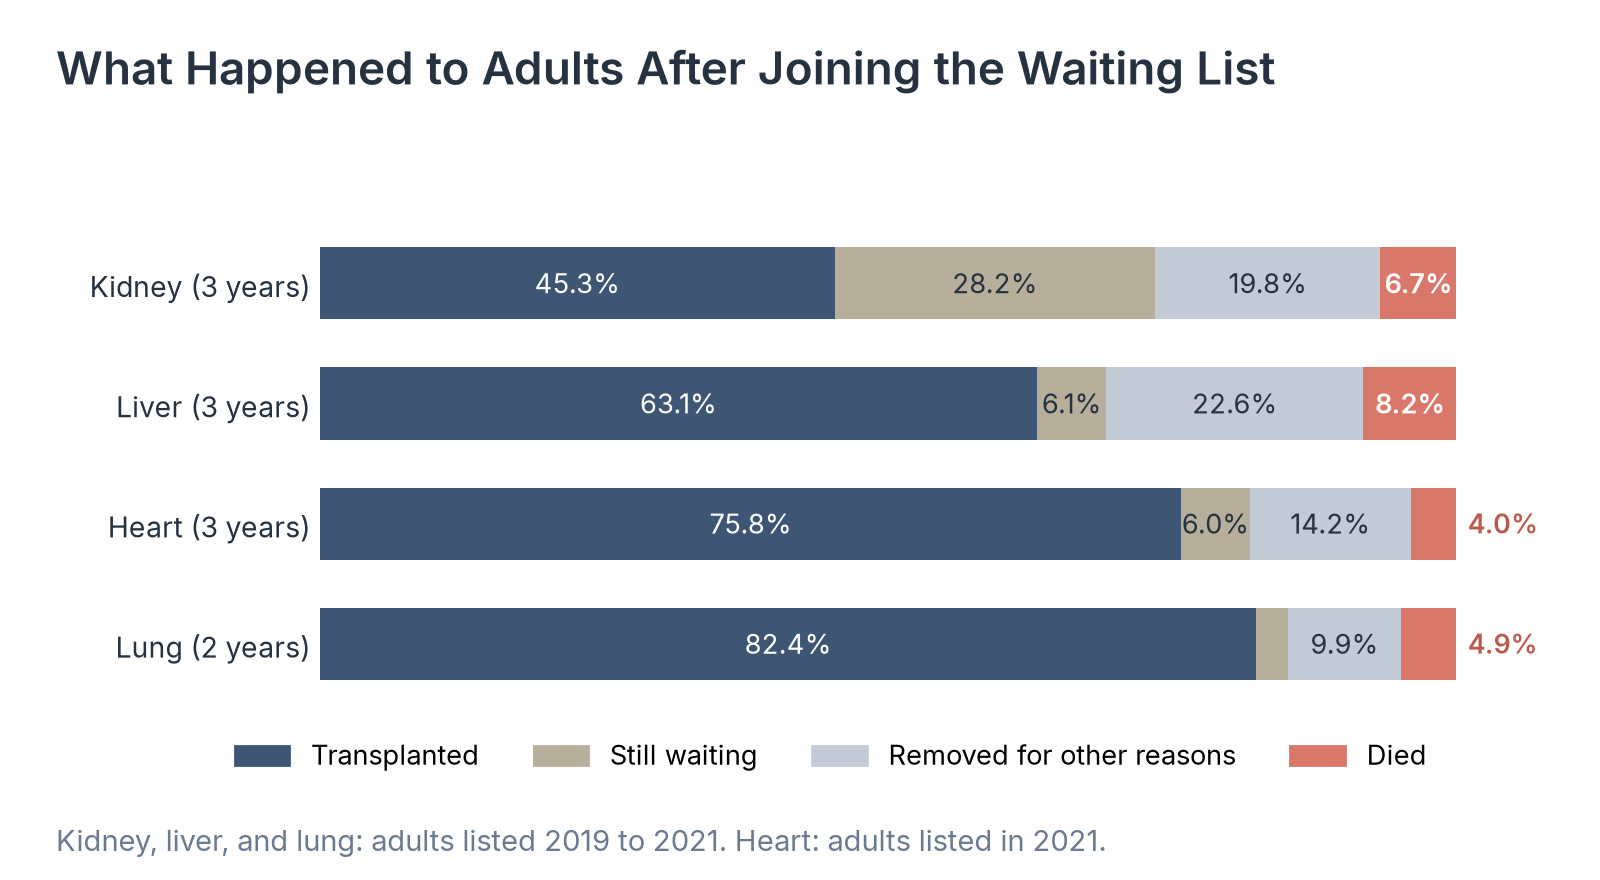
The Scientific Registry of Transplant Recipients (SRTR) follows each group of newly listed adults for several years, which shows how many eventually receive a transplant and how many leave the list without one.
| Organ | Group | Follow-up | Transplanted | Still waiting | Removed for other reasons | Died | Deaths per 100 patient-years, 2024 |
|---|---|---|---|---|---|---|---|
| Kidney | Adults listed 2019 to 2021 | 3 years | 45.3% | 28.2% | 19.8% | 6.7% | 4.7 |
| Liver | Adults listed 2019 to 2021 | 3 years | 63.1% | 6.1% | 22.6% | 8.2% | 13.4 |
| Heart | Adults listed 2021 | 3 years | 75.8% | 6.0% | 14.2% | 4.0% | 8.4 |
| Lung | Adults listed 2019 to 2021 | 2 years | 82.4% | 2.8% | 9.9% | 4.9% | 16.2 |
Source: OPTN/SRTR 2024 Annual Data Report, Scientific Registry of Transplant Recipients, 2026. Transplanted includes deceased and living donor transplants.
Source: Healthcare Industry Reviews analysis of OPTN waiting list, donor, and transplant data and the OPTN/SRTR 2024 Annual Data Report, conducted November 2026.
Key Findings
- Three years after joining the list, 45.3% of adult kidney candidates listed from 2019 to 2021 had received a transplant, 32.4% from a deceased donor and 12.9% from a living donor. Another 28.2% were still waiting and 6.7% had died.
- Adults waiting for other organs were more likely to receive a transplant within the follow-up period: 63.1% for liver, 75.8% for heart, and 82.4% for lung within two years. Liver candidates had the highest share who died, at 8.2%.
- Lung candidates had the highest death rate on the list in 2024, at 16.2 deaths per 100 patient-years, followed by liver at 13.4, heart at 8.4, and kidney at 4.7. For lung and liver patients, each month on the list carries more risk, so the speed of organ allocation matters most.
What the Waiting List Numbers Mean for Patients
For most people on the list, the wait is for a kidney, and it is measured in years. Many of those patients spend that time on dialysis, and nearly 3 in 10 adults who join the kidney list are still waiting three years later.
Transplant numbers have set records, yet new candidates have grown faster, and deceased donation dipped in 2025. Because deceased donors supply most transplanted organs, the size of the list in the next few years depends heavily on whether donation recovers.
So if you are citing the size of the waiting list, give the date of the count and the organ, because the kidney list makes up most of the total and the count changes every day.
Data Collection and Methodology
Waiting list counts by organ, age, and race and ethnicity are a snapshot of OPTN data as of July 30, 2026, published on organdonor.gov. Transplants by organ and by recipient race and ethnicity cover calendar year 2025 from the same page. Because one person can wait for more than one organ, organ rows add to more than the 109,817 people on the list, and race rows add to 110,328; shares by race use that sum. The age groups are as published, and their sum is 109,648. People waiting per transplant compares a one-day count with a full year of transplants, so it is a ratio and not a waiting time.
Yearly counts of new candidates, transplant recipients, and donors come from the national overview tab of HRSA's Organ Donation and Transplantation dashboard data file, refreshed October 23, 2026. A candidate is one person on the list, even if registered at more than one center. Recipients are distinct people who received a transplant that year, so the totals are lower than the count of transplants performed. The dashboard reports 16,553 deceased donors for 2025; a UNOS release reported 16,550.5
Removals for death or for being too sick come from the removal reason tables in the OPTN/SRTR 2024 Annual Data Report. We added the adult and pediatric tables for kidney, liver, heart, and lung, and the three adult pancreas tables (simultaneous pancreas-kidney, pancreas after kidney, and pancreas alone). Intestine is left out because the report gives only 2024 counts. Candidates listed for more than one organ type may be counted in more than one table. Outcomes after listing and death rates per 100 patient-years are as reported in the kidney, liver, heart, and lung chapters. We calculated products, differences, and ratios from the published values.
Sources
- Healthcare Industry Reviews analysis of OPTN waiting list, donor, and transplant data and the OPTN/SRTR 2024 Annual Data Report, conducted November 2026.
- HRSA. Organ Donation Statistics, organdonor.gov, with detailed figure data, based on OPTN data as of July 30, 2026. Reviewed August 2026.
- HRSA Data Warehouse. Organ Donation and Transplantation Dashboard, and its public use data file, data refreshed October 23, 2026.
- Scientific Registry of Transplant Recipients. OPTN/SRTR 2024 Annual Data Report. Health Resources and Services Administration, 2026.
- United Network for Organ Sharing. U.S. surpasses 49,000 organ transplants while deceased organ donations dip. 2026.