Patient Portal Statistics: 2026 Report
Published
Our analysts combined seven waves of the National Cancer Institute's Health Information National Trends Survey from 2014 to 2024, as reported by the federal Assistant Secretary for Technology Policy, with a June 2026 JAMA study of portal messages and visits across 140 million patient records in Epic from 2020 to 2025. Together they show how many US adults use patient portals, how they reach them, and how much messaging portals now generate for care teams as of Q4 2026.
Key Findings
- 65% of US adults were offered and used a patient portal or online medical record in 2024, up from 25% in 2014, and 77% were offered access.
- 51% of adults used a portal on behalf of someone they care for in 2024, more than double the 24% who did so in 2020.
- 57% of portal users reached their records through an app in 2024, up from 38% in 2020, while 42% used only a website.
- 59% of adults had more than one portal in 2024, but only 7% used an app that combines records from different portals.
- Patients sent 2.50 portal messages per person per year in Epic health records in 2025, up 153% from 0.99 in 2020, while office visits rose 17% to 2.77.
Most US adults now have at least one patient portal, the secure website or app where they can see test results, read visit notes, refill prescriptions, and message their care team. Patients usually get one from their doctor's office, and many also have one from an insurer, a lab, or a pharmacy. Federal rules under the 21st Century Cures Act called on health record software makers to let patients pull their records into a smartphone app of their choice. As more patients log in, the number of portal messages sent to doctors and nurses has grown with them. We wanted to put adoption and message volume in one place.
Our analysts used the Assistant Secretary for Technology Policy's Data Brief No. 77, which reports Health Information National Trends Survey results for 2014 through 2024. The 2024 wave surveyed 7,278 adults by mail and web from March to September 2024, and results are weighted to represent all US adults. We added results from a JAMA research letter by Jane J. Long and colleagues at New York University, which counted portal messages, office visits, and phone encounters per active patient from 2020 to 2025 in Epic Cosmos, a data set drawn from 2,067 hospitals and 47,100 clinics.
In the following sections, we compare portal adoption over 10 years, look at use among people with chronic conditions and cancer, show how patients reach their records, count how many portals each person holds, and measure the growth in portal messaging since 2020.
How Many US Adults Use Patient Portals, 2014 to 2024
Portal adoption is usually quoted as a single number, but the survey tracks three separate things: whether a provider or insurer offered online access, whether the person used it, and whether they used someone else's portal as a caregiver. We set out all three for each survey year.
| Survey year | Offered online access by a provider or insurer | Offered access and used it in the past year | Used a portal for someone they care for |
|---|---|---|---|
| 2014 | 42% | 25% | Not asked |
| 2017 | 52% | 27% | Not asked |
| 2018 | 51% | 30% | 18%* |
| 2019 | 58% | 37% | Not asked |
| 2020 | 59% | 38% | 24% |
| 2022 | 73% | 57% | 46% |
| 2024 | 77% | 65% | 51% |
Source: Assistant Secretary for Technology Policy, Individuals' Access and Use of Patient Portals and Smartphone Health Apps, 2024, Data Brief No. 77, July 2025, using the Health Information National Trends Survey. *The 2018 caregiver question had different answer options and is not directly comparable with later years.
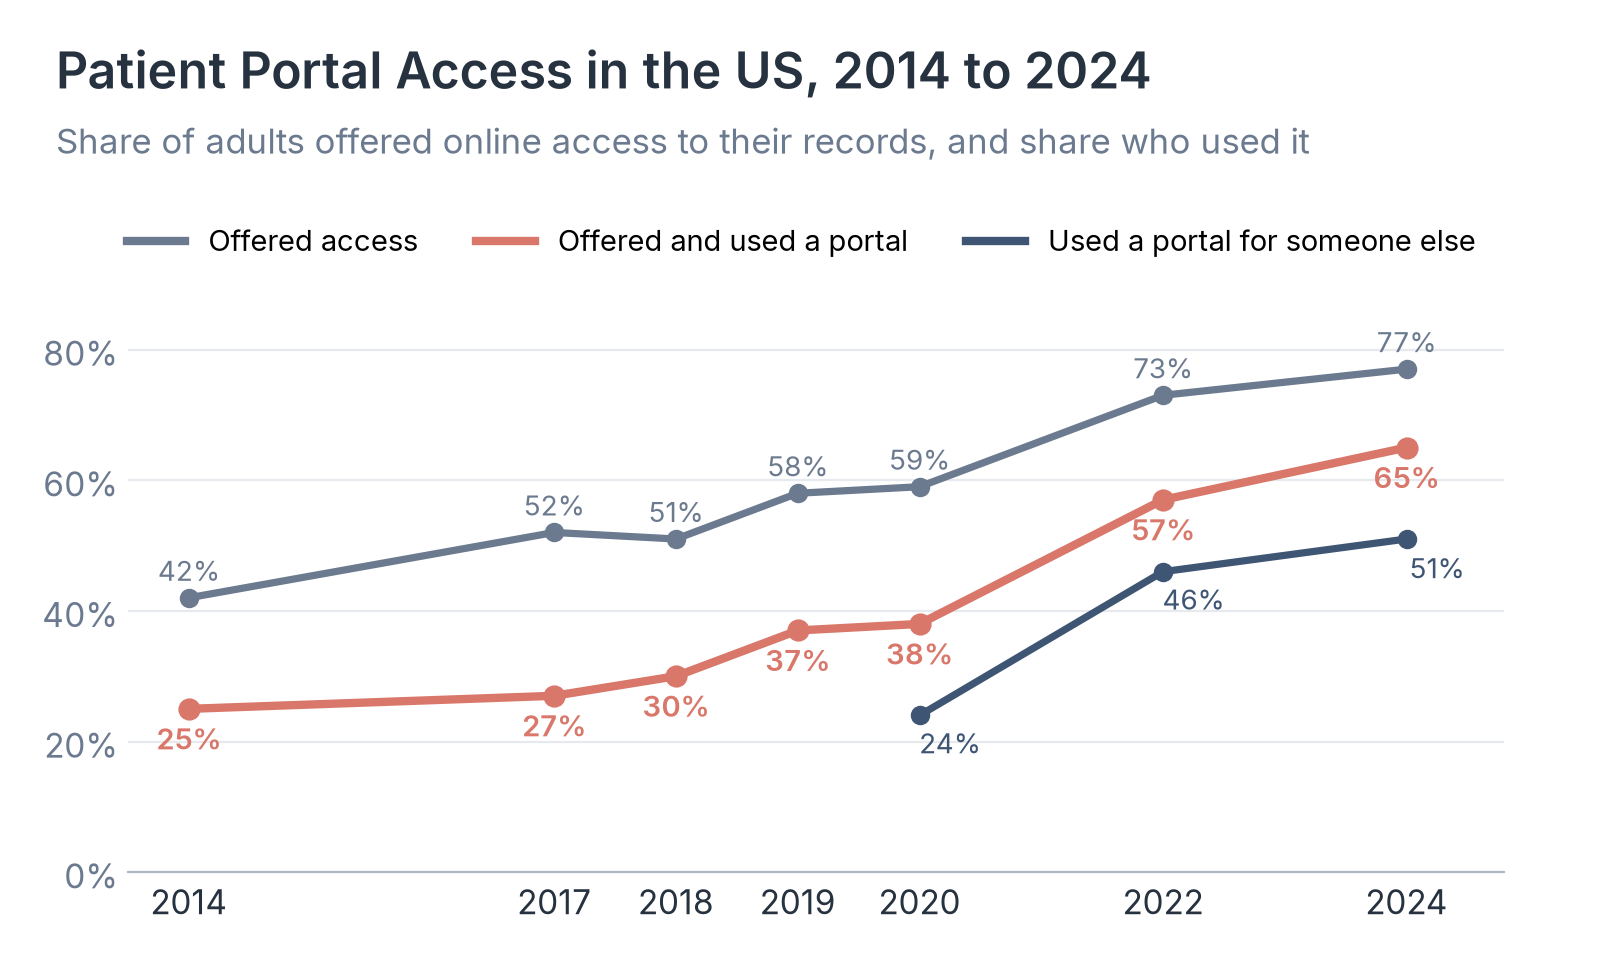
Source: Healthcare Industry Reviews analysis of Health Information National Trends Survey results reported by the Assistant Secretary for Technology Policy, July 2025.
Key Findings
- The share of adults who used a portal grew by 19 points between 2020 and 2022, more than in the six years from 2014 to 2020 combined. The federal brief links the jump to the pandemic shift to virtual care and to the Cures Act rules taking effect.
- The gap between adults offered a portal and adults who used one narrowed from 21 points in 2020 to 12 points in 2024. Nearly twice as many adults, 23%, had never been offered a portal as had been offered one and not used it.
- Caregiver use more than doubled in four years. For portal vendors and health systems, proxy access for the people a patient cares for is now a mainstream feature, used by half of US adults.
Portal Use by Health Status and Provider Encouragement
People who see doctors often have the most reason to check results and message their care team, and a clinician's nudge can decide whether someone logs in at all. The 2024 survey breaks out both groups.
| Group | Offered online access | Offered access and used it in the past year |
|---|---|---|
| All adults | 77% | 65% |
| Adults with a chronic condition | 81% | 69% |
| Adults with a cancer diagnosis in the past 5 years | 86% | 76% |
Source: Assistant Secretary for Technology Policy, Individuals' Access and Use of Patient Portals and Smartphone Health Apps, 2024, Data Brief No. 77, July 2025, using the Health Information National Trends Survey. Chronic conditions are heart disease, lung disease, diabetes, high blood pressure, or depression.
| Measure | Encouraged by their provider | Not encouraged |
|---|---|---|
| Used the portal in the past year | 87% | 57% |
| Viewed test results (portal users) | 92% | 78% |
| Viewed clinical notes (portal users) | 82% | 57% |
Source: Assistant Secretary for Technology Policy, Individuals' Access and Use of Patient Portals and Smartphone Health Apps, 2024, Data Brief No. 77, July 2025, using the Health Information National Trends Survey. Base is adults offered online access; viewing rates are among portal users. 89% of adults offered access said a provider encouraged them to use it.
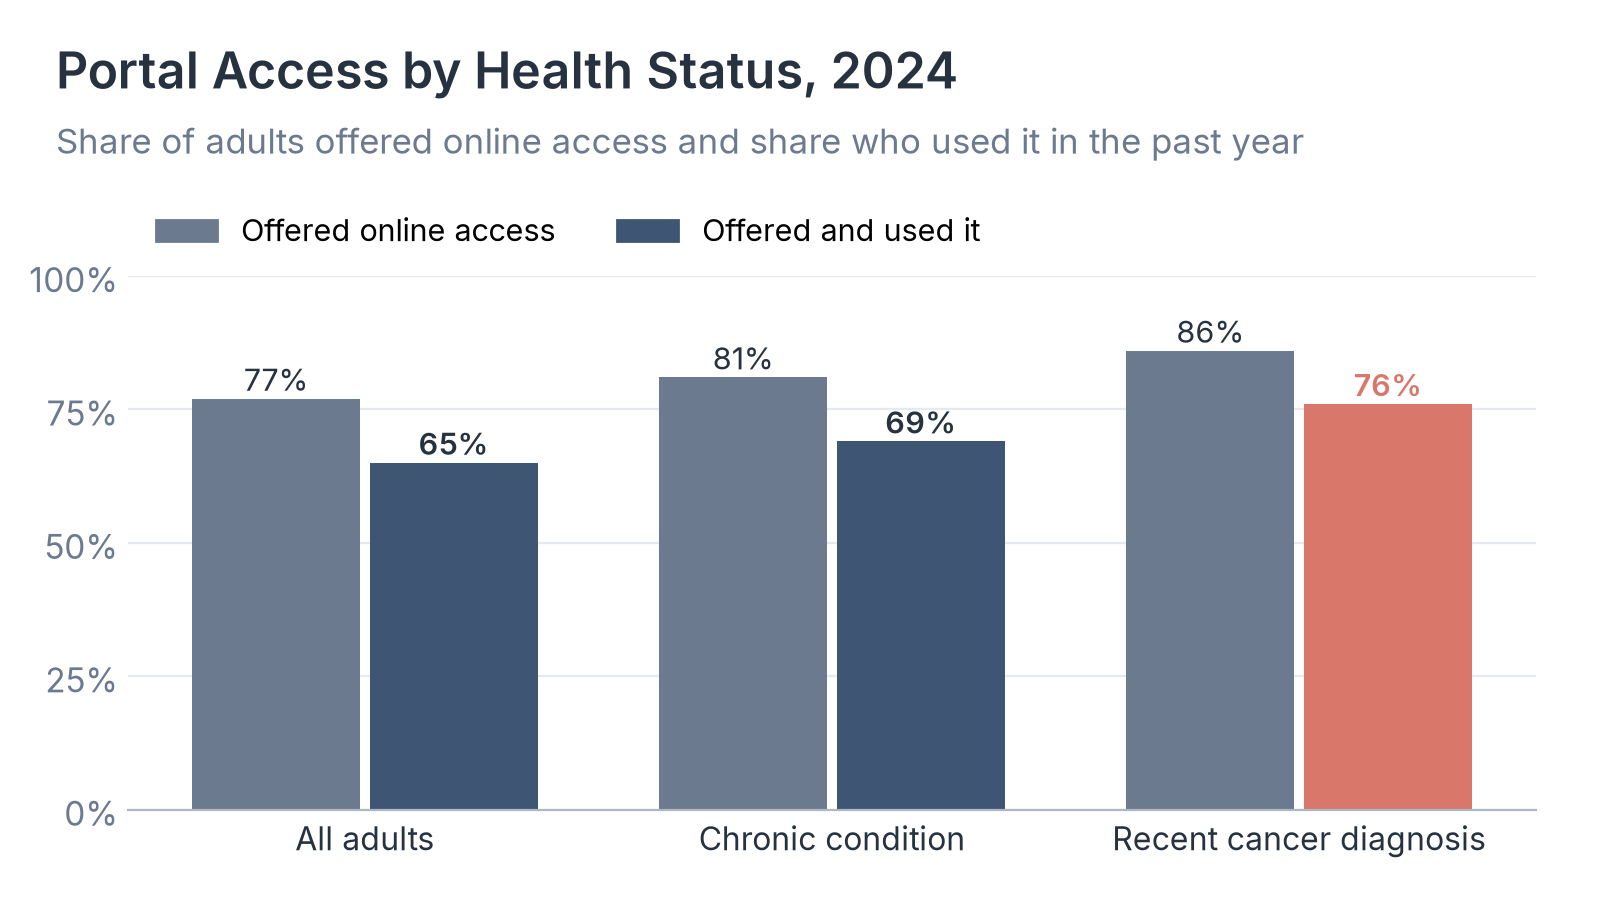
Source: Healthcare Industry Reviews analysis of Health Information National Trends Survey results reported by the Assistant Secretary for Technology Policy, July 2025.
Key Findings
- Adults managing a recent cancer diagnosis used portals at the highest rate, 76%, 11 points above all adults. Adults with a chronic condition were 4 points above.
- Among adults offered a portal, 87% of those encouraged by a provider used it, compared with 57% of those who were not. The share who said they were encouraged rose from 79% in 2020 to 89% in 2024.
- Encouraged users were also much more likely to read their clinical notes, 82% against 57%. That 25-point gap is larger than the 14-point gap for viewing test results.
How Many Portal Users Reach Their Records Through an App
The Cures Act rules were written partly to let patients reach their records through a smartphone app of their choice. The survey has asked portal users how they log in since 2020, which shows how far that shift has gone.
| Survey year | Used an app | Used the website only | Did not know |
|---|---|---|---|
| 2020 | 38% | 60% | 2% |
| 2022 | 51% | 48% | 1% |
| 2024 | 57% | 42% | 2% |
Source: Assistant Secretary for Technology Policy, Individuals' Access and Use of Patient Portals and Smartphone Health Apps, 2024, Data Brief No. 77, July 2025, using the Health Information National Trends Survey. Base is adults who used a portal in the past year. App users include people who used both an app and a website.
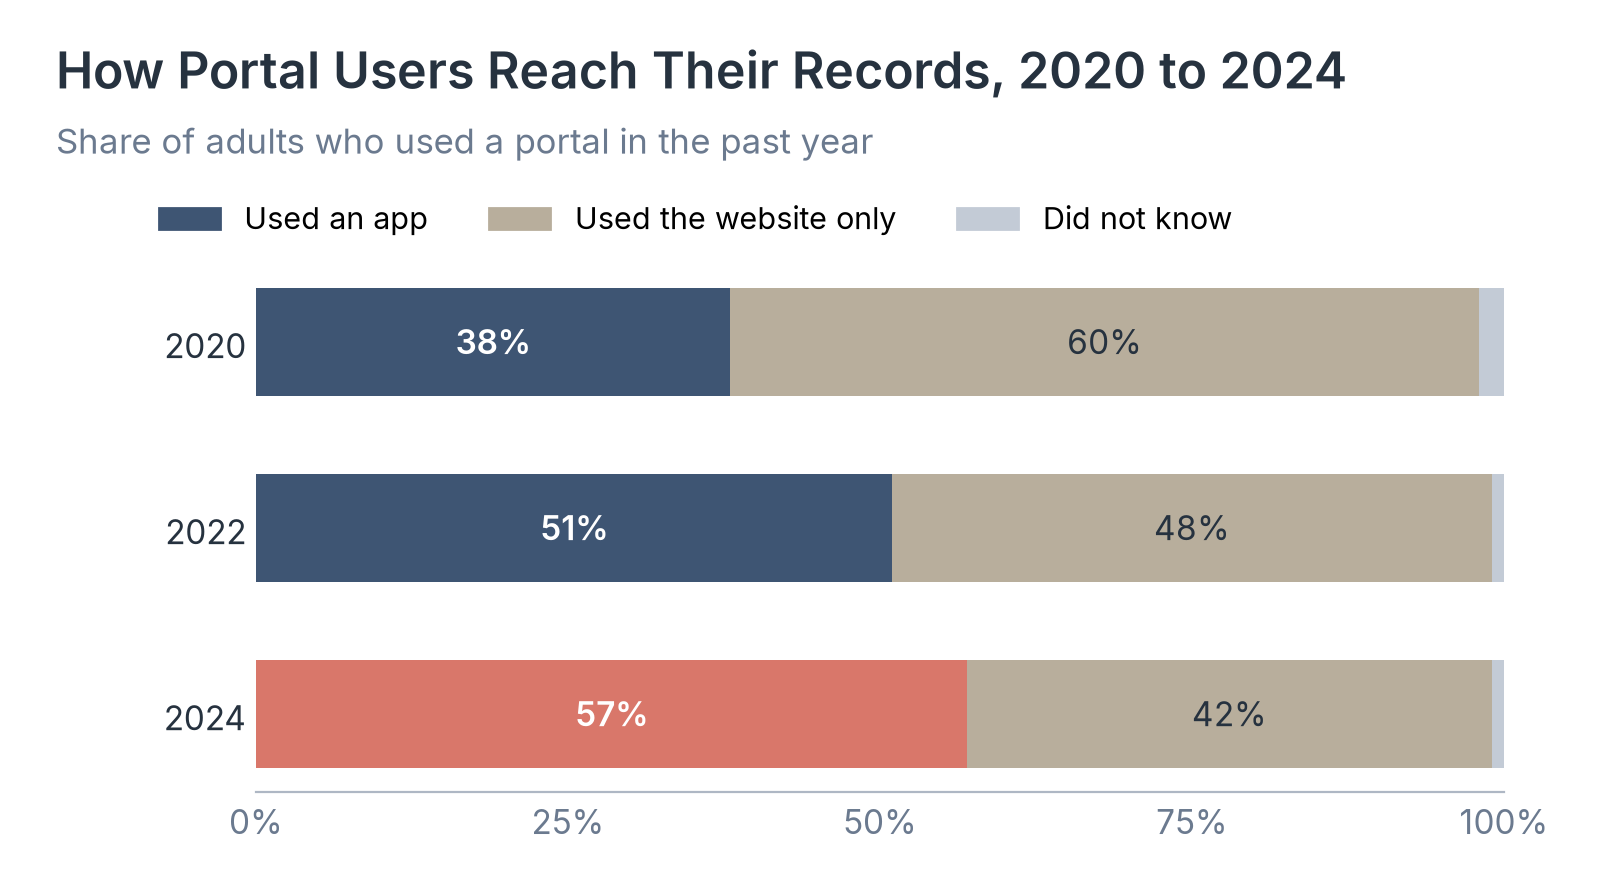
Source: Healthcare Industry Reviews analysis of Health Information National Trends Survey results reported by the Assistant Secretary for Technology Policy, July 2025.
Key Findings
- App use passed website-only use in 2022 and kept rising to 57% in 2024. Website-only use fell by 18 points over four years.
- App use grew 13 points between 2020 and 2022 and 6 points between 2022 and 2024, so the shift away from websites continued at about half its earlier pace.
- The federal brief notes that patients mostly use portal apps from health record vendors, such as Epic's MyChart, and from health systems and insurers. Apps that combine records from several portals still reach few patients.
How Many Portals Patients Have and Who Offers Them
Most adults now get care from more than one organization, and each one can issue its own login. We compared where adults held portal accounts in 2022 and 2024 and how many use an app to combine them.
| Organization | 2022 | 2024 |
|---|---|---|
| Primary care provider's office | 63% | 68% |
| Other health care provider | 32% | 40% |
| Insurer | 29% | 30% |
| Clinical laboratory | 26% | 29% |
| Pharmacy | 23% | 24% |
| Hospital | Not asked | 22% |
| More than one of these | 50% | 59% |
| No portal | 22% | 16% |
| Used an app to combine portals | 2% | 7% |
Source: Assistant Secretary for Technology Policy, Individuals' Access and Use of Patient Portals and Smartphone Health Apps, 2024, Data Brief No. 77, July 2025, using the Health Information National Trends Survey. Categories overlap, so they add to more than 100%.
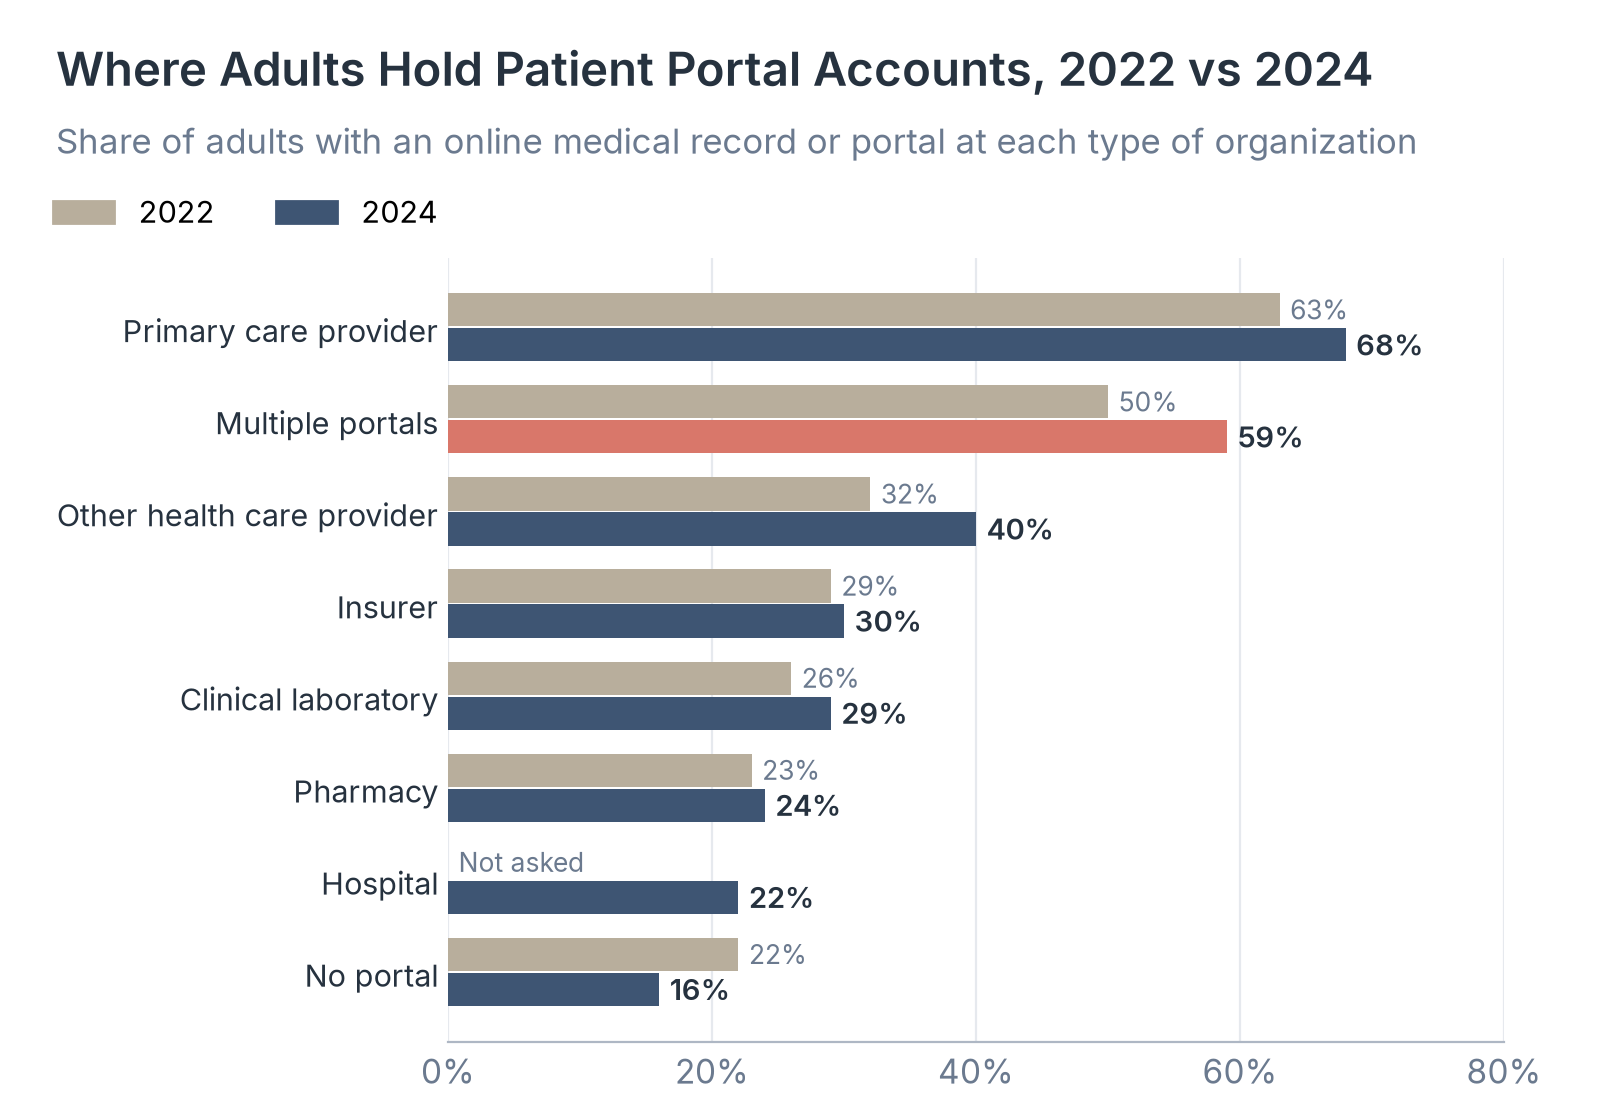
Source: Healthcare Industry Reviews analysis of Health Information National Trends Survey results reported by the Assistant Secretary for Technology Policy, July 2025.
Key Findings
- The share of adults with more than one portal rose 9 points in two years to 59%, with the largest gain in portals from health care providers other than a primary care office, up 8 points to 40%.
- Only 7% of adults used an app such as Apple Health Records or CommonHealth to bring their portals together in 2024, and the rate was the same among people with several portals. That leaves most patients logging into separate accounts for their doctor, lab, insurer, and pharmacy.
- The share of adults with no portal at all fell from 22% to 16%. Over the same two years, the share with a portal from a primary care office rose 5 points to 68%, still the most common source.
How Portal Messaging Has Grown Since 2020
Every portal login can turn into a message that a nurse, doctor, or staff member has to read and answer, so message volume is the part of portal growth that health systems feel most directly. The JAMA study measured messages and visits per active patient in Epic records from 2020 to 2025.
| Measure | 2020 | 2025 | Change |
|---|---|---|---|
| Messages written by patients | 0.99 | 2.50 | +153% |
| Messages sent by clinicians and staff | 4.59 | 5.70 | +24% |
| Office visits | 2.37 | 2.77 | +17% |
| Phone encounters | 2.33 | 2.20 | -6% |
| Patient messages per office visit | 0.42 | 0.90 | +0.48 |
Source: Long J.J. et al., Trends in Patient Portal Messages, Office Visits, and Telephone Encounters, JAMA, June 22, 2026, as reported by HealthDay, June 24, 2026.
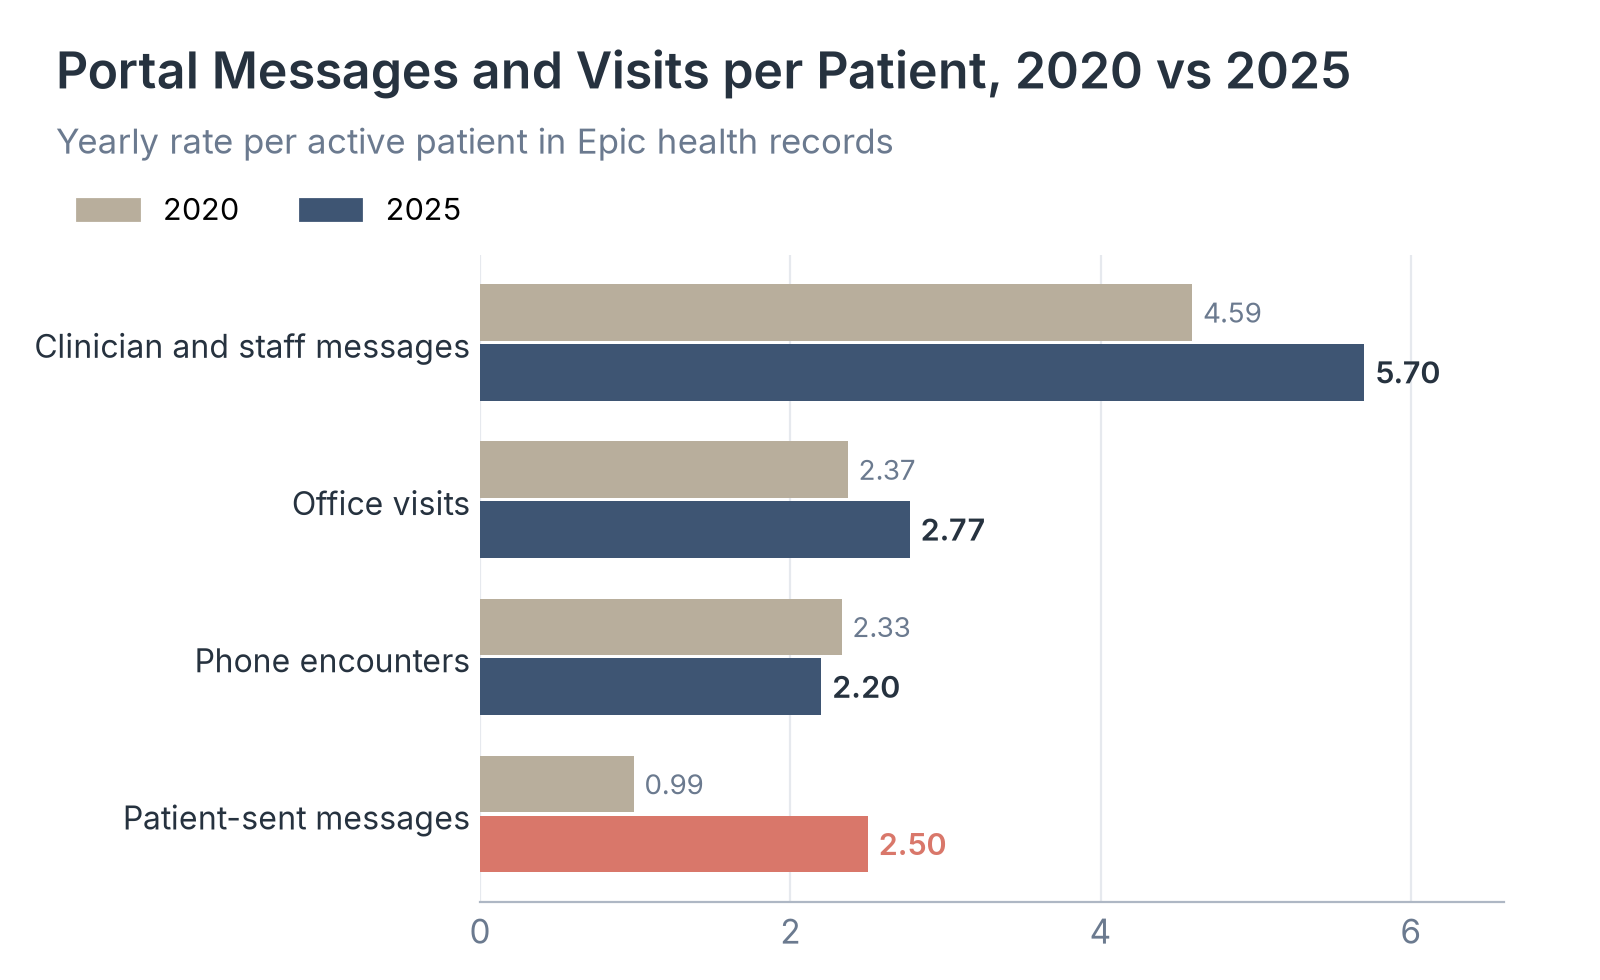
Source: Healthcare Industry Reviews analysis of Long J.J. et al., JAMA, June 22, 2026, as reported by HealthDay.
Key Findings
- Patients sent about one portal message for every office visit in 2025, up from about one for every two and a half visits in 2020. Messages from clinicians and staff peaked at 6.86 per patient in 2021 before settling at 5.70.
- Office visits rose while messages grew, so messaging added to clinic workload and did not replace visits. Phone encounters fell slightly, and the authors found message growth was linked with changes in phone volume.
- Telehealth visits fell back to 0.19 per patient per year by 2025 after their pandemic spike, so for most patients the portal message, more than the video visit, has become the everyday digital channel to their care team.
What Patient Portal Statistics Mean for Patients and Care Teams in 2026
For patients, the portal has become the usual way to see results and reach a care team, often on a phone and often for someone they care for as well as for themselves. The main friction left is keeping track of separate accounts at each doctor, lab, insurer, and pharmacy, since few people use a tool that combines them.
For hospitals and practices, the bigger change is in the inbox. Patient messages grew nine times as fast as office visits from 2020 to 2025. Dorry L. Segev, one of the study's authors at New York University, said clinical staff will need training in messaging tools, in AI support programs, and in online billing and counseling.
So if you cite a patient portal adoption rate, say whether it counts adults who were offered a portal or adults who used one, because the 2024 figures are 77% and 65%.
Data Collection and Methodology
Adoption figures come from the Assistant Secretary for Technology Policy's Data Brief No. 77, Individuals' Access and Use of Patient Portals and Smartphone Health Apps, 2024 (July 2025), which we read with its PDF and figure files on November 2, 2026. The brief reports the National Cancer Institute's Health Information National Trends Survey (HINTS) for 2014 (HINTS 4 Cycle 4), 2017 to 2020 (HINTS 5 Cycles 1 to 4), 2022 (HINTS 6), and 2024 (HINTS 7). HINTS 7 was fielded by mail and web from March to September 2024 with a two-stage address sample, collected complete data from 7,278 adults at a 27.31% response rate, and is weighted to national estimates. Yearly values come from the brief's trend chart, and the other tables come from its later charts and appendix table. The caregiver question before 2020 lacked the answer "care recipient does not have an online medical record," so the 2018 value is not directly comparable. App use and source-of-portal questions are asked only of adults who used a portal or have one, as noted under each table.
Message figures come from a research letter by Jane J. Long and colleagues at New York University, Trends in Patient Portal Messages, Office Visits, and Telephone Encounters, published in JAMA on June 22, 2026. We took the published rates from HealthDay's June 24, 2026 report on the study. The study used deidentified Epic Cosmos records covering about 140 million patients at 2,067 hospitals and 47,100 clinics, and it reports annual rates per active patient. Epic Cosmos covers organizations that use Epic's health record, so its rates may differ from national averages.
The survey and the message study measure different populations: HINTS covers all US adults, and the message rates cover active patients in Epic records. We present them in separate tables and do not combine them. We calculated products, differences, and ratios from the published values.
Sources
- Healthcare Industry Reviews, Patient Portal Study: analysis of seven waves of Health Information National Trends Survey results from 2014 to 2024 and published 2020 to 2025 portal message rates from Epic Cosmos records, by year, health status, access method, and portal source, conducted November 2026.
- Richwine C. Assistant Secretary for Technology Policy. Individuals' Access and Use of Patient Portals and Smartphone Health Apps, 2024. Data Brief No. 77. July 2025. PDF.
- Long J.J. et al. Trends in Patient Portal Messages, Office Visits, and Telephone Encounters. JAMA. June 22, 2026.
- Solomon L. HealthDay. Patient Portals Now Routine Part of Health Care. Drugs.com, June 24, 2026.