Pharmacy Closure Statistics: 2026 Report
Published
Our analysts reviewed MedPAC's National Council for Prescription Drug Programs pharmacy closure counts from 2021 through 2025, Part D ZIP codes without a retail pharmacy from 2018 through 2025, and published pharmacy desert and keystone pharmacy estimates covering 323.5 million people. The figures show how fast retail pharmacies have been closing, how often chains versus independents exit, and how many people already live in a pharmacy desert as of Q4 2026.
Key Findings
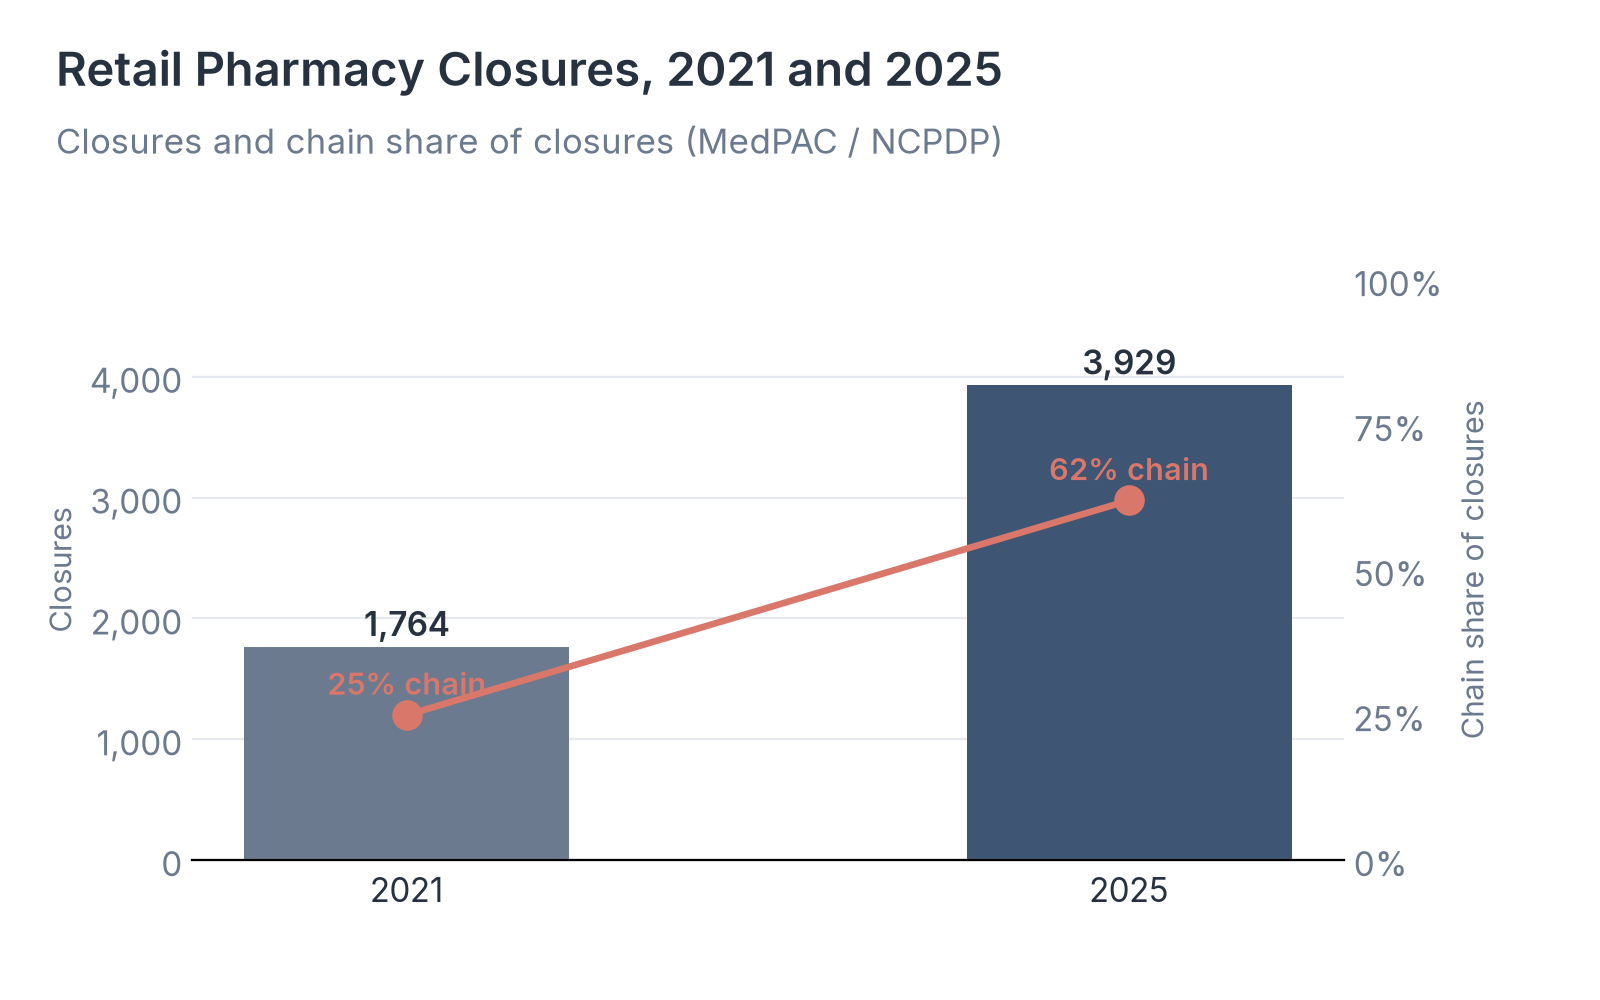
- Retail pharmacy closures rose from 1,764 in 2021 to 3,929 in 2025, and chains accounted for 62% of 2025 closures, up from 25% in 2021.
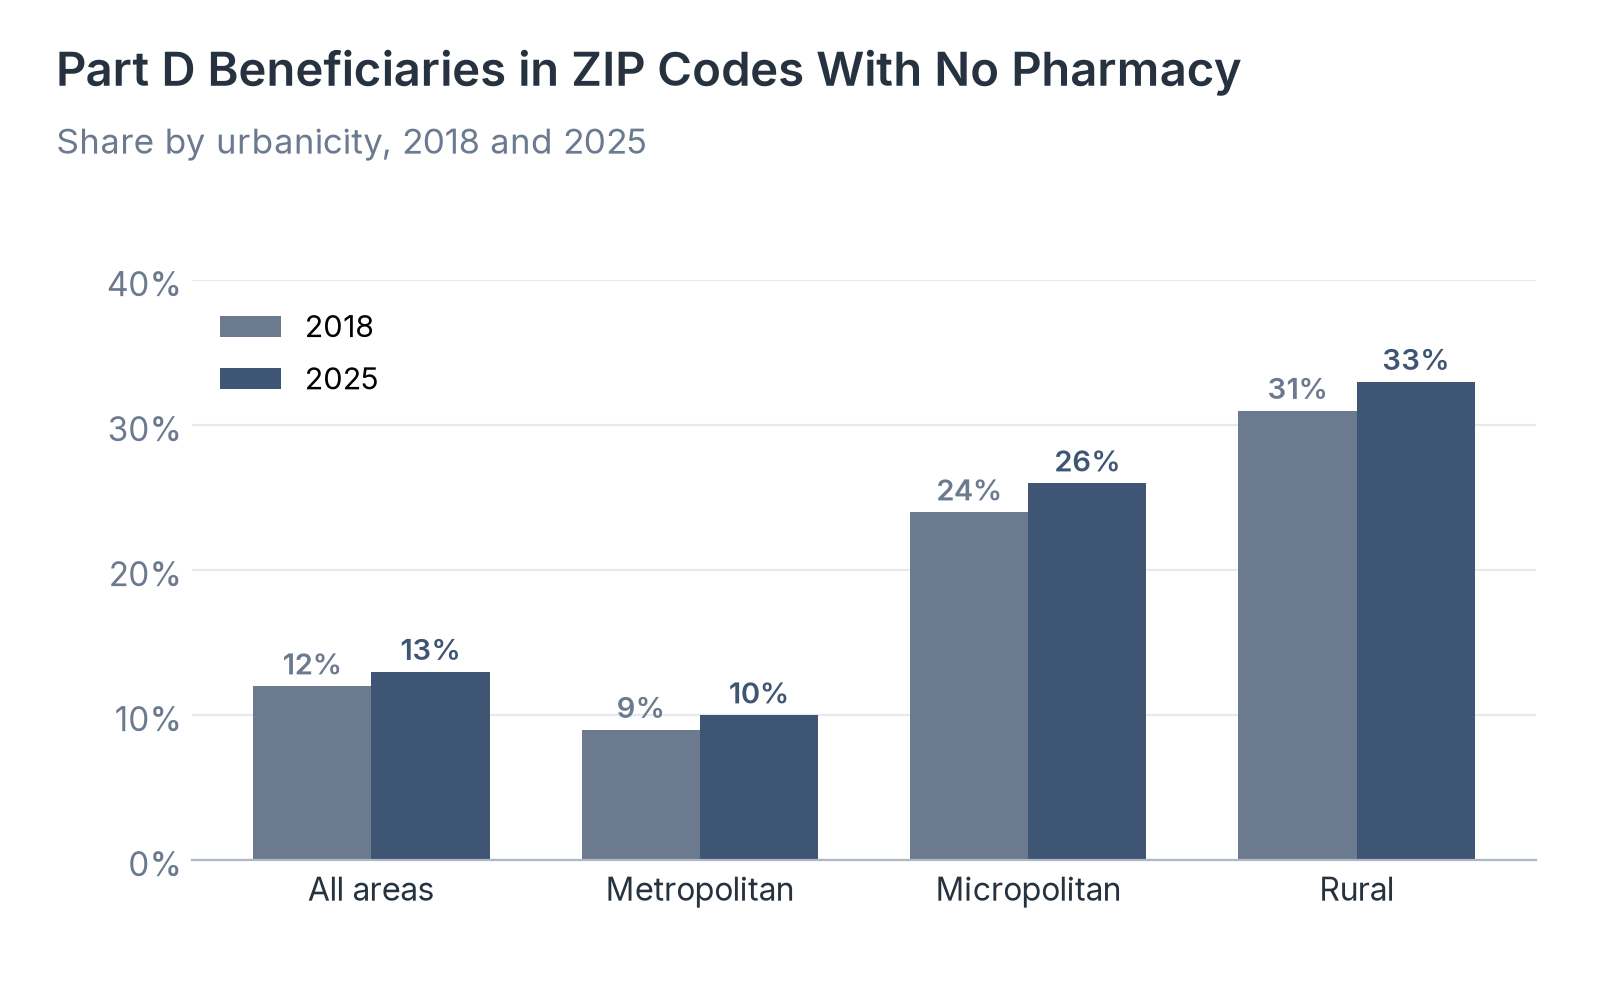
- 13% of Medicare Part D beneficiaries lived in a ZIP code with no retail pharmacy in 2025, up from 12% in 2018, and the rural share reached 33%.
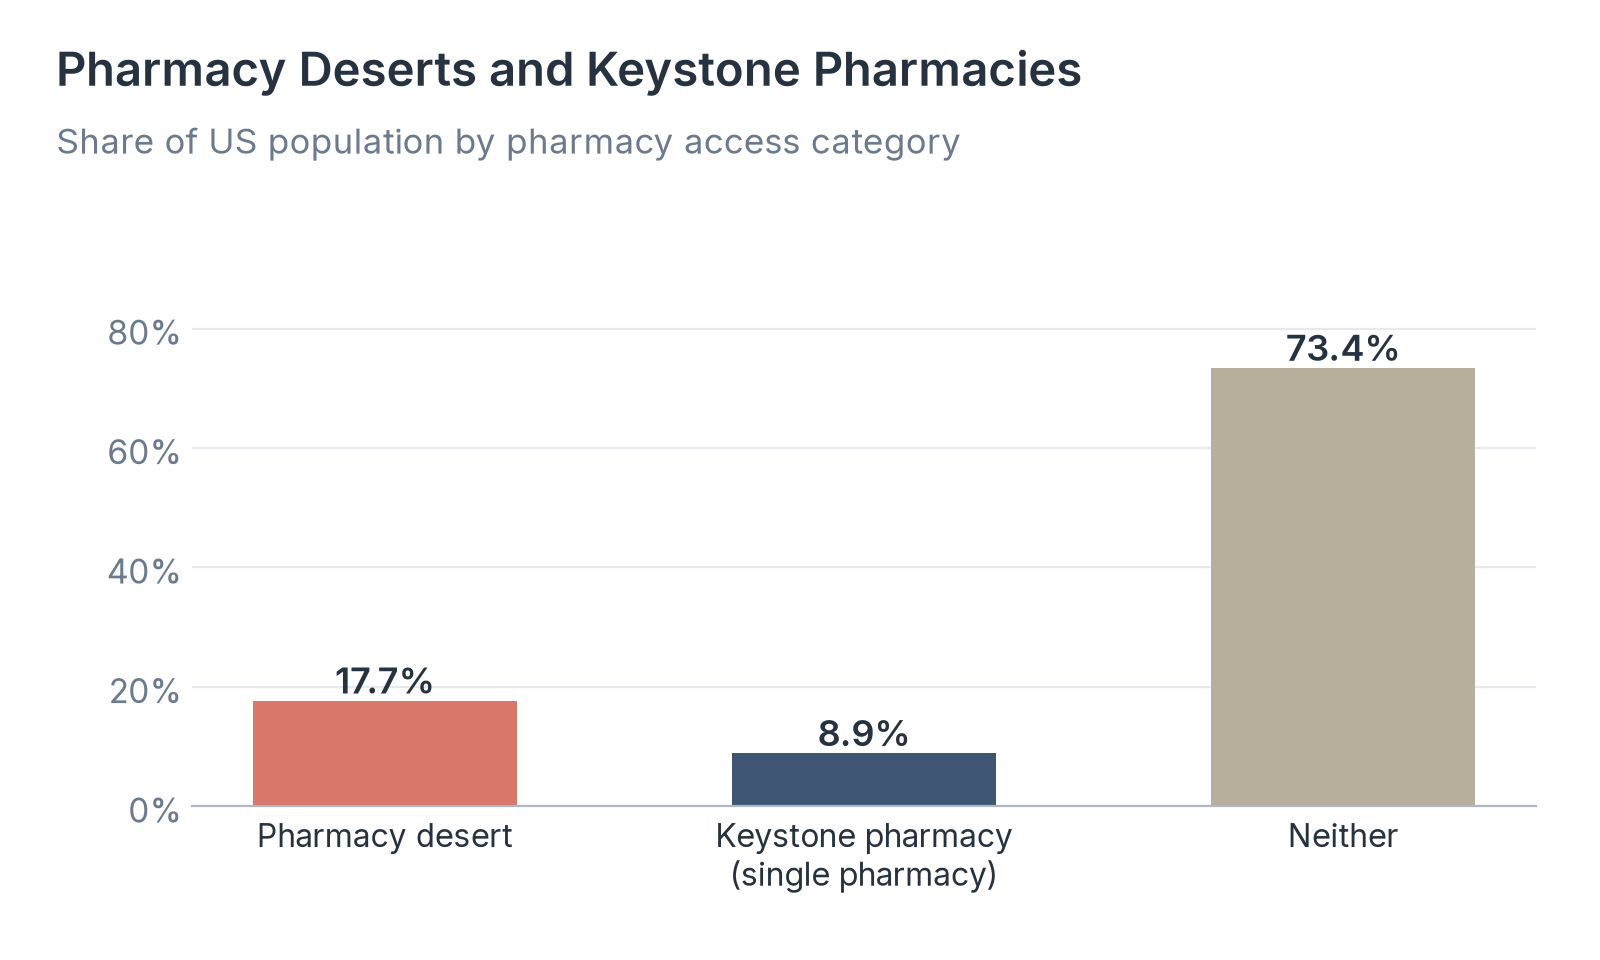
- 17.7% of Americans (57.1 million people) lived in a pharmacy desert, and another 8.9% (28.9 million) relied on a single keystone pharmacy.
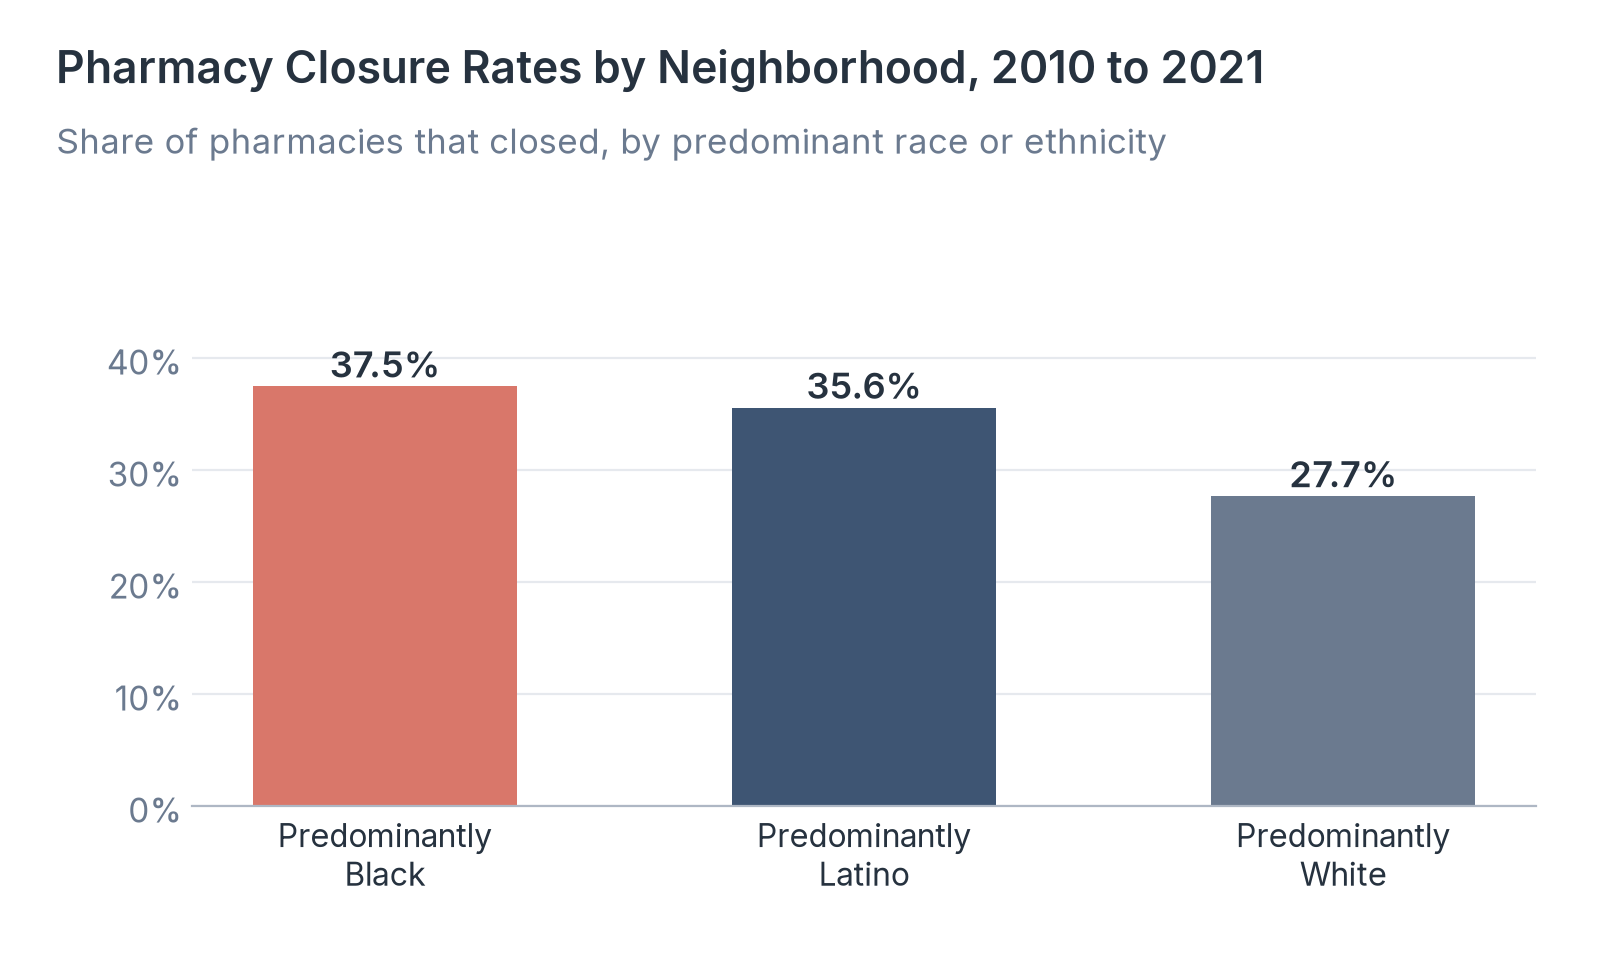
- Pharmacy closure rates from 2010 to 2021 were higher in predominantly Black (37.5%) and Latino (35.6%) neighborhoods than in predominantly White ones (27.7%).
- Nearly 1 in 3 US retail pharmacies closed between 2010 and 2021, and between 2018 and 2021 the number of pharmacies declined in 41 states.
When a neighborhood pharmacy closes, people lose a place to fill prescriptions, get vaccines, and ask a pharmacist about medicines. Closures have sped up in the past few years, and reporters covering care access keep asking how many pharmacies are closing each year, how often chains versus independents shut their doors, and how many people already live too far from a pharmacy. Those questions sit behind the yearly counts, desert estimates, and Part D access measures in this report.
Our analysts combined MedPAC's April 2026 analysis of National Council for Prescription Drug Programs pharmacy data for closures from 2021 through 2025 and for Part D beneficiaries living in ZIP codes with no retail pharmacy from 2018 through 2025. We matched those series with published pharmacy desert and keystone pharmacy estimates from Mathis, Berenbrok, and colleagues in JAMA Network Open (2025), the USC Schaeffer and UC Berkeley Health Affairs study of closures from 2010 to 2021, and the USC-NCPA pharmacy access mapping tool.
In the following sections, we compare closures and chain share by year, Part D ZIP codes without a pharmacy, pharmacy deserts and keystone pharmacies, closure rates by neighborhood race and ethnicity, and pharmacy ownership by urbanicity.
How Many Retail Pharmacies Closed From 2021 to 2025
Yearly closure counts show how fast the retail pharmacy market has been shrinking and whether chains or independents account for most of the exits. MedPAC's April 2026 presentation reports those counts from NCPDP pharmacy data.
| Year | Closures | Chain share of closures |
|---|---|---|
| 2021 | 1,764 | 25% |
| 2025 | 3,929 | 62% |
Source: Medicare Payment Advisory Commission, Preferred Networks and Pharmacy Access in Medicare Part D, April 9, 2026, analysis of National Council for Prescription Drug Programs pharmacy data.
Source: Healthcare Industry Reviews analysis of MedPAC NCPDP pharmacy closure figures, November 2026.
Key Findings
- Closures more than doubled from 1,764 in 2021 to 3,929 in 2025. MedPAC reports that rates rose across metropolitan, micropolitan, and rural areas, with higher rates in metropolitan and micropolitan ZIP codes.
- Chains drove the recent wave: their share of closures rose from 25% in 2021 to 62% in 2025, so most 2025 exits were chain sites, not independents.
- For Part D networks, pharmacy closures accounted for more of plan network exits than contract changes between 2022 and 2024, as the network exit rate rose from 3.7% to 8.1%.
| Year | Network exit rate | From pharmacy closures | From contract change |
|---|---|---|---|
| 2022 | 3.7% | 2.8% | 0.9% |
| 2023 | 4.7% | 3.1% | 1.5% |
| 2024 | 8.1% | 4.9% | 3.2% |
Source: Medicare Payment Advisory Commission, Preferred Networks and Pharmacy Access in Medicare Part D, April 9, 2026.
How Many Part D Beneficiaries Live in ZIP Codes Without a Pharmacy
ZIP codes with no retail pharmacy are an upper-bound measure of local access gaps. MedPAC tracks the share of Part D beneficiaries who live in those ZIP codes by urbanicity.
| Area type | ZIP code, 2018 | ZIP code, 2025 | County, 2018 | County, 2025 |
|---|---|---|---|---|
| All areas | 12% | 13% | <1% | <1% |
| Metropolitan | 9% | 10% | <1% | <1% |
| Micropolitan | 24% | 26% | <1% | <1% |
| Rural | 31% | 33% | <1% | 1% |
Source: Medicare Payment Advisory Commission, Preferred Networks and Pharmacy Access in Medicare Part D, April 9, 2026, analysis of NCPDP pharmacy data and CMS Part D enrollment data. Limited to ZIP codes with at least one Part D beneficiary.
Source: Healthcare Industry Reviews analysis of MedPAC Part D ZIP pharmacy access figures, November 2026.
Key Findings
- One in three rural Part D beneficiaries (33%) lived in a ZIP code with no retail pharmacy in 2025, up from 31% in 2018. The micropolitan share rose from 24% to 26%, and the metropolitan share from 9% to 10%.
- County-level measures show far fewer gaps: under 1% of beneficiaries lived in a county with no pharmacy in both years, except for a 1% rural county share in 2025. ZIP codes overstate local gaps when people routinely cross ZIP borders.
- The all-areas ZIP share moved only from 12% to 13% between 2018 and 2025, so the national rise is small while the rural gap remains large.
How Large Are Pharmacy Deserts and Keystone Pharmacy Gaps
Pharmacy deserts measure communities where travel time to a pharmacy exceeds a local supermarket benchmark. Keystone pharmacies are the single pharmacy whose closure would create a desert. Mathis, Berenbrok, and colleagues published national estimates for both in JAMA Network Open in 2025.
| Access category | People | Share of study population |
|---|---|---|
| Pharmacy desert | 57.1 million | 17.7% |
| Keystone pharmacy (single pharmacy) | 28.9 million | 8.9% |
| Neither | 237.5 million | 73.4% |
| Study population | 323.5 million | 100% |
Source: Mathis WS, Berenbrok LA, Kahn PA, et al. Vulnerability Index Approach to Identify Pharmacy Deserts and Keystone Pharmacies. JAMA Network Open. 2025;8(3):e250715. Figures as reported in Drug Topics (March 17, 2025) and Yale School of Medicine (April 11, 2025) coverage of the study, and as cited in PMC13119507.
Source: Healthcare Industry Reviews analysis of Mathis et al. pharmacy desert and keystone pharmacy estimates, November 2026.
Key Findings
- 57.1 million people (17.7%) lived in a pharmacy desert tract. Another 28.9 million (8.9%) depended on one keystone pharmacy, so about 26.6% of the study population either lacked convenient pharmacy access or was one closure away from that status.
- In 18 states, more than 20% of residents lived in pharmacy deserts, and in New Hampshire, South Dakota, West Virginia, Maine, and Vermont that share exceeded 25%.
- The USC-NCPA Pharmacy Access Initiative map reports that 1 in 8 US neighborhoods lack convenient access to pharmacy services, with the gap most pronounced in rural and underserved urban communities.
Which Neighborhoods Lost Pharmacies Fastest From 2010 to 2021
Longer-run closure studies show which communities absorbed the most exits before the recent chain wave. Guadamuz, Alexander, Kanter, and Qato tracked retail pharmacies from 2010 through 2021 in Health Affairs.
| Neighborhood type | Share of pharmacies that closed |
|---|---|
| Predominantly Black | 37.5% |
| Predominantly Latino | 35.6% |
| Predominantly White | 27.7% |
Source: Guadamuz JS, Alexander GC, Kanter GP, Qato DM. More US Pharmacies Closed Than Opened in 2018-21; Independent Pharmacies, Those in Black, Latinx Communities Most at Risk. Health Affairs. 2024;43:1703-1711, as summarized by USC Schaeffer, December 3, 2024.
Source: Healthcare Industry Reviews analysis of Guadamuz et al. / USC Schaeffer pharmacy closure rates, November 2026.
| Ownership type | Share that closed |
|---|---|
| Independent pharmacies | 38.9% |
| Chain pharmacies | 21.9% |
Source: Guadamuz et al., Health Affairs 2024, as cited in PMC13119507.
Key Findings
- Nearly 1 in 3 retail pharmacies (29.4%) closed between 2010 and 2021. From 2018 to 2021, pharmacies declined in 41 states, the first multi-year net loss since at least 2010, and nearly one-third of counties saw a net decline affecting 91.6 million people.
- Independent pharmacies closed at 38.9%, versus 21.9% for chains, over 2010 to 2021. That earlier pattern differs from MedPAC's 2025 finding that chains accounted for most new closures.
- Boston University researchers reporting in JAMA Network Open in 2026 found that predominantly White neighborhoods still had about 15% more pharmacies per 10,000 people than other racial and ethnic neighborhoods before and after the COVID-19 pandemic.
How Pharmacy Ownership Differs by Urbanicity in 2025
Ownership mix shapes who is left when pharmacies close. MedPAC reports average ownership shares across ZIP codes by metropolitan, micropolitan, and rural status for 2025.
| Urbanicity | Independent | Chain | Other |
|---|---|---|---|
| Metropolitan | 39% | 59% | 2% |
| Micropolitan | 45% | 52% | 3% |
| Rural | 62% | 35% | 3% |
Source: Medicare Payment Advisory Commission, Preferred Networks and Pharmacy Access in Medicare Part D, April 9, 2026, analysis of NCPDP pharmacy data. Urbanicity based on Office of Management and Budget core-based statistical areas.
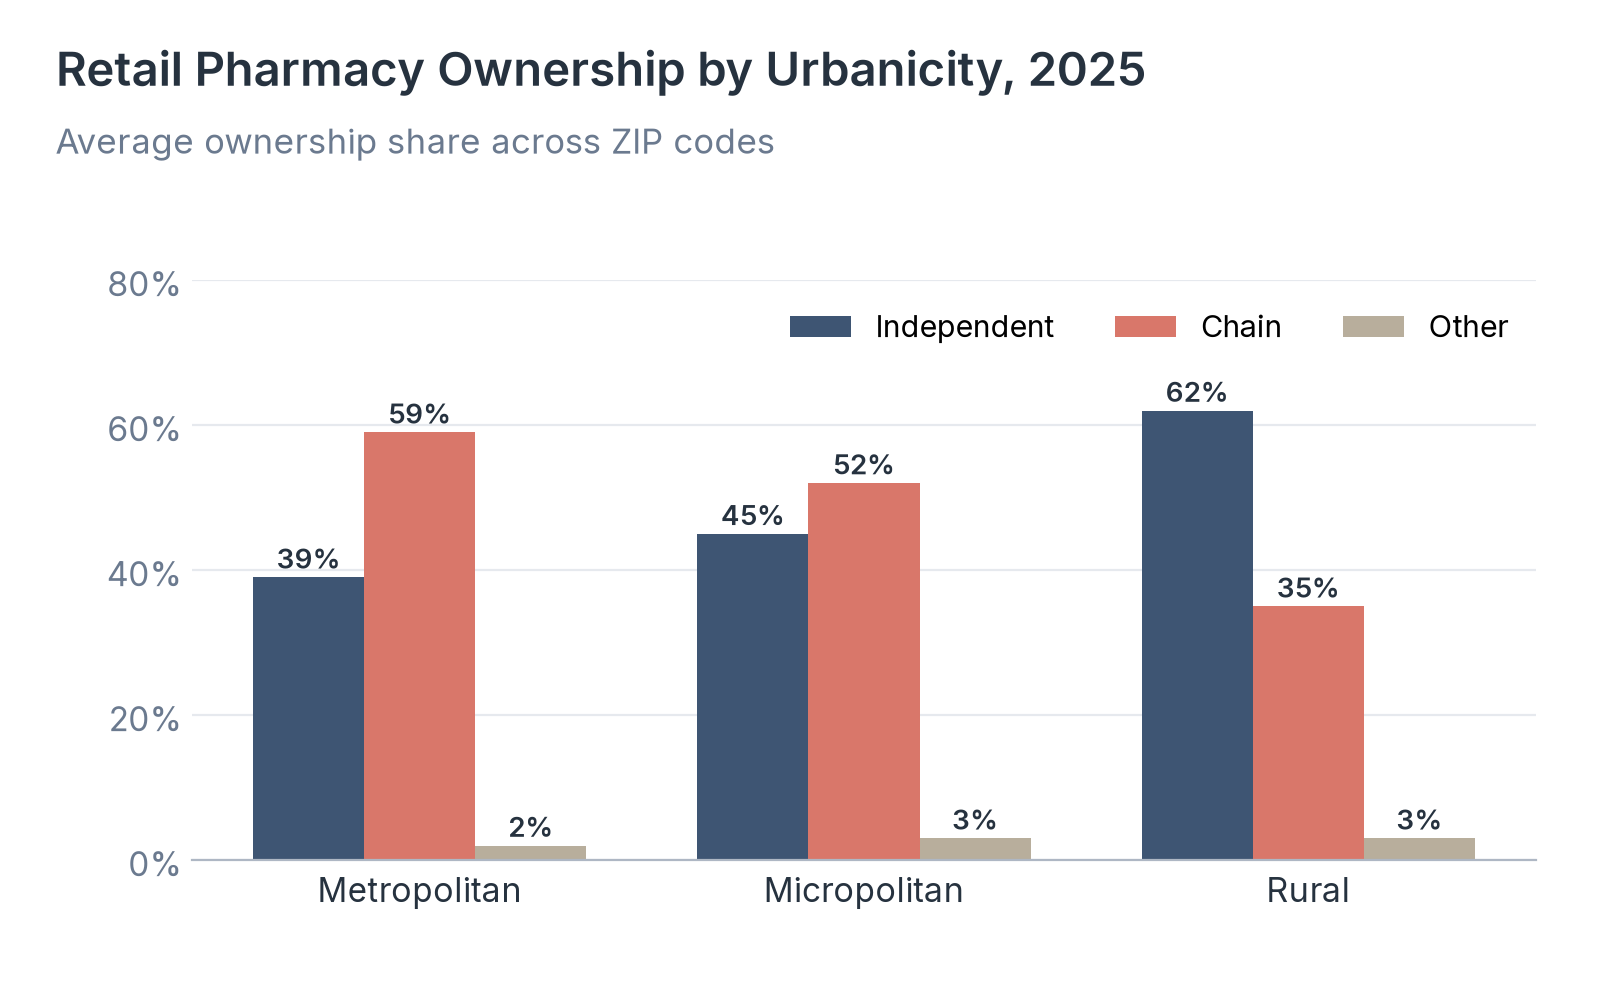
Source: Healthcare Industry Reviews analysis of MedPAC NCPDP ownership shares by urbanicity, November 2026.
Key Findings
- Rural ZIP codes remain independent-majority, with an average 62% independent share and 35% chain share. Metropolitan ZIP codes reverse that pattern, at 59% chain and 39% independent.
- Mathis et al. found independently owned pharmacies were more likely than chains to serve as keystone pharmacies, and the most rural settings relied on keystones disproportionately.
- Because rural areas lean on independents while recent closures are mostly chains, the access effects of each ownership wave differ by place: chain exits hit denser markets hardest in the MedPAC counts, while independent exits still matter most where a single pharmacy is the only local option.
What Pharmacy Closure Statistics Show for 2026
Retail pharmacy closures more than doubled from 2021 to 2025, and chains now account for most of those exits. At the same time, about 86 million people already live in a pharmacy desert or depend on one keystone pharmacy, and rural Part D beneficiaries remain far more likely than urban ones to live in a ZIP code with no pharmacy at all.
So if you are reporting on pharmacy access, cite the MedPAC closure and Part D ZIP figures for the current pace of exits, the Mathis et al. desert and keystone shares for how many people already lack a convenient pharmacy, and the Guadamuz et al. neighborhood rates for which communities absorbed the earlier wave of closures.
Data Collection and Methodology
Closure counts, chain shares, Part D ZIP and county access shares, network exit rates, and 2025 ownership shares by urbanicity come from MedPAC's April 9, 2026 presentation Preferred Networks and Pharmacy Access in Medicare Part D, which analyzes National Council for Prescription Drug Programs pharmacy data and CMS Part D enrollment data. We opened the PDF on November 6, 2026. MedPAC reports 2021 and 2025 closure endpoints, not a full yearly series, in that deck, so those are the years shown.
Pharmacy desert (17.7%, 57.1 million) and keystone pharmacy (8.9%, 28.9 million) figures are from Mathis, Berenbrok, Kahn, and colleagues, JAMA Network Open 2025;8(3):e250715, as reported in Drug Topics (March 17, 2025) and Yale School of Medicine (April 11, 2025) and as cited in PMC13119507. The study population is 323.5 million. The "Neither" row is the remainder. Neighborhood closure rates and the 2010 to 2021 independent versus chain closure shares are from Guadamuz et al., Health Affairs 2024, as summarized by USC Schaeffer (December 3, 2024) and cited in PMC13119507. The 1-in-8 neighborhood figure is from the USC-NCPA Pharmacy Access Initiative announcement (June 5, 2026). Boston University neighborhood pharmacy density findings are from the university's October 2026 summary of its JAMA Network Open study.
We calculated products, differences, and ratios from the published values. Shares labeled estimated use published numerators and denominators.
Sources
- Healthcare Industry Reviews, Pharmacy Closure Study: analysis of MedPAC NCPDP retail pharmacy closure and Part D ZIP access series, Mathis et al. pharmacy desert and keystone estimates, and Guadamuz et al. neighborhood closure rates, conducted November 2026.
- Medicare Payment Advisory Commission. Preferred Networks and Pharmacy Access in Medicare Part D. April 9, 2026.
- Mathis WS, Berenbrok LA, Kahn PA, et al. Vulnerability Index Approach to Identify Pharmacy Deserts and Keystone Pharmacies. JAMA Network Open. 2025;8(3):e250715.
- USC Schaeffer. Nearly 1 in 3 Retail Pharmacies Have Closed Since 2010, Widening Health Disparities. December 3, 2024 (summarizing Guadamuz et al., Health Affairs 2024).
- PMC13119507 (citing Mathis et al. desert and keystone figures and Guadamuz et al. independent versus chain closure rates).
- National Community Pharmacists Association. Mapping Pharmacy Deserts Across the Country. June 5, 2026.
- Yale School of Medicine. A New Metric to Identify and Prevent Pharmacy Deserts. April 11, 2025.
- Drug Topics. Travel Time Thresholds, Vulnerability Index Provide Pharmacy Access Insights. March 17, 2025.
- Boston University School of Public Health. US Pharmacy Closures Are Hitting Racial Minority Communities the Hardest. 2026.