Physician Practice Ownership Statistics: 2026 Report
Published
Our analysts reviewed Physicians Advocacy Institute and Avalere Health counts of US physician employment and practice ownership from January 2018 through January 1, 2026 and compared them with the American Medical Association's Physician Practice Benchmark Survey results through 2024. The figures show how far physician employment and corporate practice ownership have moved, which specialties still stay in private practice and how rural markets compare as of Q4 2026.
Key Findings
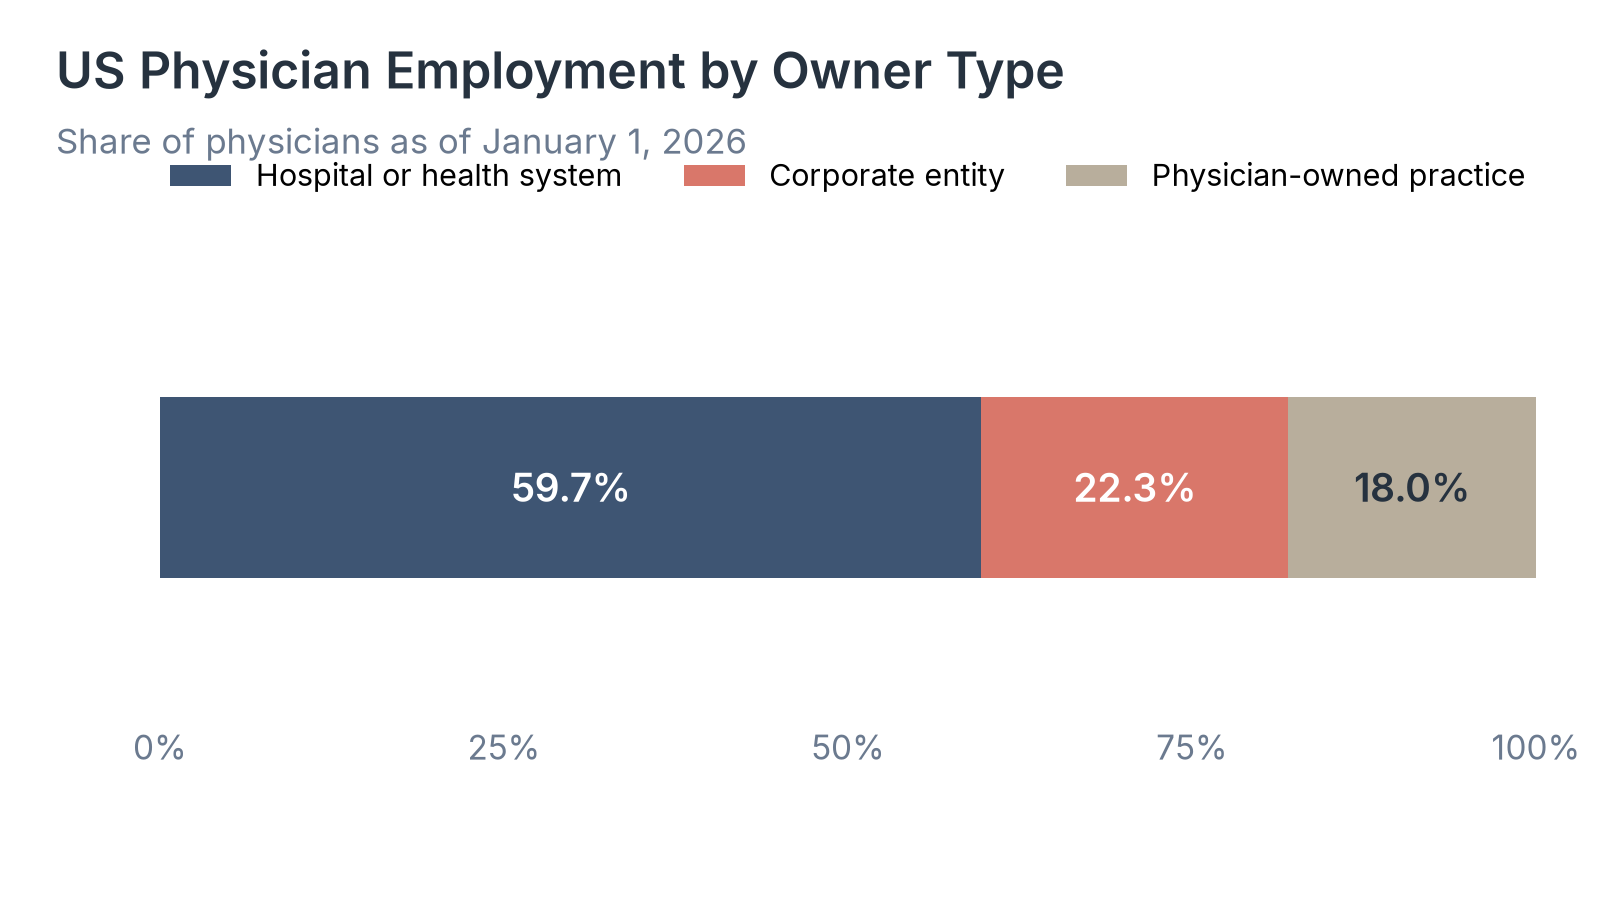
- 82.0% of US physicians were employed by hospitals or corporate entities as of January 1, 2026, leaving 18% in physician-owned settings.
- 59.7% of physicians were employed by hospitals and 22.3% by corporate entities such as private equity firms, insurers and large pharmacy chains.
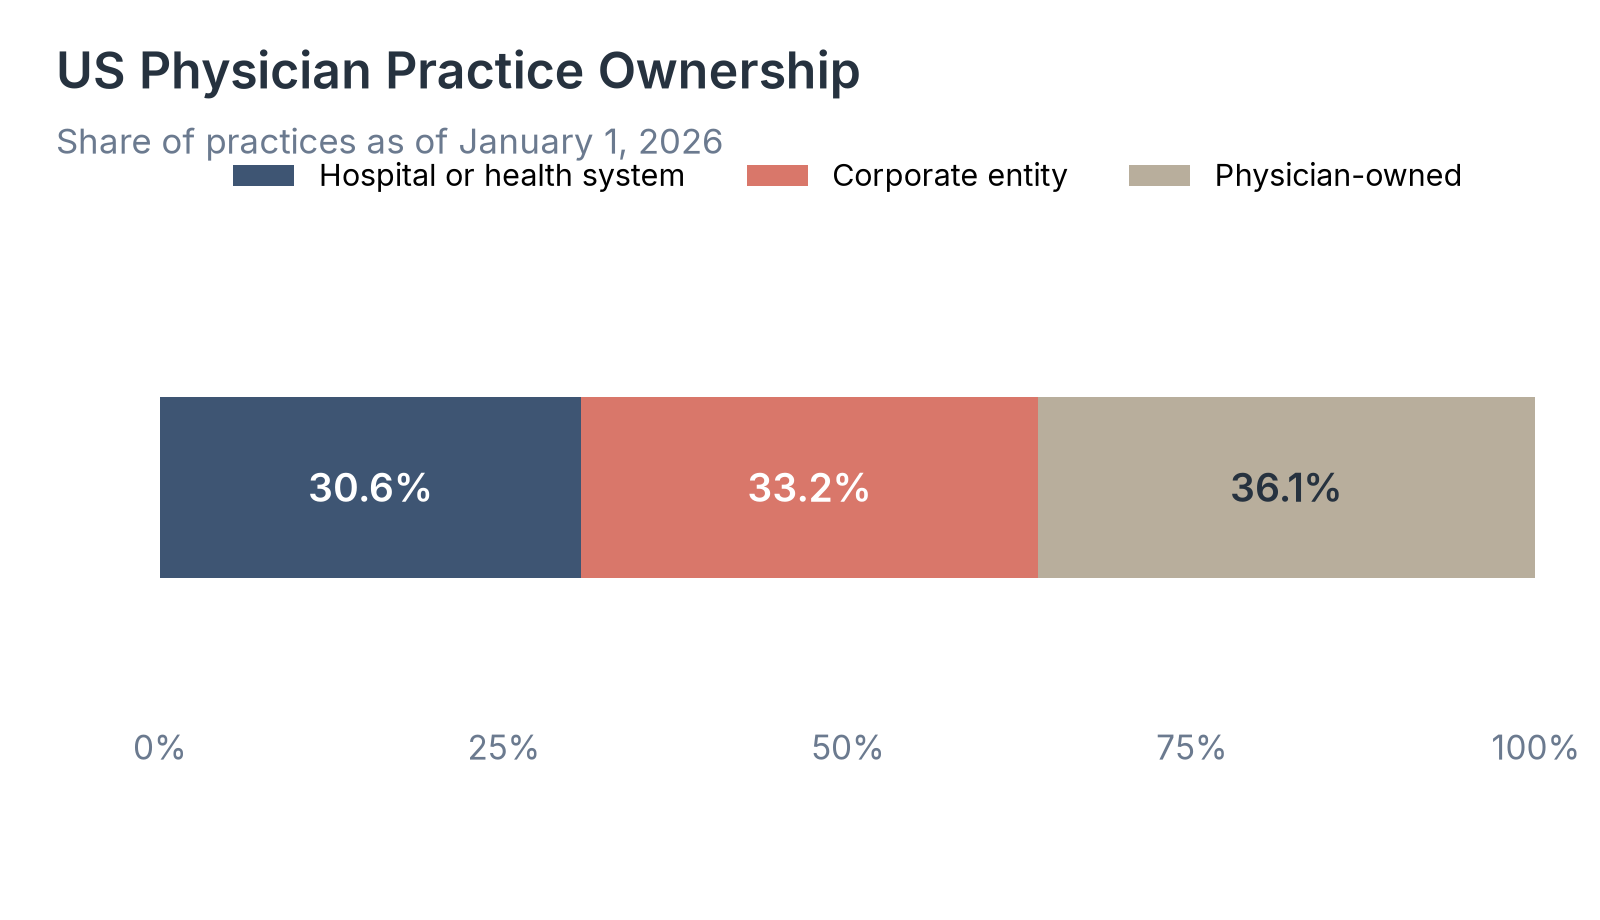
- 63.9% of physician practices were owned by hospitals or corporate entities as of January 1, 2026, with corporate ownership (33.2%) ahead of hospital ownership (30.6%).
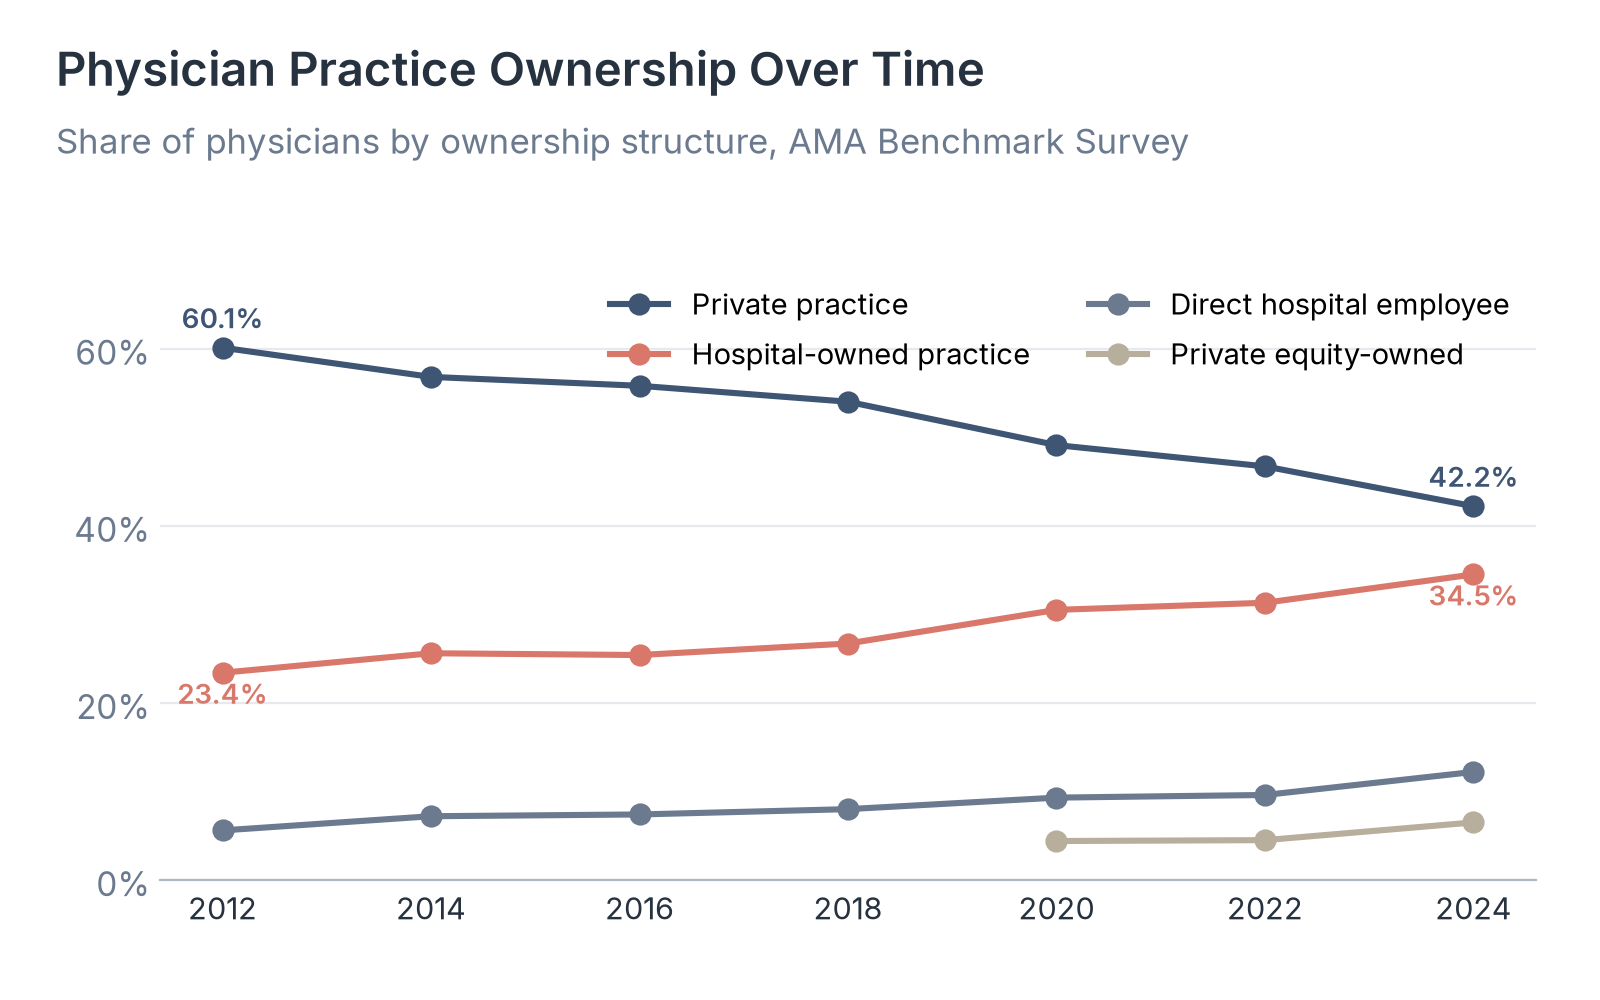
- In the AMA's 2024 Benchmark Survey, 42.2% of physicians worked in wholly physician-owned private practices, down from 60.1% in 2012.
- 253,000 additional physicians became employees of hospitals or corporate entities between January 2018 and January 2026, including 48,100 from 2024 to 2026.
Physician practice ownership shapes who sets schedules, who negotiates with insurers and who decides how a clinic grows. For most of the last century, most US doctors worked in practices owned by physicians. That pattern has reversed. Hospitals, health systems, private equity firms, insurers and other corporate buyers now employ most physicians and own most practices, which changes how medical groups buy software, recruit staff and contract for services.
Our analysts used the PAI-Avalere series built from the IQVIA OneKey database, covering physician and practice ownership from January 2018 through January 1, 2026. For longer survey trends by specialty, practice size and employment status, we used the AMA's biennial Physician Practice Benchmark Survey through 2024, reported in its 2025 Policy Research Perspective.
In the following sections, we compare physician employment by owner type, practice ownership, the AMA ownership trend since 2012, private practice shares by specialty and rural versus national employment.
Physician Employment by Owner Type
PAI and Avalere count a physician as employed when a hospital, health system or other corporate entity is the employer. Corporate entities in this series include private equity firms, health insurers and large pharmacy chains.
| Owner type | Share of physicians |
|---|---|
| Hospital or health system | 59.7% |
| Corporate entity | 22.3% |
| Physician-owned practice (independent) | 18.0% |
| Employed by hospital or corporate entity (total) | 82.0% |
Source: Physicians Advocacy Institute and Avalere Health, Physician Employment Trends and Practice Acquisitions: 2018-2026, as of January 1, 2026.
Source: Physicians Advocacy Institute and Avalere Health, Physician Employment Trends and Practice Acquisitions: 2018-2026, as of January 1, 2026.
Key Findings
- More than four in five physicians (82.0%) worked for a hospital or corporate entity as of January 1, 2026. Hospitals alone employed 59.7%.
- Corporate employment reached 22.3%. PAI notes that corporate physician employment leveled off in 2023 to 2025 before hitting a new peak in 2026.
- 253,000 additional physicians became hospital or corporate employees from 2018 to 2026, while 152,200 fewer physicians practiced independently. From 2024 to 2026 alone, employment grew by 48,100 physicians (5.6%).
Physician Practice Ownership
Employment and practice ownership are related but not identical. A hospital can employ physicians without owning every practice site, and corporate buyers can own practices while shedding some employed physicians after an acquisition.
| Owner type | Share of practices |
|---|---|
| Corporate entity | 33.2% |
| Hospital or health system | 30.6% |
| Physician-owned | 36.1% |
| Hospital or corporate entity (total) | 63.9% |
Source: Physicians Advocacy Institute and Avalere Health, Physician Employment Trends and Practice Acquisitions: 2018-2026, as of January 1, 2026.
| Measure | 2018 to 2026 | 2024 to 2026 |
|---|---|---|
| Additional practices acquired by hospitals or corporate entities | 85,000 | 13,900 |
| Acquired by hospitals | 32,800 | 5,800 |
| Acquired by corporate entities | 52,300 | 8,000 |
| Fewer physician-owned practices | 81,100 | 12,500 |
Source: Physicians Advocacy Institute and Avalere Health, Physician Employment Trends and Practice Acquisitions: 2018-2026, as of January 1, 2026.
Source: Physicians Advocacy Institute and Avalere Health, Physician Employment Trends and Practice Acquisitions: 2018-2026, as of January 1, 2026.
Key Findings
- Hospitals and corporate entities owned 63.9% of physician practices as of January 1, 2026. Corporate ownership (33.2%) surpassed hospital ownership (30.6%).
- Of the 13,900 practices acquired from 2024 to 2026, 8,000 went to corporate buyers (a 10.2% increase in corporate practice ownership) and 5,800 to hospitals (a 7.8% increase).
- PAI's press release notes that corporate practice ownership grew faster than corporate physician employment (0.9%) over the same two years, which raises the question of whether some corporate owners reduced physician headcount after buying practices.
AMA Private Practice Trend, 2012 to 2024
The AMA Benchmark Survey asks physicians about the ownership of their main practice. It is a sample survey, not a full census, so its private-practice share is not identical to PAI's independent share, but it is the main source for change since 2012 and for specialty detail.
| Year | Private practice | Hospital-owned practice | Private equity-owned | Direct hospital employee or contractor | Other |
|---|---|---|---|---|---|
| 2012 | 60.1% | 23.4% | n/a | 5.6% | 10.9% |
| 2014 | 56.8% | 25.6% | n/a | 7.2% | 10.3% |
| 2016 | 55.8% | 25.4% | n/a | 7.4% | 11.4% |
| 2018 | 54.0% | 26.7% | n/a | 8.0% | 11.2% |
| 2020 | 49.1% | 30.5% | 4.4% | 9.3% | 6.8% |
| 2022 | 46.7% | 31.3% | 4.5% | 9.6% | 7.9% |
| 2024 | 42.2% | 34.5% | 6.5% | 12.2% | 4.6% |
Source: American Medical Association, Physician Practice Characteristics in 2024: Private Practices Account for Less Than Half of Physicians in Most Specialties, Policy Research Perspective, 2025 (2024 Benchmark Survey).
Source: American Medical Association, Physician Practice Characteristics in 2024: Private Practices Account for Less Than Half of Physicians in Most Specialties, Policy Research Perspective, 2025 (2024 Benchmark Survey).
Key Findings
- Private practice fell from 60.1% of physicians in 2012 to 42.2% in 2024, an 18 percentage-point drop. Hospital-owned practices rose from 23.4% to 34.5%.
- Direct hospital employment doubled from 5.6% in 2012 to 12.2% in 2024. Private equity ownership, first reported separately in 2020, rose from about 4.5% in 2020 and 2022 to 6.5% in 2024.
- Only 35.4% of physicians had an ownership stake in their practice in 2024, down from 53.2% in 2012. Employees made up 57.5% of physicians in 2024, up from 41.8% in 2012.
Private Practice Shares by Specialty
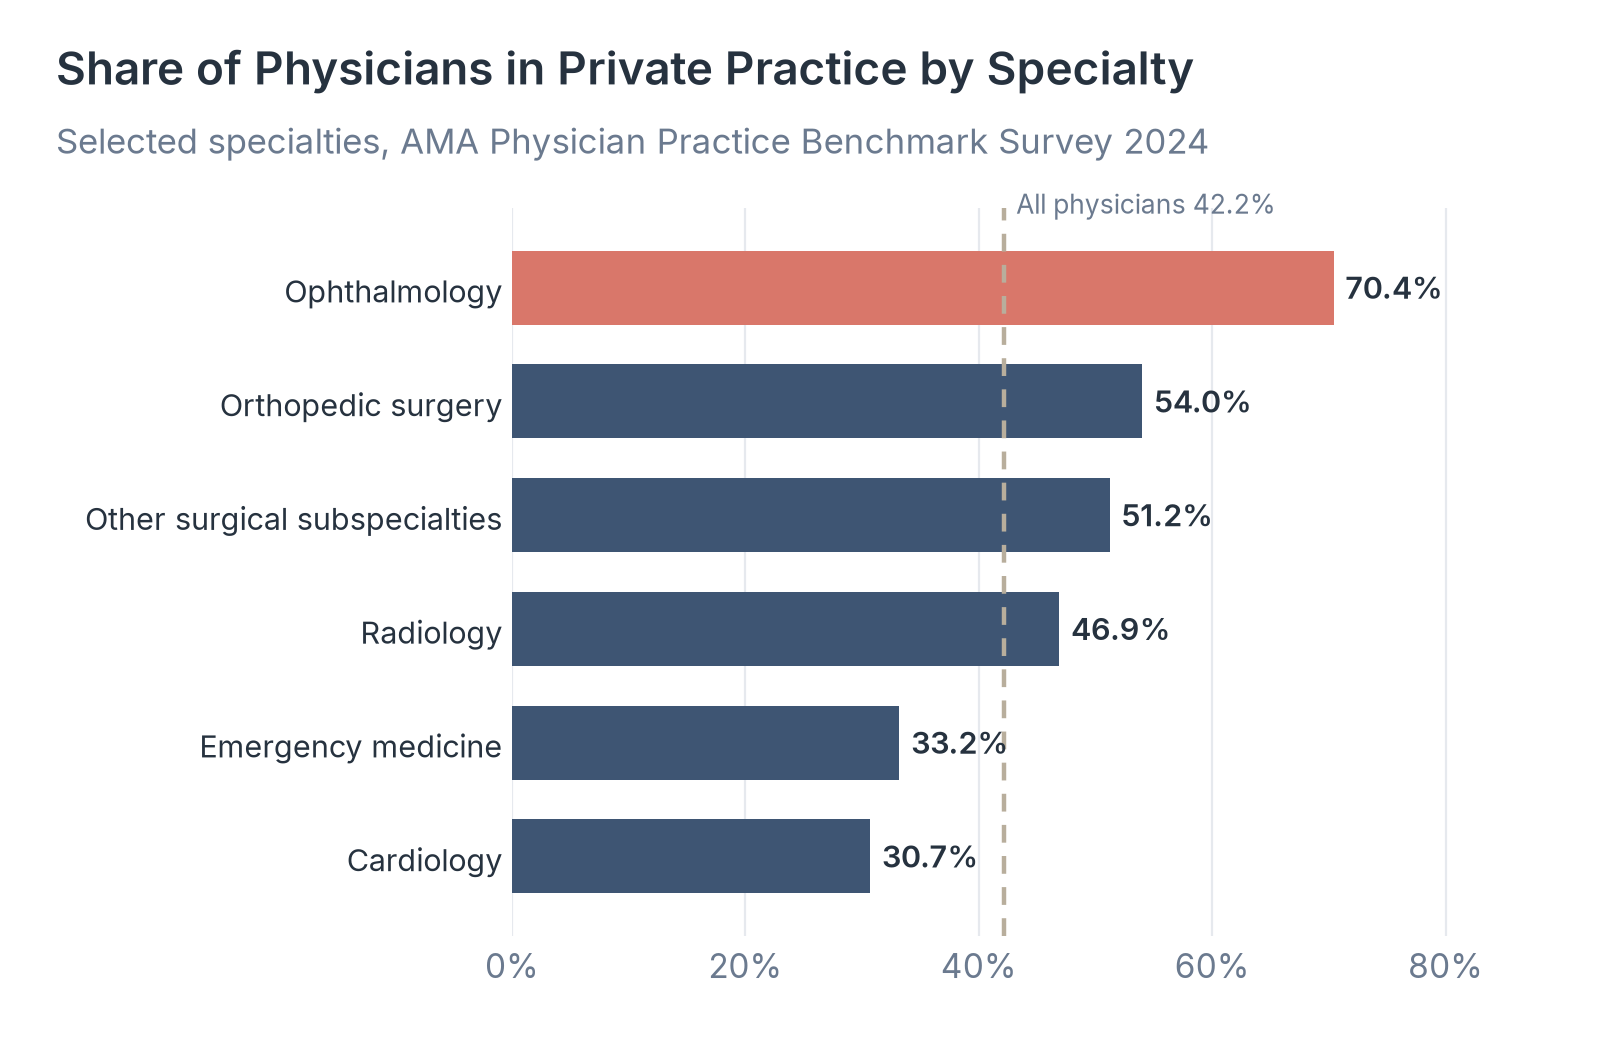
The national private-practice average of 42.2% hides wide specialty differences. Surgical fields remain more likely to stay physician-owned; hospital-based and cardiology fields are far lower.
| Specialty | Share in private practice |
|---|---|
| Ophthalmology | 70.4% |
| Orthopedic surgery | 54.0% |
| Other surgical subspecialties | 51.2% |
| Radiology | 46.9% |
| Emergency medicine | 33.2% |
| Cardiology | 30.7% |
| All physicians (Benchmark Survey) | 42.2% |
Source: American Medical Association, Physician Practice Characteristics in 2024: Private Practices Account for Less Than Half of Physicians in Most Specialties, Policy Research Perspective, 2025 (2024 Benchmark Survey). AMA press release, May 29, 2025.
Source: American Medical Association, Physician Practice Characteristics in 2024: Private Practices Account for Less Than Half of Physicians in Most Specialties, Policy Research Perspective, 2025 (2024 Benchmark Survey). AMA press release, May 29, 2025.
Key Findings
- Ophthalmology had the highest private-practice share at 70.4%, followed by orthopedic surgery at 54.0% and other surgical subspecialties at 51.2%.
- Radiology stood at 46.9%. Emergency medicine (33.2%) and cardiology (30.7%) were among the specialties furthest below the national private-practice average.
- Among physicians who sold a practice in the prior decade, the top reasons rated important or very important were inadequate payment rates (70.8%), access to costly resources (64.9%) and managing payer regulatory and administrative requirements (63.6%).
Rural Physician Employment and Practice Ownership
Rural markets often have fewer buyers, so ownership shifts there affect access as well as employment. PAI reports rural figures alongside the national totals for January 1, 2026.
| Measure | National | Rural |
|---|---|---|
| Physicians employed by hospitals or corporate entities | 82.0% | 80.2% |
| Hospital-employed physicians | 59.7% | 62.4% |
| Corporate-employed physicians | 22.3% | 17.8% |
| Practices owned by hospitals or corporate entities | 63.9% | 67.8% |
| Hospital-owned practices | 30.6% | 42.1% |
| Corporate-owned practices | 33.2% | 25.7% |
Source: Physicians Advocacy Institute and Avalere Health, Physician Employment Trends and Practice Acquisitions: 2018-2026, as of January 1, 2026.
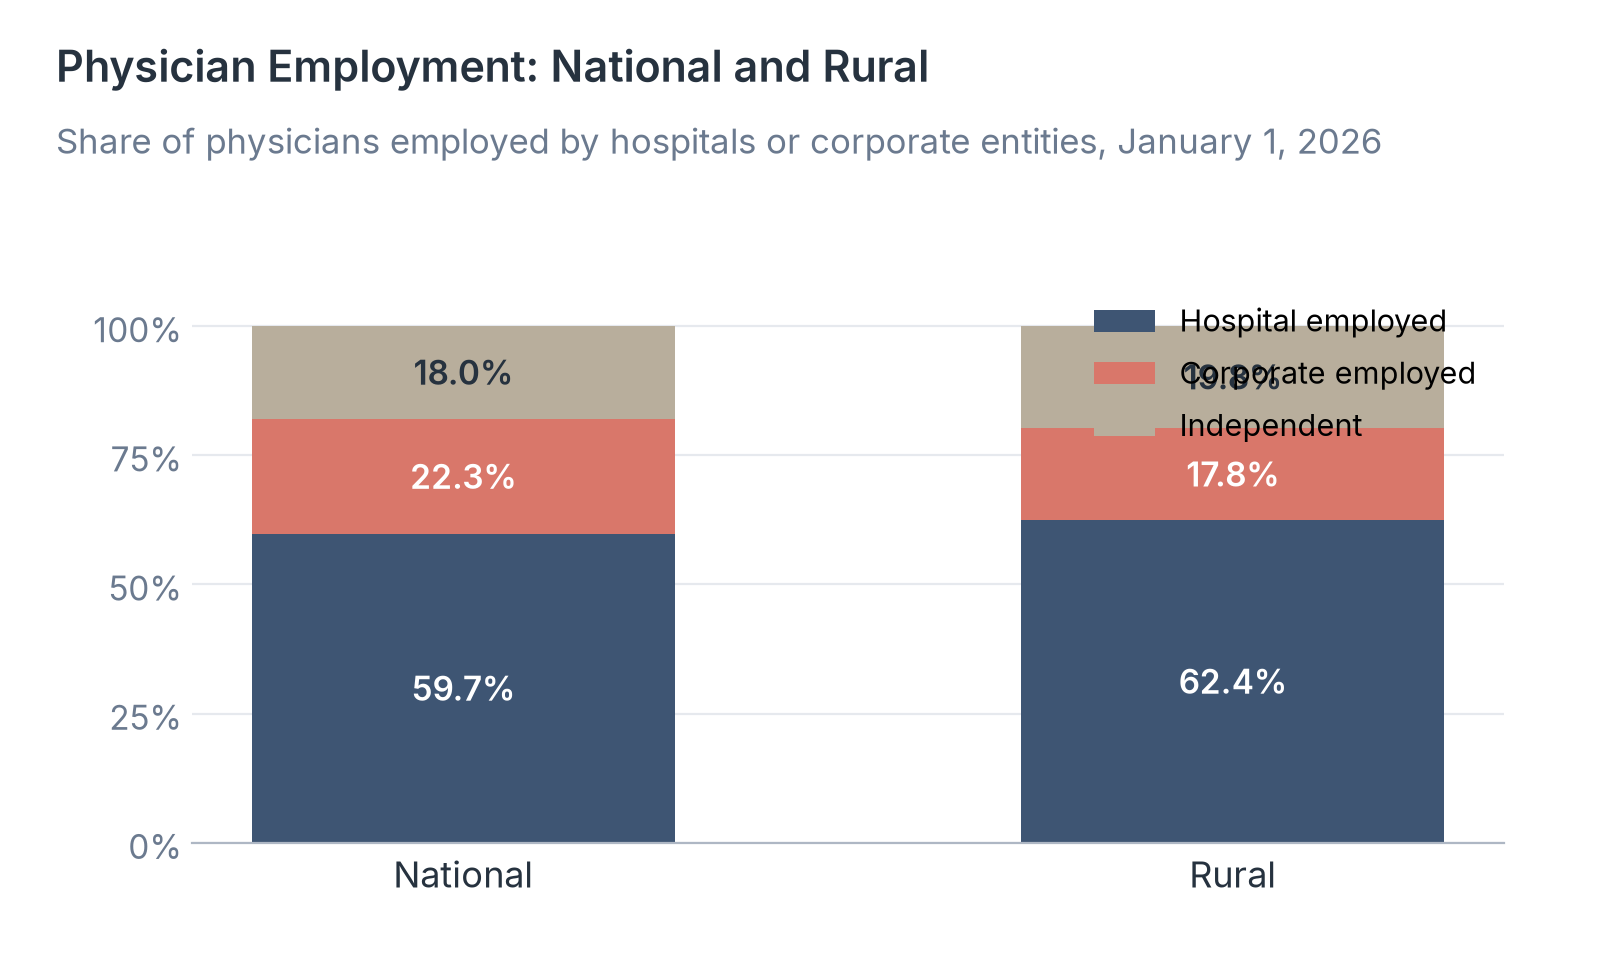
Source: Physicians Advocacy Institute and Avalere Health, Physician Employment Trends and Practice Acquisitions: 2018-2026, as of January 1, 2026.
Key Findings
- Rural physician employment (80.2%) and non-physician practice ownership (67.8%) tracked the national pattern. Rural hospital employment was 62.4% and rural corporate employment 17.8%.
- From 2024 to 2026, the share of employed physicians in rural areas grew 6.8% and the share of non-physician-owned rural practices grew 9.8%.
- Across the full 2018 to 2026 period, growth in non-independent physicians ranged from 66.1% in the Midwest to 106.7% in the South. Growth in non-physician-owned practices ranged from 86.4% in the Midwest to 140.2% in the South.
What Physician Practice Ownership Statistics Show for 2026
Independent physician practice is now the minority model. PAI's January 2026 counts put hospital and corporate employment at 82% of physicians and hospital and corporate ownership at 64% of practices. The AMA survey shows the same long slide in private practice since 2012, with ophthalmology and some surgical fields as the main holdouts.
So if you sell to medical groups, recruit physicians or underwrite practice acquisitions, treat hospital-employed and corporate-employed physicians as the default US buyer and use specialty and rural splits when a market still has a large private-practice share.
Data Collection and Methodology
PAI-Avalere figures come from the Physicians Advocacy Institute report on physician employment trends and practice acquisitions for 2018 to 2026, built by Avalere Health from the IQVIA OneKey database of physician and practice locations. The series covers solo and small single-location practices as well as large multispecialty groups. We opened the PAI research page and press release on November 5, 2026. Percentages are as of January 1 of the stated year. Physician-owned practice share is 100% minus the reported hospital-or-corporate employment or ownership share.
AMA figures come from the 2024 Physician Practice Benchmark Survey, reported in the 2025 Policy Research Perspective on physician practice characteristics. The survey is a nationally representative sample of post-residency physicians who provide patient care at least 20 hours a week, are not federally employed and practice in a US state or the District of Columbia. The 2024 sample size was 5,000 physicians. Private practice means a practice wholly owned by physicians. Specialty private-practice shares cited here are those listed in the AMA report and the May 29, 2025 AMA press release.
We calculated products, differences and ratios from the published values.
Sources
- Healthcare Industry Reviews, Physician Practice Ownership Study: analysis of PAI-Avalere physician employment and practice ownership figures for January 2018 through January 1, 2026 and AMA Physician Practice Benchmark Survey results for 2012 to 2024, conducted November 2026.
- Physicians Advocacy Institute and Avalere Health. Physician Employment Trends and Practice Acquisitions: 2018-2026.
- Physicians Advocacy Institute. Report: Fewer Than One-Fifth of U.S. Physicians Are Employed by a Physician-Owned Practice.
- American Medical Association. Physician Practice Characteristics in 2024: Private Practices Account for Less Than Half of Physicians in Most Specialties. Policy Research Perspective.
- American Medical Association. More physicians move to practices owned by hospitals and private equity groups. May 29, 2025.