Physician Shortage Statistics: 2026 Report
Published
Our analysts matched the 8,830 primary care shortage areas the federal government had designated as of September 30, 2026 against 2025 population estimates for every state, and compared the results with the latest physician supply and demand projections from the Health Resources and Services Administration (HRSA) and the Association of American Medical Colleges (AAMC). The figures show how large the projected physician shortage is, which specialties and places it affects most, and how many people already live in areas without enough primary care as of Q4 2026.
Key Findings
- HRSA projects a shortage of 141,160 full-time equivalent (FTE) physicians in the US in 2038, with supply meeting 88% of demand.
- 30 of 35 physician specialties are projected to be short in 2038. Vascular surgery has the lowest projected adequacy at 66%, and emergency medicine the highest at 116%.
- 102,257,076 people lived in designated primary care shortage areas as of September 30, 2026, and 17,675 more primary care practitioners would be needed to remove those designations.
- Washington had the highest share of residents in primary care shortage areas at 69.7%, and Pennsylvania the lowest at 5.1%.
- The AAMC projects a shortage of 13,500 to 86,000 physicians by 2036, including 20,200 to 40,400 in primary care.
A physician shortage means patients wait longer for appointments, travel farther for specialists, and in some places go without a regular doctor. The US population is getting older, and older patients use more care: the AAMC projects that the population aged 65 and over will grow 34.1% between 2021 and 2036. At the same time, many physicians are close to retirement, with 17% of active physicians aged 65 or older and another 25% aged 55 to 64 in 2021, according to the AAMC. Hospitals, medical groups, and the companies that sell them recruiting, telehealth, and scheduling tools all plan around these numbers.
Our analysts used two kinds of data. For projections, we used HRSA's National Center for Health Workforce Analysis physician projections for 2023 to 2038, published in December 2025, and the AAMC's projections for 2021 to 2036, published in March 2024. For the shortage that exists now, we used HRSA's count of designated Health Professional Shortage Areas (HPSAs) as of September 30, 2026 and divided each state's HPSA population by its 2025 Census Bureau population estimate.
In the following sections, we compare projected physician supply and demand, projected adequacy by specialty, primary care shortage areas by type and rurality, shortage areas in every state, and the AAMC's range of shortage estimates.
Projected Physician Supply and Demand in the US
HRSA's projections are the federal government's main estimate of the physician workforce. They count physicians in full-time equivalents of 40 hours a week and compare the supply expected from training and retirement patterns with the demand expected from population growth and aging.
| Year | Supply (FTE) | Demand (FTE) | Shortage (FTE) | Supply as share of demand |
|---|---|---|---|---|
| 2028 | 963,840 | 1,077,220 | 113,380 | 89% |
| 2033 | 980,670 | 1,119,080 | 138,410 | 88% |
| 2038 | 1,010,060 | 1,151,220 | 141,160 | 88% |
Source: Health Resources and Services Administration, National Center for Health Workforce Analysis, Physician Workforce: Projections, 2023-2038, December 2025.
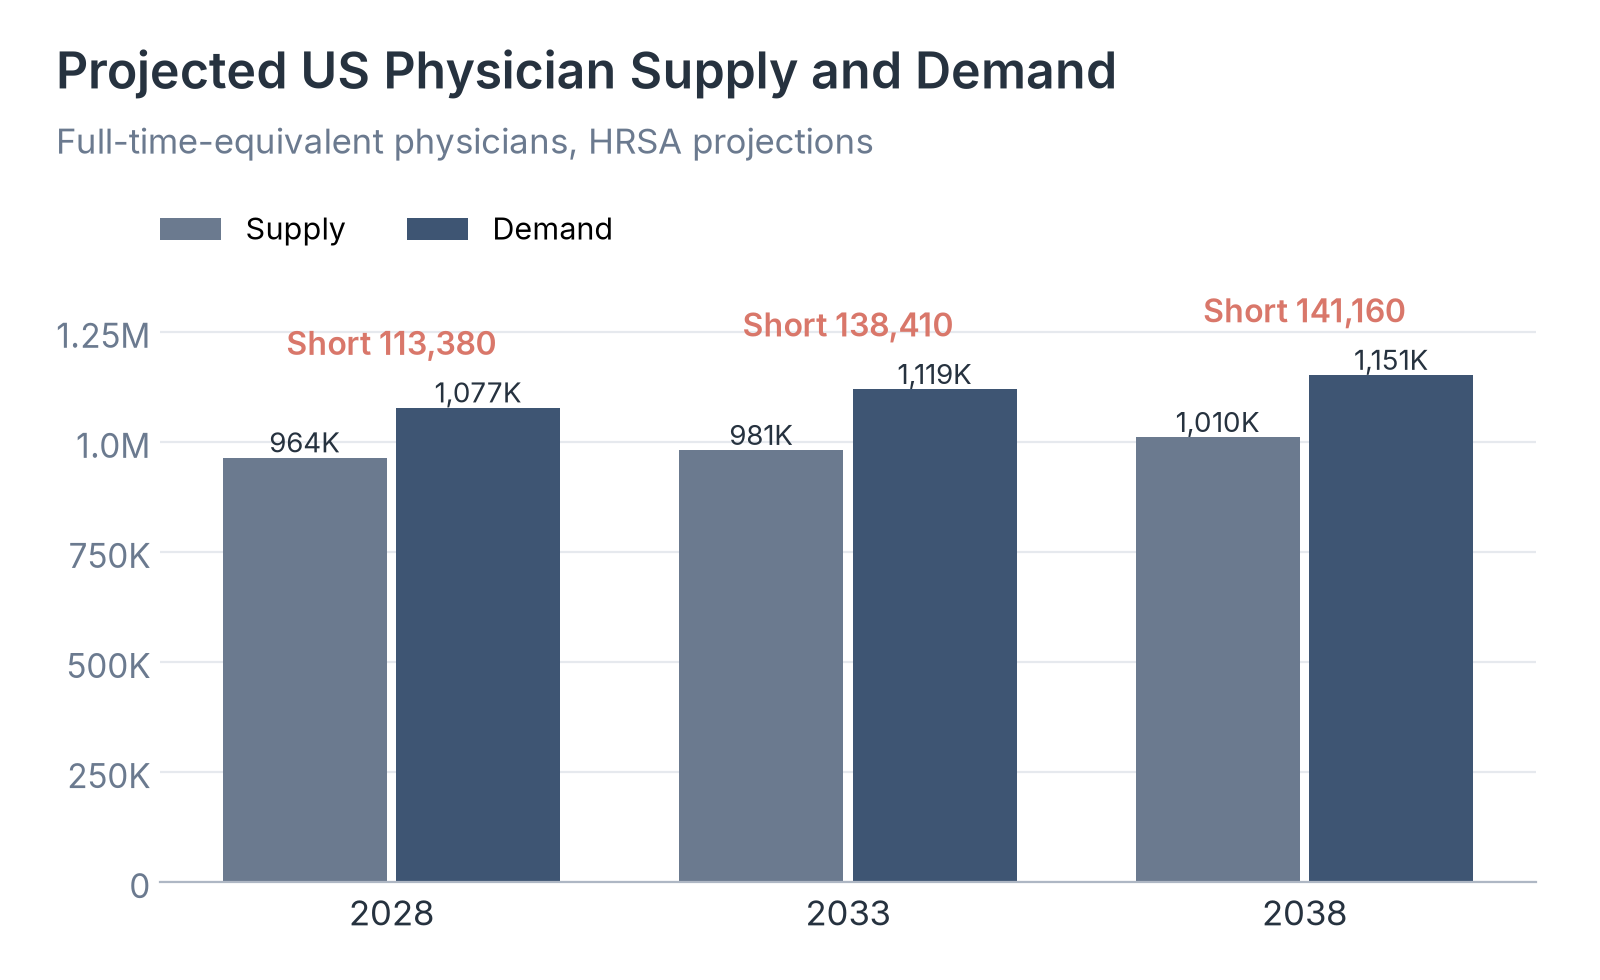
Source: Health Resources and Services Administration, National Center for Health Workforce Analysis, Physician Workforce: Projections, 2023-2038, December 2025.
Key Findings
- HRSA projects supply to grow by 46,220 FTE physicians between 2028 and 2038, while demand grows by 74,000. The shortage widens from 113,380 FTE in 2028 to 141,160 in 2038.
- Supply meets 89% of demand in 2028 and 88% in 2033 and 2038, so the gap stays at roughly one in eight needed physicians throughout the period.
- The gap is far wider outside cities. HRSA projects that nonmetro areas will have 42% of the physicians they need in 2038, compared with 95% in metro areas.
Projected Physician Shortages by Specialty
The national total combines specialties that are expected to be short with a few that are expected to have more physicians than needed. HRSA reports adequacy for each of 35 specialties in 2038, where 100% means projected supply equals projected demand.
| Specialty | Supply as share of demand | Projected position |
|---|---|---|
| Vascular surgery | 66% | Shortage |
| Ophthalmology | 72% | Shortage |
| Thoracic surgery | 73% | Shortage |
| Plastic surgery | 74% | Shortage |
| Family medicine | 76% | Shortage |
| Hospital medicine | 78% | Shortage |
| Allergy and immunology | 83% | Shortage |
| Anesthesiology | 83% | Shortage |
| General internal medicine | 83% | Shortage |
| Geriatrics | 84% | Shortage |
| Pathology | 84% | Shortage |
| Urology | 84% | Shortage |
| Cardiology | 85% | Shortage |
| Nephrology | 85% | Shortage |
| Physical medicine and rehabilitation | 85% | Shortage |
| Obstetrics and gynecology | 86% | Shortage |
| Pediatrics | 86% | Shortage |
| Otolaryngology | 87% | Shortage |
| Radiation oncology | 87% | Shortage |
| Orthopedic surgery | 88% | Shortage |
| Neurological surgery | 89% | Shortage |
| Radiology | 90% | Shortage |
| General surgery | 91% | Shortage |
| Infectious diseases | 91% | Shortage |
| Rheumatology | 91% | Shortage |
| Other specialists | 93% | Shortage |
| Dermatology | 95% | Shortage |
| Hematology and oncology | 96% | Shortage |
| Colorectal surgery | 98% | Shortage |
| Gastroenterology | 98% | Shortage |
| Neurology | 104% | Surplus |
| Neonatology | 106% | Surplus |
| Endocrinology | 109% | Surplus |
| Critical care and pulmonology | 112% | Surplus |
| Emergency medicine | 116% | Surplus |
Source: Health Resources and Services Administration, National Center for Health Workforce Analysis, Physician Workforce: Projections, 2023-2038, December 2025.
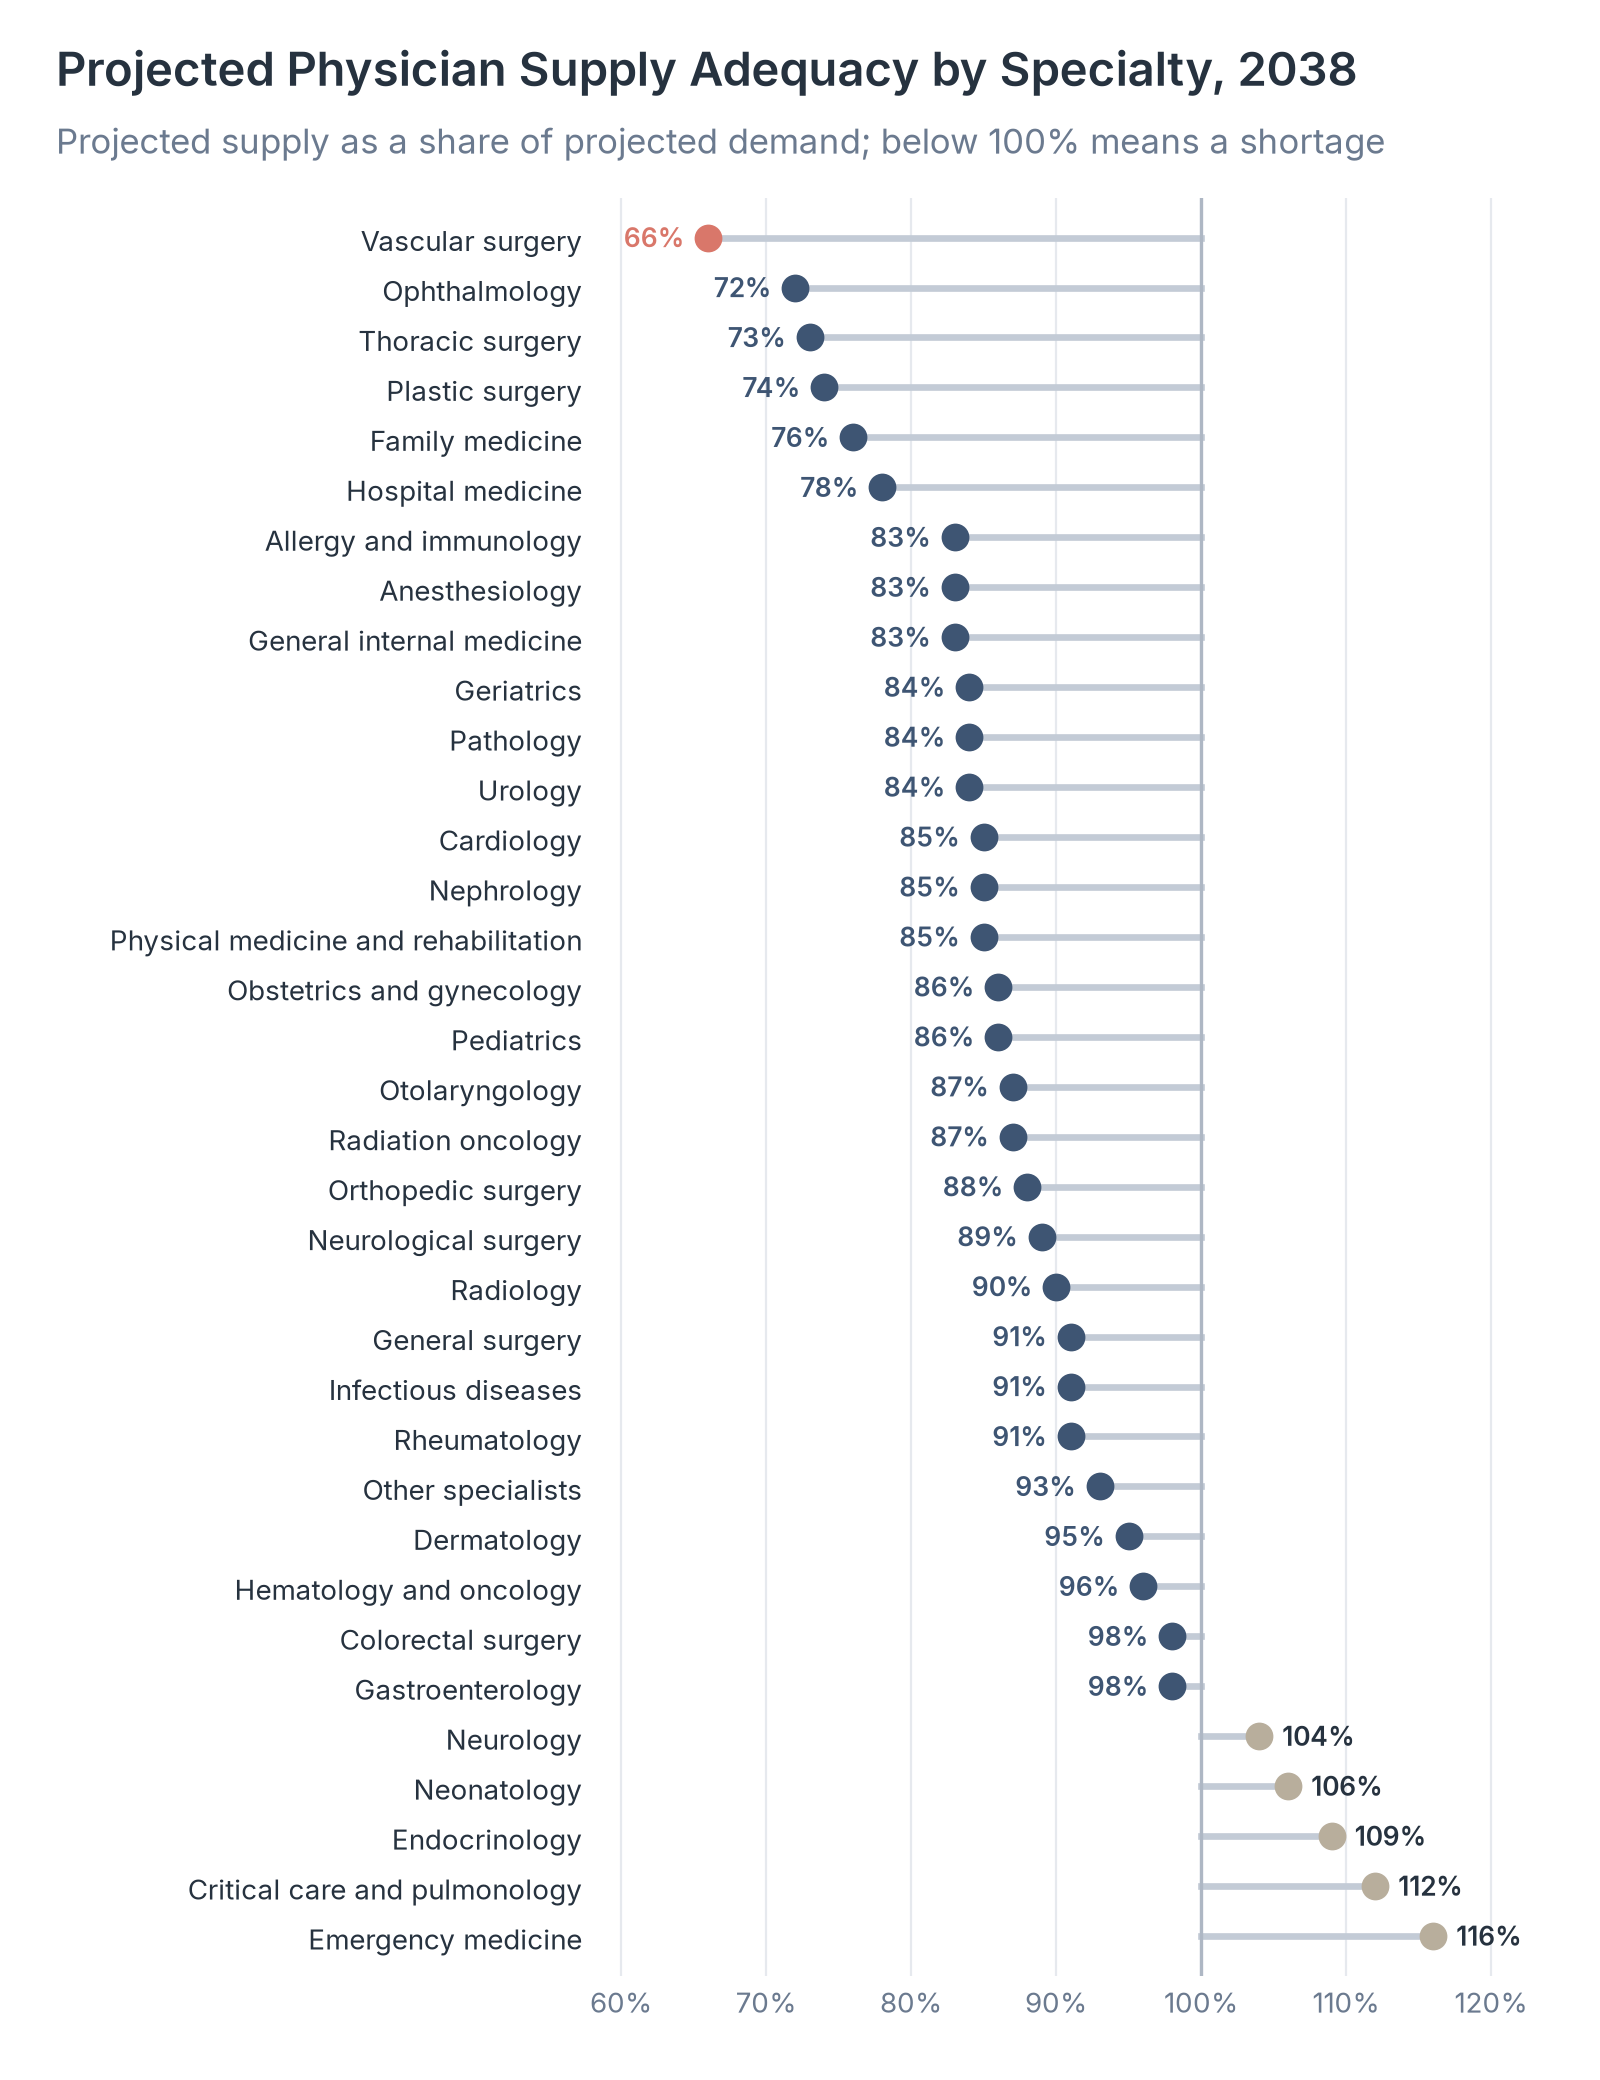
Source: Health Resources and Services Administration, National Center for Health Workforce Analysis, Physician Workforce: Projections, 2023-2038, December 2025.
Key Findings
- Thirty specialties are projected to be short in 2038, with a combined shortage of 158,990 FTE physicians. Vascular surgery (66%), ophthalmology (72%), thoracic surgery (73%), and plastic surgery (74%) have the lowest adequacy.
- Family medicine (76%), hospital medicine (78%), and general internal medicine (83%) are among the specialties furthest below demand, and all three provide first-contact care.
- Five specialties are projected to have more physicians than needed: emergency medicine (116%), critical care and pulmonology (112%), endocrinology (109%), neonatology (106%), and neurology (104%). HRSA notes that more use of nurse practitioners and physician assistants may offset part of the shortages in some specialties.
Primary Care Health Professional Shortage Areas
The projections describe the future, while shortage area designations describe today. HRSA designates a primary care HPSA when an area, population group, or facility has too few primary care physicians for its population, generally at least 3,500 people per primary care physician for a geographic area.
| Group | Designations | People in designated areas | Practitioners needed to remove designations |
|---|---|---|---|
| All primary care HPSAs | 8,830 | 102,257,076 | 17,675 |
| Type: Geographic area | 1,408 | 39,040,768 | 4,298 |
| Type: Population group | 2,501 | 62,129,676 | 12,621 |
| Type: Facility | 4,921 | 1,086,632 | 756 |
| Rurality: Rural | 5,480 | 27,522,357 | 4,792 |
| Rurality: Partially rural | 913 | 33,436,046 | 4,882 |
| Rurality: Non-rural | 2,403 | 41,161,202 | 7,968 |
| Rurality: Unknown | 34 | 137,471 | 33 |
Source: Health Resources and Services Administration, Designated HPSA Quarterly Summary, fourth quarter of fiscal year 2026, as of September 30, 2026.
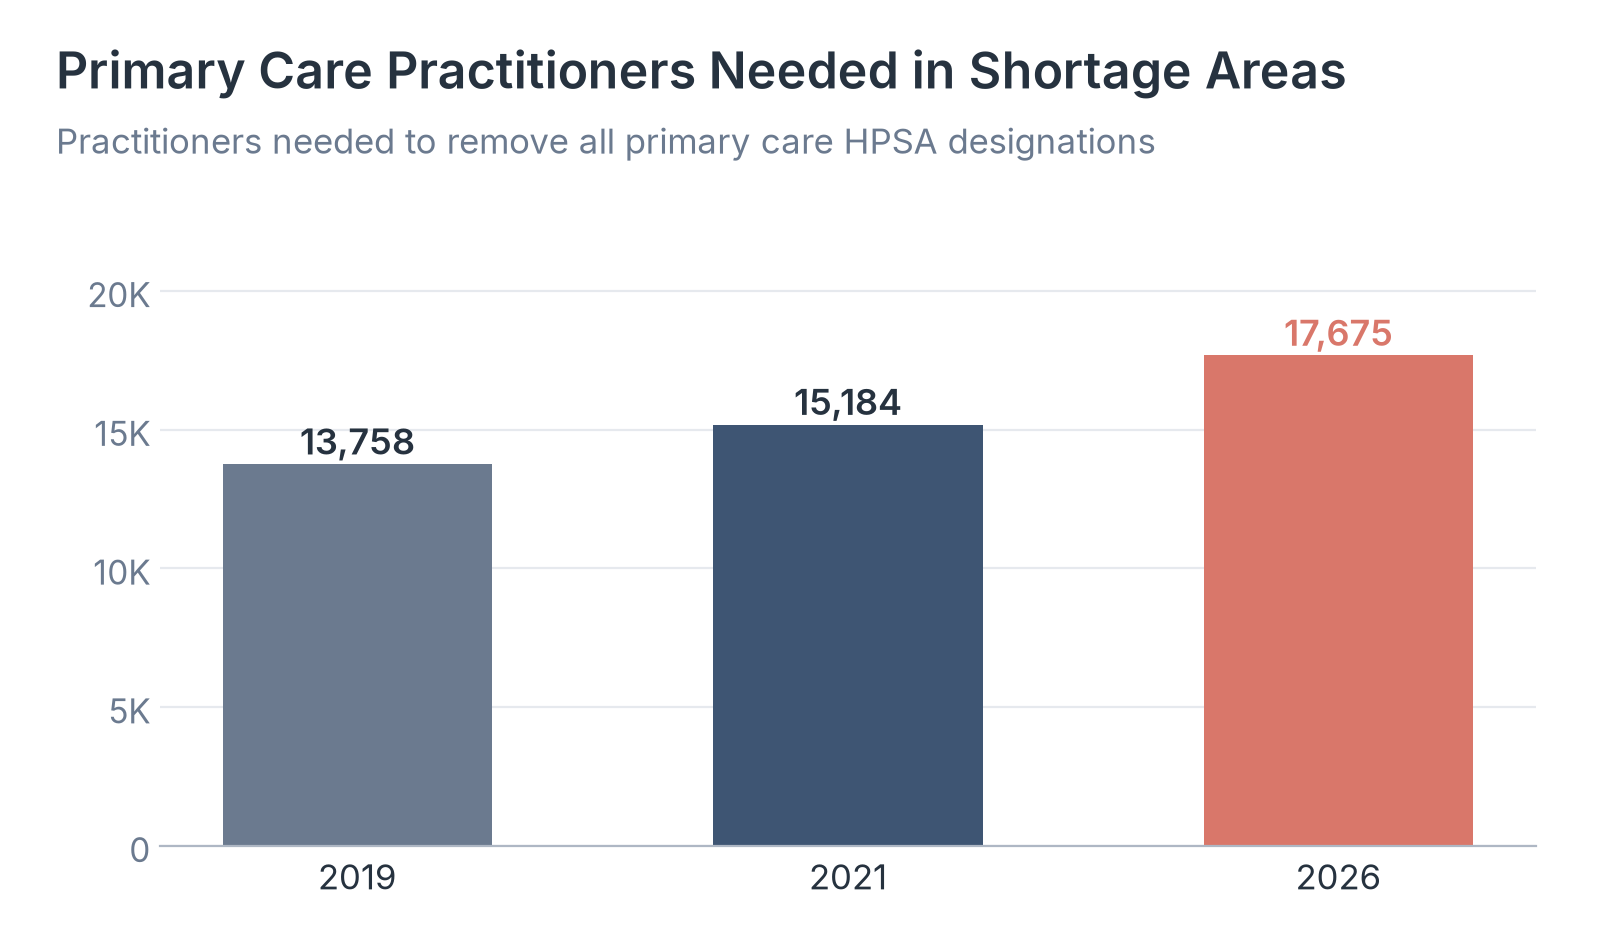
Source: HRSA Designated HPSA Quarterly Summary for 2026; AAMC, The Complexities of Physician Supply and Demand, citing HRSA, for 2019 and 2021.
Key Findings
- Population group designations, which cover groups such as low-income residents or Medicaid enrollees in an area, account for 62,129,676 of the 102,257,076 people in primary care HPSAs and 12,621 of the 17,675 practitioners needed.
- Rural areas hold 62.06% of all primary care HPSA designations, but only 27,522,357 of the people in them, because most rural designations cover small populations.
- The number of primary care practitioners needed to remove all designations rose from 13,758 in 2019 and 15,184 in 2021 to 17,675 in 2026. HRSA reports that 46.75% of the primary care need in designated areas was met as of September 30, 2026.
Primary Care Shortage Areas by State
Designation counts alone are hard to compare between states of very different size. To compare them, we divided the number of people in each state's primary care HPSAs by the state's 2025 population and calculated the practitioners needed per 100,000 residents.
| State | Share of residents in HPSAs | People in HPSAs | Designations | Share of need met | Practitioners needed | Needed per 100,000 residents |
|---|---|---|---|---|---|---|
| Washington | 69.7% | 5,576,604 | 260 | 42.4% | 975 | 12.2 |
| Alaska | 60.1% | 443,060 | 342 | 51.6% | 63 | 8.5 |
| Arizona | 55.2% | 4,207,074 | 272 | 40.7% | 797 | 10.5 |
| New Mexico | 53.6% | 1,139,819 | 108 | 31.4% | 253 | 11.9 |
| Alabama | 50.3% | 2,609,948 | 134 | 62.4% | 315 | 6.1 |
| Wyoming | 46.5% | 273,718 | 50 | 54.4% | 36 | 6.1 |
| Mississippi | 46.1% | 1,361,358 | 156 | 33.1% | 312 | 10.6 |
| South Carolina | 45.1% | 2,512,622 | 112 | 80.2% | 159 | 2.9 |
| West Virginia | 44.9% | 793,019 | 126 | 38.3% | 163 | 9.2 |
| Delaware | 44.3% | 469,204 | 14 | 11.0% | 148 | 14.0 |
| Nevada | 43.4% | 1,425,329 | 87 | 41.5% | 271 | 8.3 |
| Indiana | 41.6% | 2,900,192 | 174 | 55.0% | 414 | 5.9 |
| District of Columbia | 41.3% | 286,765 | 12 | 0.2% | 96 | 13.8 |
| Missouri | 40.9% | 2,567,049 | 357 | 23.7% | 636 | 10.1 |
| Louisiana | 40.0% | 1,846,293 | 182 | 70.5% | 173 | 3.7 |
| Arkansas | 39.3% | 1,224,488 | 157 | 52.6% | 197 | 6.3 |
| Oregon | 38.6% | 1,651,484 | 175 | 44.1% | 306 | 7.2 |
| Connecticut | 37.2% | 1,371,291 | 68 | 60.0% | 172 | 4.7 |
| Hawaii | 36.5% | 522,299 | 33 | 72.1% | 40 | 2.8 |
| Minnesota | 35.8% | 2,084,749 | 239 | 56.4% | 280 | 4.8 |
| Kentucky | 35.2% | 1,623,509 | 265 | 31.6% | 360 | 7.8 |
| Oklahoma | 35.2% | 1,452,317 | 210 | 28.6% | 370 | 9.0 |
| Maryland | 33.2% | 2,079,523 | 78 | 31.6% | 465 | 7.4 |
| Michigan | 32.9% | 3,328,841 | 295 | 44.9% | 617 | 6.1 |
| Illinois | 31.9% | 4,054,040 | 354 | 41.6% | 763 | 6.0 |
| Ohio | 31.8% | 3,787,826 | 228 | 51.3% | 604 | 5.1 |
| South Dakota | 31.8% | 297,512 | 110 | 35.0% | 58 | 6.2 |
| Tennessee | 31.7% | 2,317,401 | 162 | 54.6% | 346 | 4.7 |
| North Carolina | 31.6% | 3,535,882 | 227 | 48.4% | 610 | 5.4 |
| Montana | 31.3% | 358,743 | 145 | 37.3% | 69 | 6.0 |
| Iowa | 29.3% | 950,239 | 182 | 44.4% | 167 | 5.2 |
| Idaho | 28.7% | 582,074 | 114 | 43.9% | 104 | 5.1 |
| Texas | 27.6% | 8,754,402 | 450 | 44.9% | 1,544 | 4.9 |
| New York | 26.4% | 5,288,766 | 211 | 35.4% | 1,130 | 5.6 |
| Florida | 26.0% | 6,110,671 | 305 | 39.4% | 1,276 | 5.4 |
| North Dakota | 25.3% | 202,041 | 95 | 37.5% | 38 | 4.8 |
| Georgia | 25.1% | 2,834,970 | 249 | 38.4% | 590 | 5.2 |
| Wisconsin | 24.9% | 1,486,138 | 172 | 63.2% | 182 | 3.0 |
| Virginia | 24.1% | 2,139,409 | 180 | 57.3% | 286 | 3.2 |
| Colorado | 23.4% | 1,406,030 | 148 | 47.2% | 242 | 4.0 |
| Rhode Island | 23.1% | 257,218 | 17 | 74.3% | 22 | 2.0 |
| Kansas | 22.6% | 672,954 | 175 | 41.2% | 122 | 4.1 |
| Utah | 22.1% | 781,222 | 64 | 66.0% | 80 | 2.3 |
| California | 21.6% | 8,513,667 | 713 | 54.5% | 1,241 | 3.2 |
| Maine | 19.6% | 277,604 | 102 | 56.0% | 39 | 2.8 |
| New Hampshire | 14.6% | 206,720 | 29 | 74.8% | 17 | 1.2 |
| Nebraska | 13.9% | 279,706 | 139 | 51.1% | 37 | 1.8 |
| Massachusetts | 11.1% | 796,906 | 68 | 58.7% | 108 | 1.5 |
| New Jersey | 8.3% | 796,188 | 45 | 83.2% | 39 | 0.4 |
| Vermont | 7.8% | 50,210 | 17 | 82.6% | 3 | 0.5 |
| Pennsylvania | 5.1% | 666,243 | 150 | 55.5% | 113 | 0.9 |
Source: Healthcare Industry Reviews analysis of HRSA primary care HPSA designations and US Census Bureau 2025 population estimates, November 2026.
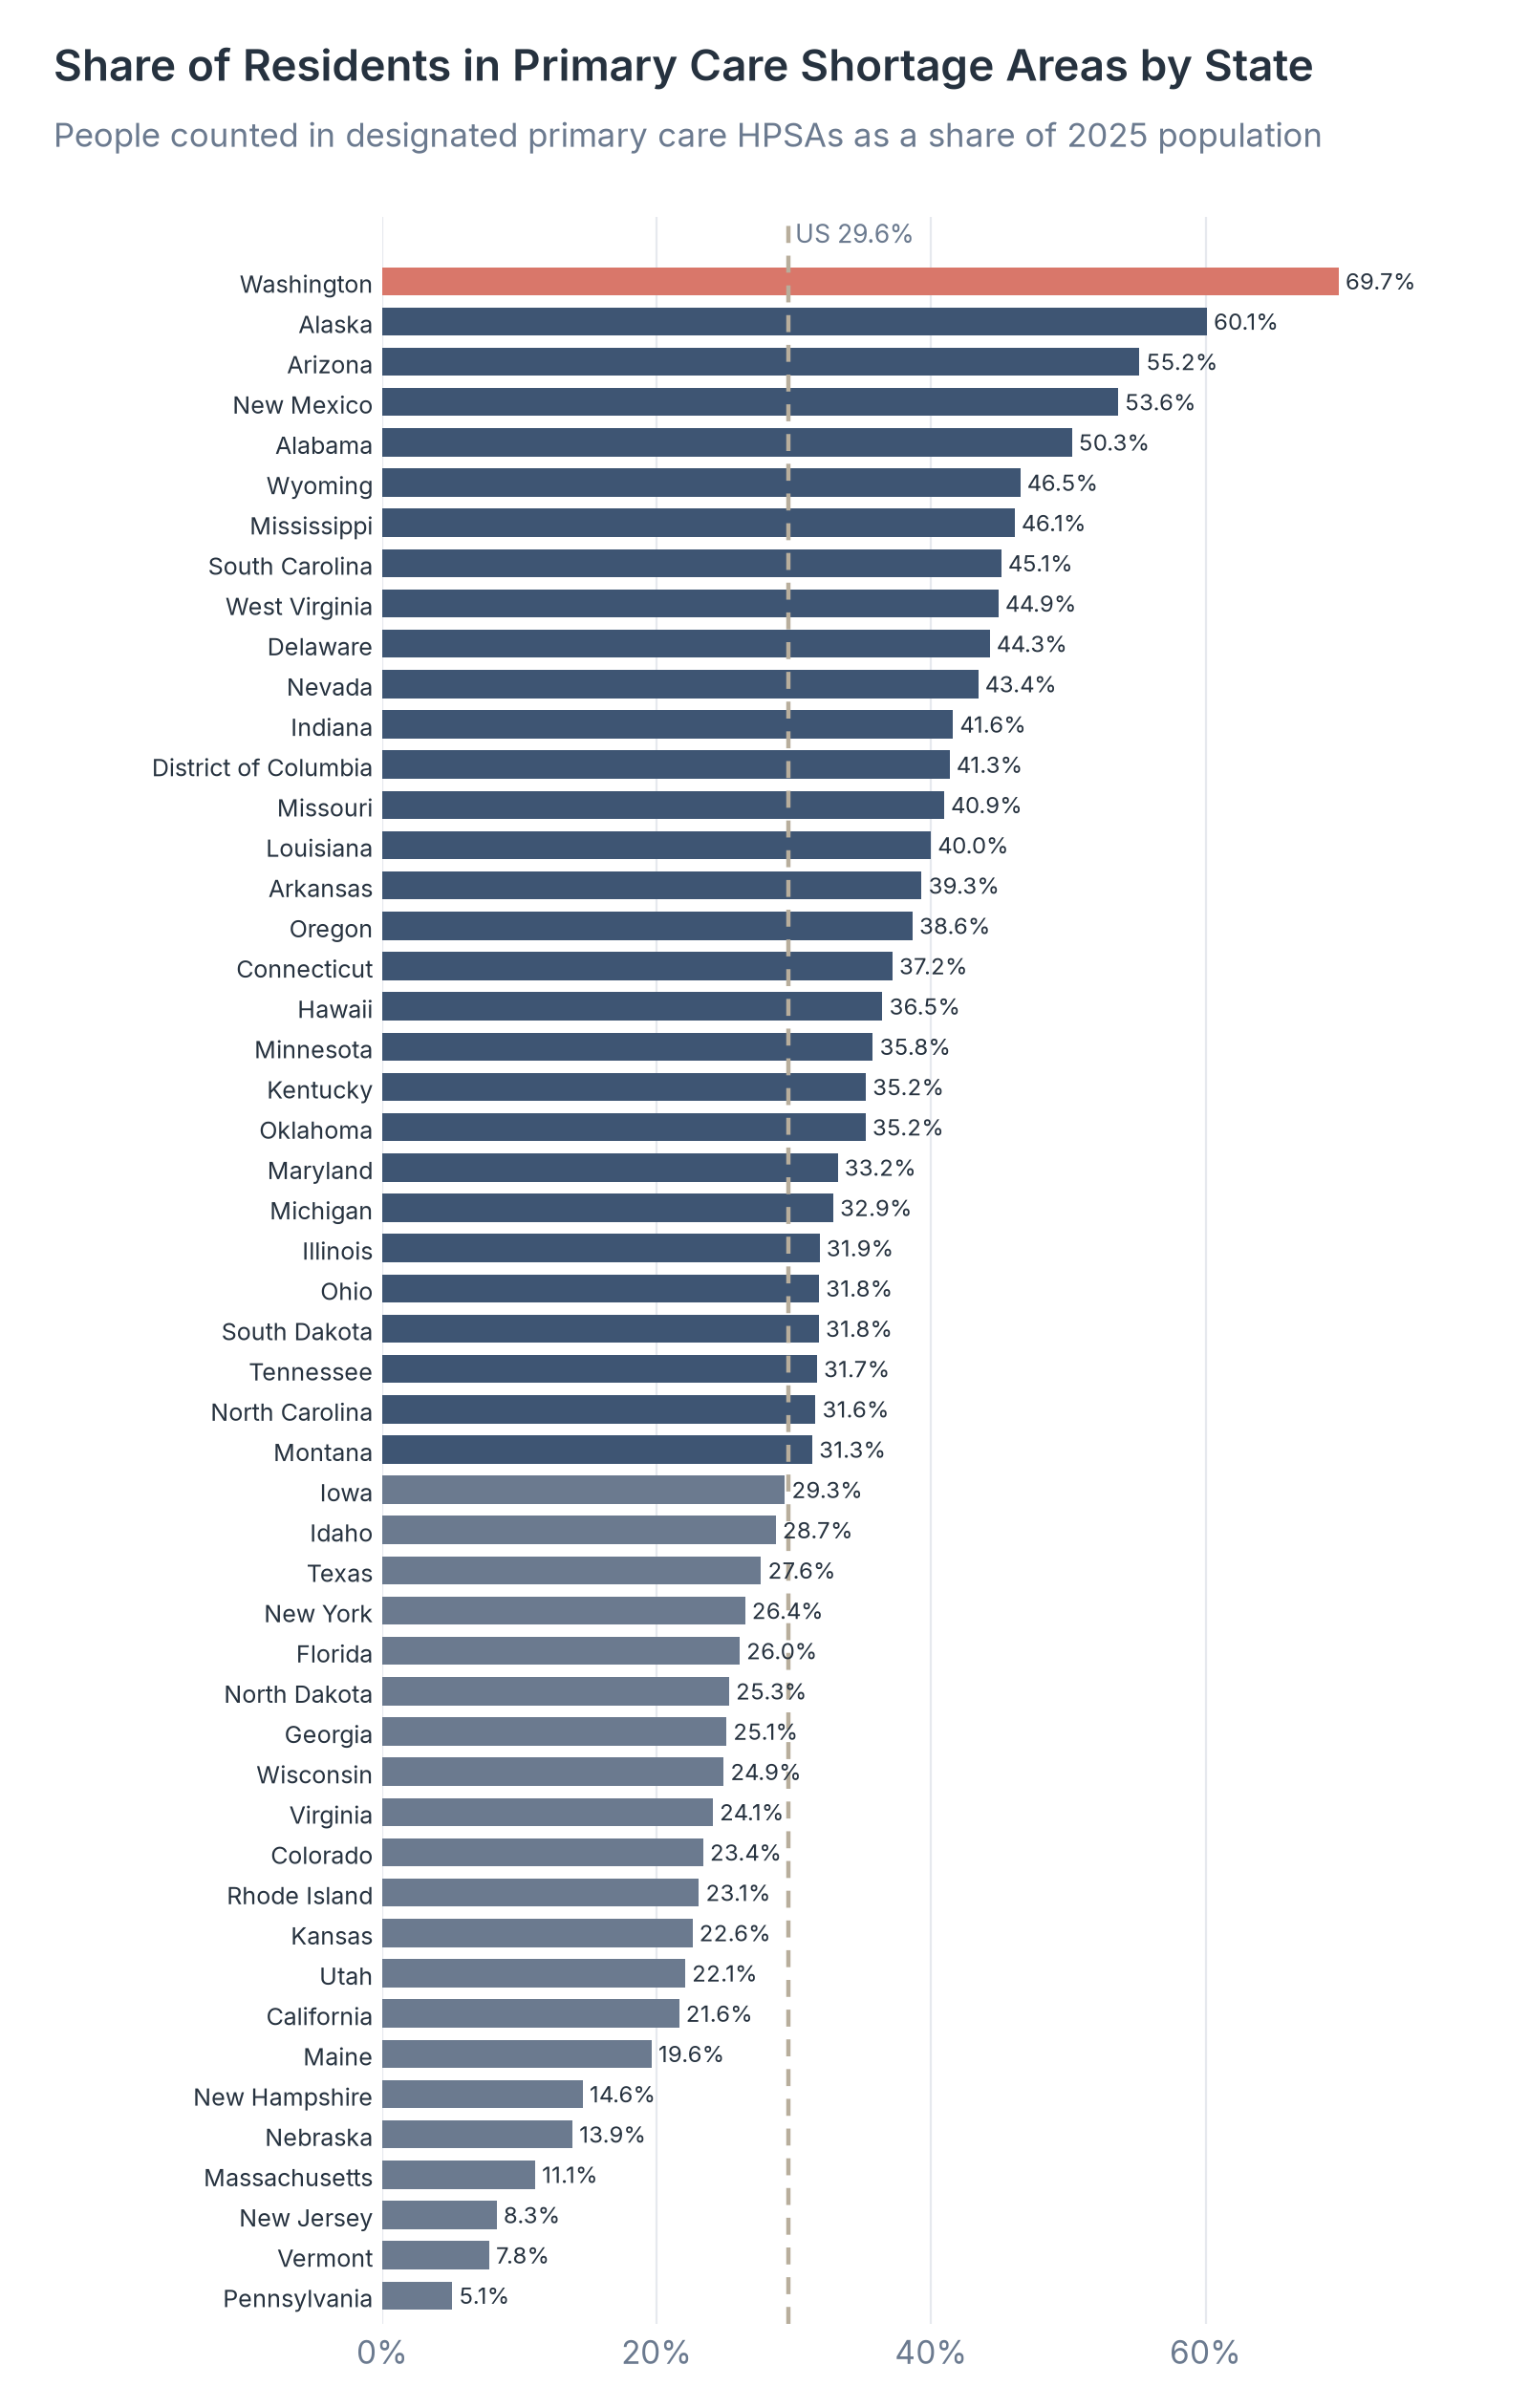
Source: Healthcare Industry Reviews analysis of HRSA primary care HPSA designations and US Census Bureau 2025 population estimates, November 2026.
Key Findings
- Washington (69.7%), Alaska (60.1%), Arizona (55.2%), New Mexico (53.6%), and Alabama (50.3%) had half or more of their residents in primary care HPSAs. In 30 states, the share was 30% or higher.
- Pennsylvania (5.1%), Vermont (7.8%), and New Jersey (8.3%) had the lowest shares. A low share can reflect how many designations a state has applied for as well as how many physicians it has.
- Relative to population, Delaware (14.0 per 100,000 residents), the District of Columbia (13.8), and Washington (12.2) need the most additional primary care practitioners. Texas needs the most in total, at 1,544.
AAMC Physician Shortage Projections for 2036
The AAMC publishes its own projections, which present a range of outcomes because they depend on how many residency positions are funded, how fast new care models spread, and when physicians retire. Its 2024 report is the most recent edition.
| Physician group | Projected 2036 range |
|---|---|
| All physicians | 13,500 to 86,000 |
| Primary care | 20,200 to 40,400 |
| Surgical specialties | 10,100 to 19,900 |
| Medical specialties | shortage of 5,500 to surplus of 3,700 |
| Other specialties | shortage of 19,500 to surplus of 4,300 |
| Primary-care-trained hospitalists | shortage of 1,300 to surplus of 4,900 |
Source: Association of American Medical Colleges, The Complexities of Physician Supply and Demand: Projections From 2021 to 2036, summary report, March 2024.
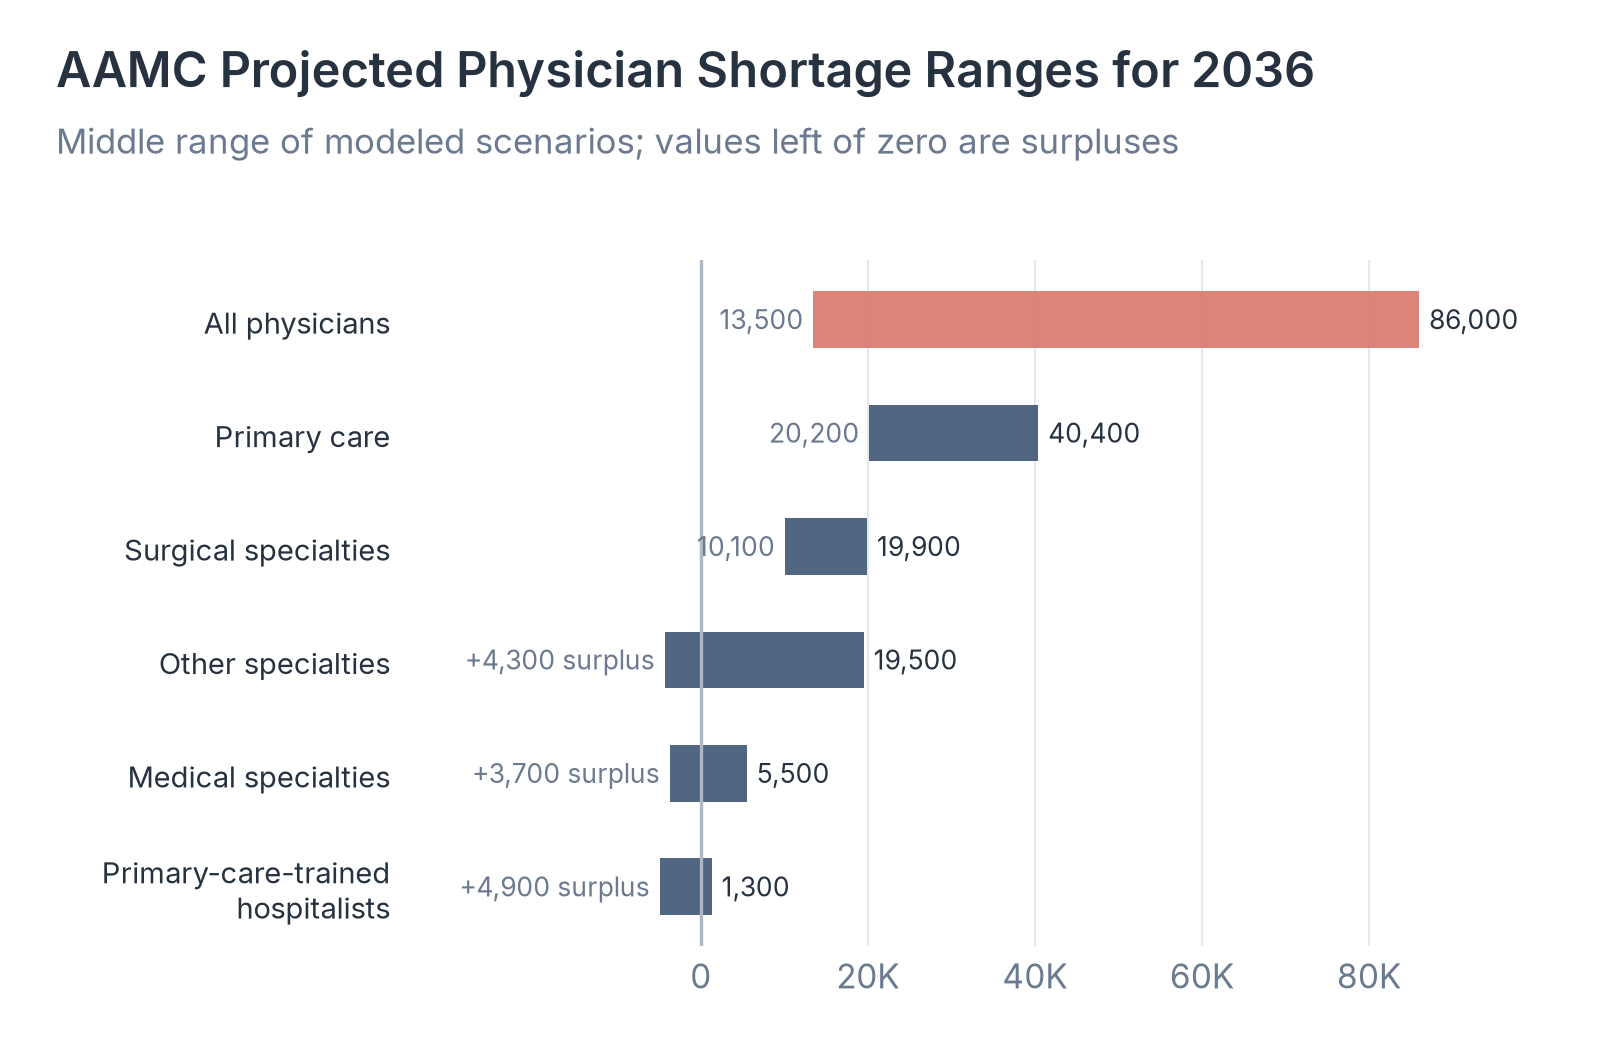
Source: Association of American Medical Colleges, The Complexities of Physician Supply and Demand: Projections From 2021 to 2036, summary report, March 2024.
Key Findings
- The AAMC projects a shortage of 13,500 to 86,000 physicians by 2036. Its 2021 report had projected a shortage of up to 124,000 by 2034, so the upper end of the range has come down. The AAMC attributes the change mainly to new scenarios in which the number of residency positions keeps growing.
- Primary care makes up the largest single group, with a projected shortage of 20,200 to 40,400 physicians, followed by surgical specialties at 10,100 to 19,900.
- If communities that have historically faced barriers to care had used it at the same rate as other groups, the AAMC estimates that the US would have needed about 117,100 to 202,800 more physicians as of 2021, three to six times its projected shortfall.
What Physician Shortage Statistics Show for 2026
Both major projections point the same way. HRSA expects supply to meet 88% of physician demand in 2038, and the AAMC expects a shortage of up to 86,000 physicians by 2036. The gap is widest in primary care, several surgical specialties, and nonmetro areas, and about 102 million people already live in primary care shortage areas.
The two sources measure different things: HRSA reports a single projection to 2038 with detail by specialty and area, while the AAMC reports a range across many scenarios to 2036. So if you plan staffing or services around the physician shortage, use HRSA figures for specialty and rural detail, the AAMC range for the national total, and HPSA data for where patients are short of primary care now.
Data Collection and Methodology
Projection figures come from the HRSA National Center for Health Workforce Analysis physician projections factsheet (December 2025), which uses HRSA's Health Workforce Simulation Model and counts physicians in full-time equivalents of 40 hours a week, and from the AAMC's summary report and press release on its 2021 to 2036 projections (March 2024). Adequacy is projected supply divided by projected demand. HRSA's metro and nonmetro figures use the 2013 NCHS urban-rural classification.
Shortage area figures come from HRSA's Designated HPSA Quarterly Summary for the fourth quarter of fiscal year 2026, with data as of September 30, 2026, which we opened on November 4, 2026. Designation counts include HPSAs proposed for withdrawal. For each state and the District of Columbia, we divided the population of designated primary care HPSAs by the Census Bureau's Vintage 2025 resident population estimate and divided practitioners needed by population per 100,000 residents. HPSA population counts can include people in overlapping designations, so state shares are approximate. Practitioner counts for 2019 and 2021 are HRSA figures as cited in the AAMC report.
We calculated products, differences, and ratios from the published values.
Sources
- Healthcare Industry Reviews, Physician Shortage Study: analysis of HRSA primary care HPSA designations as of September 30, 2026 for all 50 states and the District of Columbia, with US Census Bureau 2025 population estimates and HRSA and AAMC physician projections, conducted November 2026.
- Health Resources and Services Administration, National Center for Health Workforce Analysis. Physician Workforce: Projections, 2023-2038. December 2025.
- Health Resources and Services Administration. Designated Health Professional Shortage Areas Statistics: Designated HPSA Quarterly Summary. Fourth quarter of fiscal year 2026, as of September 30, 2026.
- US Census Bureau. Annual Estimates of the Resident Population for the United States, Regions, States, District of Columbia, and Puerto Rico (Vintage 2025).
- Association of American Medical Colleges. The Complexities of Physician Supply and Demand: Projections From 2021 to 2036, Summary Report. March 2024.
- Association of American Medical Colleges. New AAMC Report Shows Continuing Projected Physician Shortage. March 21, 2024.