Uninsured Rate Statistics: 2026 Report
Published
Our analysts reviewed Census Bureau coverage data from 2013 to 2025, state estimates for all 50 states and DC, federal point-in-time survey estimates, and CBO projections to show how many people in the United States lack health insurance, who they are, and where they live, as of Q4 2026.
Key Findings
- 26.7 million people in the United States, 7.9% of the population, had no health insurance at any point in 2025, a rate not statistically different from 2024 and down from 13.3% in 2013.
- Adults ages 19 to 25 had the highest uninsured rate of any age group in 2025, 14.5%, compared with 5.8% of children under 19 and 0.9% of adults 65 and older.
- Texas had the highest uninsured rate of any state in 2025, 16.5%, and Massachusetts the lowest, 2.7%.
- In the 10 states that had not expanded Medicaid, 16.2% of adults ages 19 to 64 were uninsured all year in 2025, compared with 9.0% in expansion states and DC.
- The Congressional Budget Office estimates that the 2025 budget reconciliation law will raise the number of uninsured people by 10 million in 2034.
The uninsured rate is the share of people who have no health insurance. Three federal surveys measure it, and each counts a little differently. The Census Bureau's Current Population Survey (CPS) counts people who went without coverage for an entire calendar year.
The American Community Survey (ACS), which is large enough to produce estimates for every state, and the National Health Interview Survey (NHIS) count people who were uninsured at the time they were interviewed.
Our analysts compiled Census Bureau uninsured rates for 2013 to 2025 by age, race and Hispanic origin, income, and Medicaid expansion status from the CPS, along with 2025 ACS rates for all 50 states and DC.2,3 We compared those figures with the NHIS point-in-time estimates for 2021 to 2025 and with Congressional Budget Office (CBO) projections of how the 2025 budget reconciliation law will change the number of uninsured people.4,5
In the following sections, we cover the national uninsured rate since 2013, the rate by age, the rate by race, Hispanic origin, and citizenship, the rate in each state, the effect of Medicaid expansion and income, and projected changes in the number of uninsured people.
How the US Uninsured Rate Has Changed Since 2013
The CPS has measured full-year uninsurance on a consistent basis since 2013, the year before the Affordable Care Act's Marketplaces and Medicaid expansion took effect. The Census Bureau updated its processing system in 2017, so the table shows that year under both methods.
| Year | All people | Under 19 | Ages 19 to 64 | 65 and older |
|---|---|---|---|---|
| 2013 | 13.3% | 7.5% | 18.5% | 1.5% |
| 2014 | 10.4% | 6.2% | 14.3% | 1.4% |
| 2015 | 9.1% | 5.3% | 12.6% | 1.1% |
| 2016 | 8.8% | 5.4% | 12.1% | 1.2% |
| 2017 | 8.8% | 5.4% | 12.2% | 1.3% |
| 2017 (updated processing) | 7.9% | 5.0% | 11.0% | 1.0% |
| 2018 | 8.5% | 5.5% | 11.7% | 0.9% |
| 2019 | 8.0% | 5.2% | 11.1% | 1.1% |
| 2020 | 8.6% | 5.6% | 11.9% | 1.0% |
| 2021 | 8.3% | 5.0% | 11.6% | 1.2% |
| 2022 | 7.9% | 5.4% | 10.8% | 1.1% |
| 2023 | 8.0% | 5.8% | 10.9% | 0.9% |
| 2024 | 8.0% | 6.1% | 11.0% | 1.0% |
| 2025 | 7.9% | 5.8% | 11.0% | 0.9% |
Source: US Census Bureau, Health Insurance Coverage in the United States: 2025, September 2026. People without coverage for the entire calendar year. The Census Bureau recommends caution when comparing 2019 with other years.
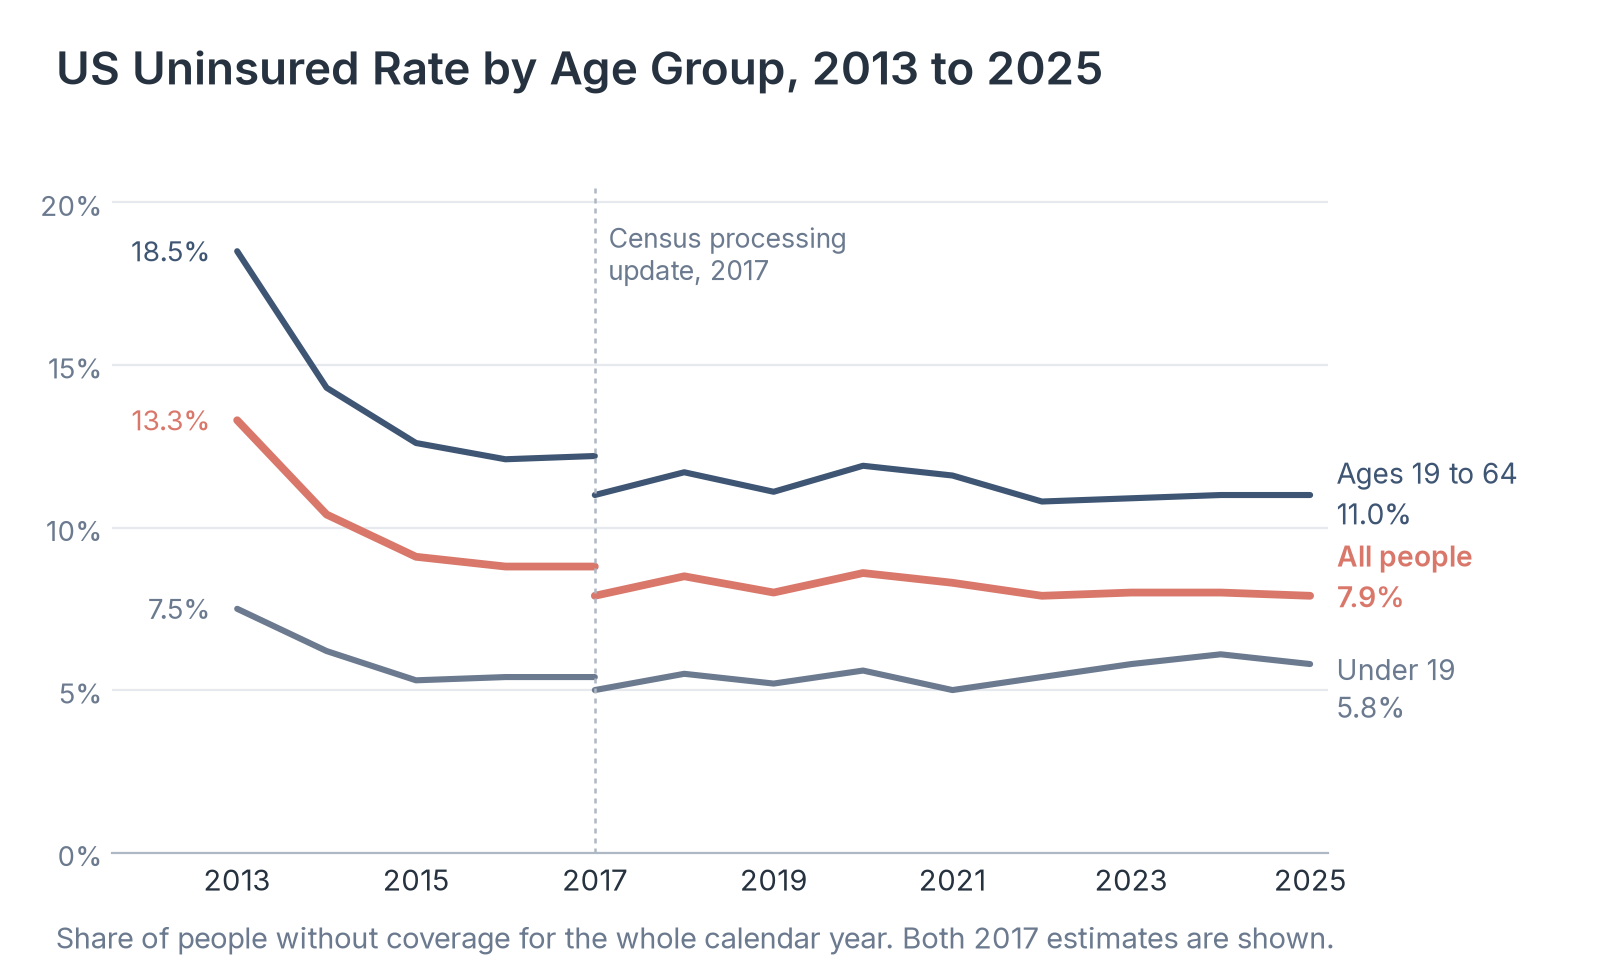
Source: Healthcare Industry Reviews analysis of Census Bureau CPS data, conducted November 2026.
Key Findings
- The uninsured rate fell from 13.3% in 2013 to 9.1% in 2015 as the Affordable Care Act's coverage expansions took effect, and it has stayed between 7.9% and 8.6% since 2017 under the updated processing.
- The rate for children under 19 rose from 5.0% in 2021 to 6.1% in 2024 and was 5.8% in 2025. Medicaid covered 57.8 million people in 2025, 1.4 million fewer than in 2024, while Medicare grew by 2.2 million.
- The NHIS, which counts people uninsured at the time of the interview, found 28.0 million uninsured people (8.3%) in 2025, up from 25.0 million (7.6%) in 2023. Its rate for children rose from 3.9% in 2023 to 5.6% in 2025.
Uninsured Rate by Age
Most adults 65 and older have Medicare, and children under 19 are eligible for Medicaid and the Children's Health Insurance Program (CHIP). Working-age adults qualify for public coverage only in limited circumstances, so their uninsured rates are the highest.
| Age group | 2024 | 2025 | Change, percentage points |
|---|---|---|---|
| Under 19 | 6.1% | 5.8% | -0.3 |
| 19 to 25 | 14.5% | 14.5% | 0.0 |
| 26 to 34 | 13.0% | 13.3% | +0.3 |
| 35 to 44 | 10.7% | 10.8% | +0.1 |
| 45 to 64 | 8.7% | 8.6% | -0.1 |
| 65 and older | 1.0% | 0.9% | -0.1 |
| All people | 8.0% | 7.9% | -0.1 |
Source: US Census Bureau, Health Insurance Coverage in the United States: 2025, September 2026. None of the changes from 2024 to 2025 were statistically significant.
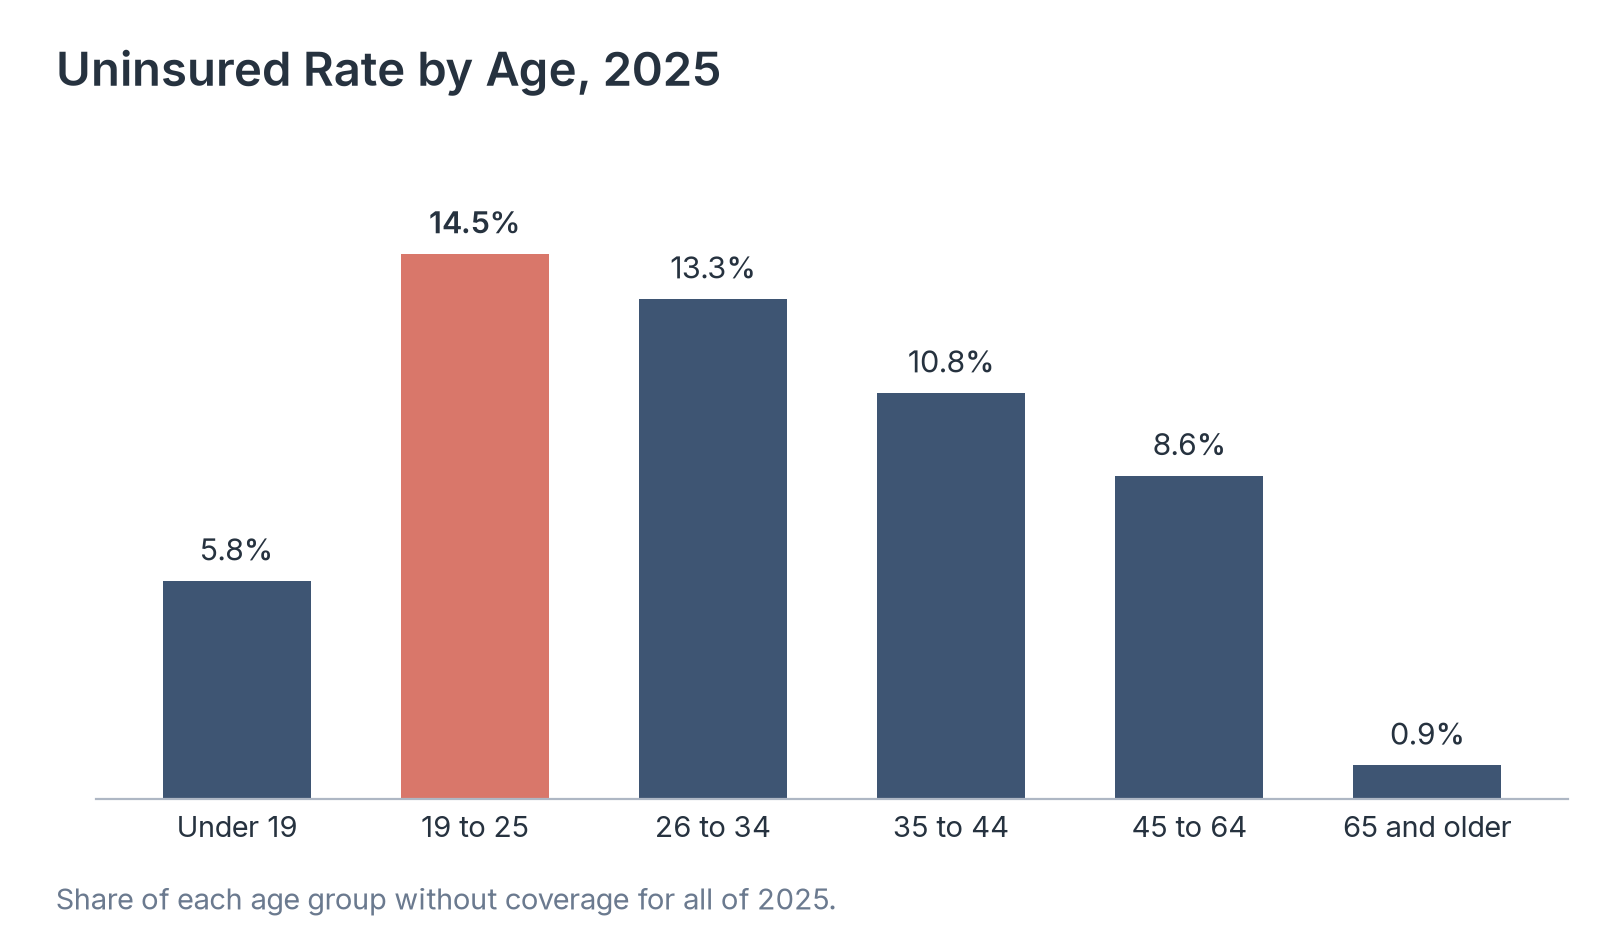
Source: Healthcare Industry Reviews analysis of Census Bureau CPS data, conducted November 2026.
Key Findings
- Adults ages 19 to 25 had an uninsured rate of 14.5% in 2025, and adults 26 to 34 had a rate of 13.3%. Among working-age adults, the rate fell with each older age group, to 8.6% for ages 45 to 64.
- 11.0% of adults ages 19 to 64 were uninsured all year, compared with 5.8% of children under 19 and 0.9% of adults 65 and older.
- Work did not guarantee coverage. 9.0% of adults who worked full time all year were uninsured, compared with 13.9% of those who worked less and 14.1% of those who did not work.
Uninsured Rate by Race, Hispanic Origin, and Citizenship
Uninsured rates differ widely by race and Hispanic origin, and even more by citizenship. The Census Bureau reports rates separately for native-born adults, naturalized citizens, and noncitizens.
| Group | All ages, 2013 | All ages, 2025 | Children under 19, 2025 | Adults 19 to 64, 2025 |
|---|---|---|---|---|
| Hispanic (any race) | 24.4% | 16.4% | 9.4% | 21.8% |
| Black | 15.9% | 9.6% | 6.0% | 13.1% |
| Asian | 13.8% | 5.3% | 3.6% | 6.8% |
| Non-Hispanic White | 9.7% | 4.8% | 4.2% | 6.9% |
| All people | 13.3% | 7.9% | 5.8% | 11.0% |
Source: US Census Bureau, Health Insurance Coverage in the United States: 2025, September 2026. Race groups are people who reported one race.
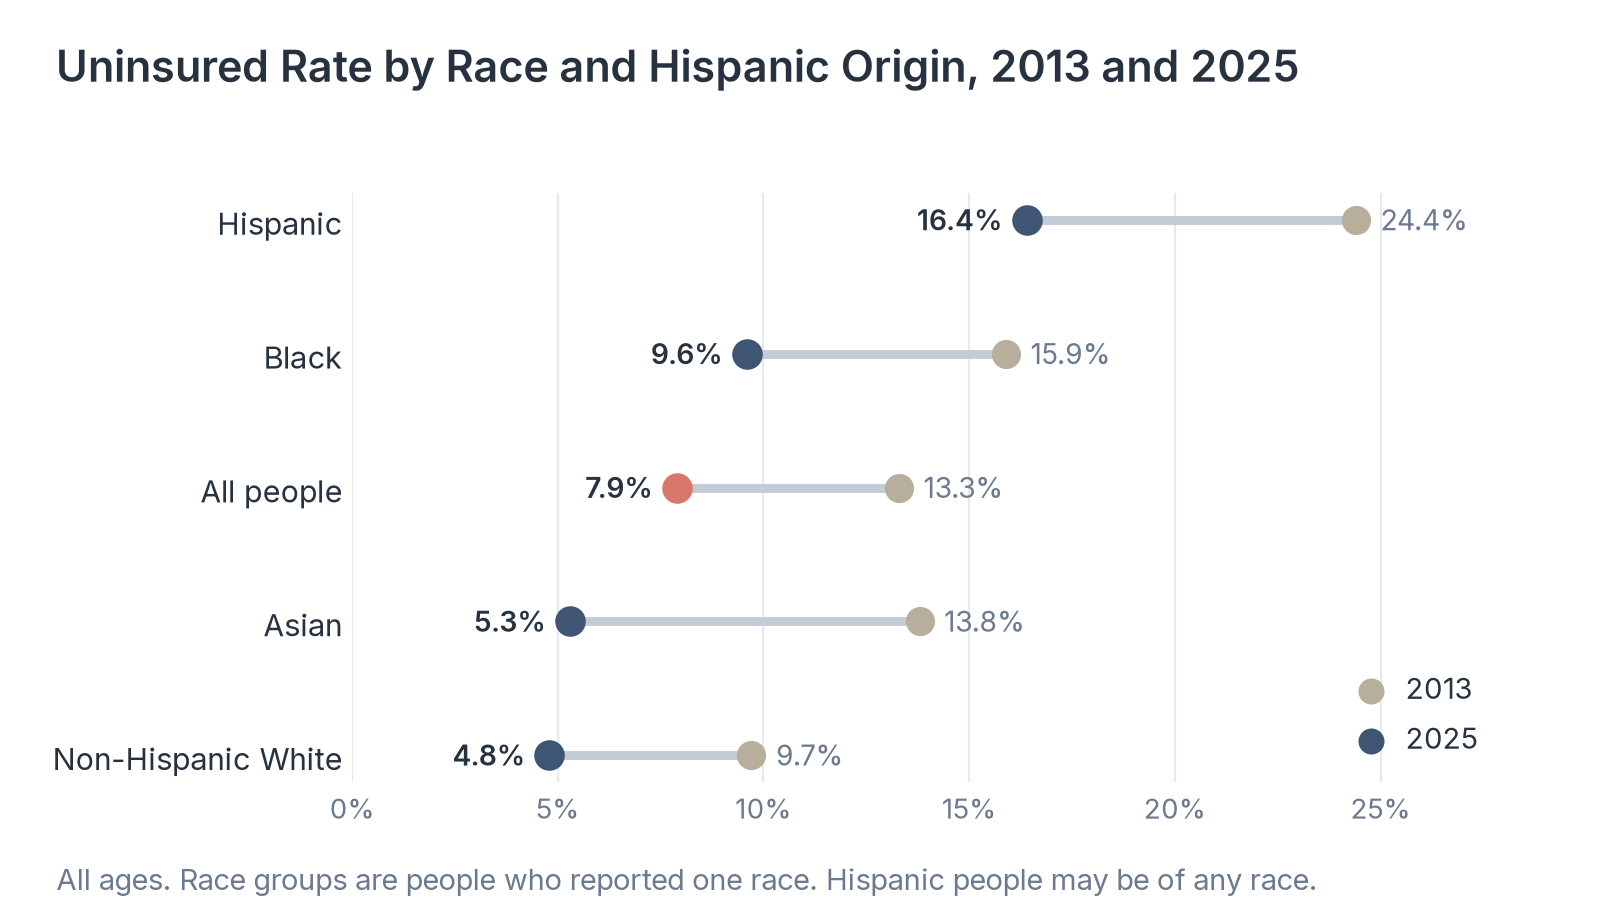
Source: Healthcare Industry Reviews analysis of Census Bureau CPS data, conducted November 2026.
Key Findings
- Hispanic people had the highest uninsured rate in 2025, 16.4%, down from 24.4% in 2013 and 17.3% in 2024. Among Hispanic adults ages 19 to 64, the rate was 21.8%.
- The rate for Black people rose from 8.9% in 2024 to 9.6% in 2025. Asian people had the largest decline since 2013, from 13.8% to 5.3%.
- 28.9% of noncitizen adults ages 19 to 64 were uninsured in 2025, compared with 9.4% of naturalized citizens and 8.9% of native-born adults. The noncitizen rate fell 2.1 percentage points from 2024.
Uninsured Rate by State
State estimates come from the ACS, which counts people uninsured on the day they answered the survey. Its national rate for 2025 was 8.4%. Changes to the ACS health insurance question in 2025 mean the Census Bureau did not compare these rates with 2024.
| State | All ages | Ages 19 to 64 | Children under 19 | Medicaid expansion as of January 2025 |
|---|---|---|---|---|
| Texas | 16.5% | 21.8% | 13.0% | No |
| Alaska | 13.6% | 17.4% | 12.7% | Yes |
| Oklahoma | 12.6% | 17.2% | 10.5% | Yes |
| Arizona | 11.8% | 16.2% | 10.7% | Yes |
| Georgia | 11.7% | 16.4% | 7.8% | No |
| Nevada | 11.5% | 16.1% | 8.0% | Yes |
| Montana | 10.9% | 15.0% | 11.0% | Yes |
| Florida | 10.5% | 15.1% | 8.2% | No |
| New Mexico | 10.5% | 16.1% | 5.6% | Yes |
| Mississippi | 10.2% | 15.4% | 5.9% | No |
| South Carolina | 10.2% | 15.0% | 7.3% | No |
| Tennessee | 10.0% | 14.4% | 6.4% | No |
| Kansas | 9.7% | 13.2% | 8.5% | No |
| Wyoming | 9.6% | 14.0% | 7.3% | No |
| Idaho | 9.5% | 13.2% | 8.1% | Yes |
| Arkansas | 9.1% | 13.1% | 6.6% | Yes |
| Colorado | 8.8% | 11.8% | 6.7% | Yes |
| South Dakota | 8.6% | 11.1% | 9.2% | Yes |
| Utah | 8.6% | 11.0% | 7.1% | Yes |
| Alabama | 8.4% | 13.0% | 3.9% | No |
| North Carolina | 8.4% | 12.1% | 5.1% | Yes |
| Indiana | 8.1% | 11.2% | 6.3% | Yes |
| Louisiana | 8.1% | 12.0% | 4.8% | Yes |
| North Dakota | 8.0% | 10.3% | 7.5% | Yes |
| Missouri | 7.9% | 10.8% | 7.0% | Yes |
| New Jersey | 7.7% | 11.1% | 4.2% | Yes |
| Delaware | 7.6% | 10.7% | 7.3% | Yes |
| Nebraska | 7.5% | 10.3% | 5.9% | Yes |
| Illinois | 7.2% | 10.5% | 3.8% | Yes |
| Kentucky | 7.2% | 10.6% | 4.5% | Yes |
| Ohio | 7.1% | 9.9% | 5.9% | Yes |
| Washington | 7.0% | 10.1% | 3.5% | Yes |
| Virginia | 6.9% | 9.5% | 5.3% | Yes |
| West Virginia | 6.9% | 10.8% | 3.6% | Yes |
| Maine | 6.8% | 10.3% | 4.6% | Yes |
| Maryland | 6.6% | 9.3% | 4.3% | Yes |
| Pennsylvania | 6.2% | 8.6% | 5.5% | Yes |
| California | 6.1% | 8.6% | 3.4% | Yes |
| Wisconsin | 5.9% | 8.4% | 4.7% | No |
| Iowa | 5.7% | 8.1% | 4.1% | Yes |
| Minnesota | 5.6% | 7.8% | 4.5% | Yes |
| Michigan | 5.5% | 8.0% | 3.7% | Yes |
| Oregon | 5.4% | 8.0% | 2.8% | Yes |
| New Hampshire | 5.3% | 7.7% | 4.1% | Yes |
| Connecticut | 5.2% | 8.1% | 1.4% | Yes |
| New York | 4.7% | 6.7% | 2.3% | Yes |
| District of Columbia | 4.3% | 4.7% | 5.5% | Yes |
| Rhode Island | 4.2% | 6.2% | 2.1% | Yes |
| Hawaii | 4.1% | 5.9% | 3.3% | Yes |
| Vermont | 3.8% | 6.0% | 1.7% | Yes |
| Massachusetts | 2.7% | 3.9% | 1.5% | Yes |
| United States | 8.4% | 11.8% | 6.1% |
Source: US Census Bureau, Health Insurance Coverage by State: 2025, October 2026, Appendix Tables A-1 and A-2.
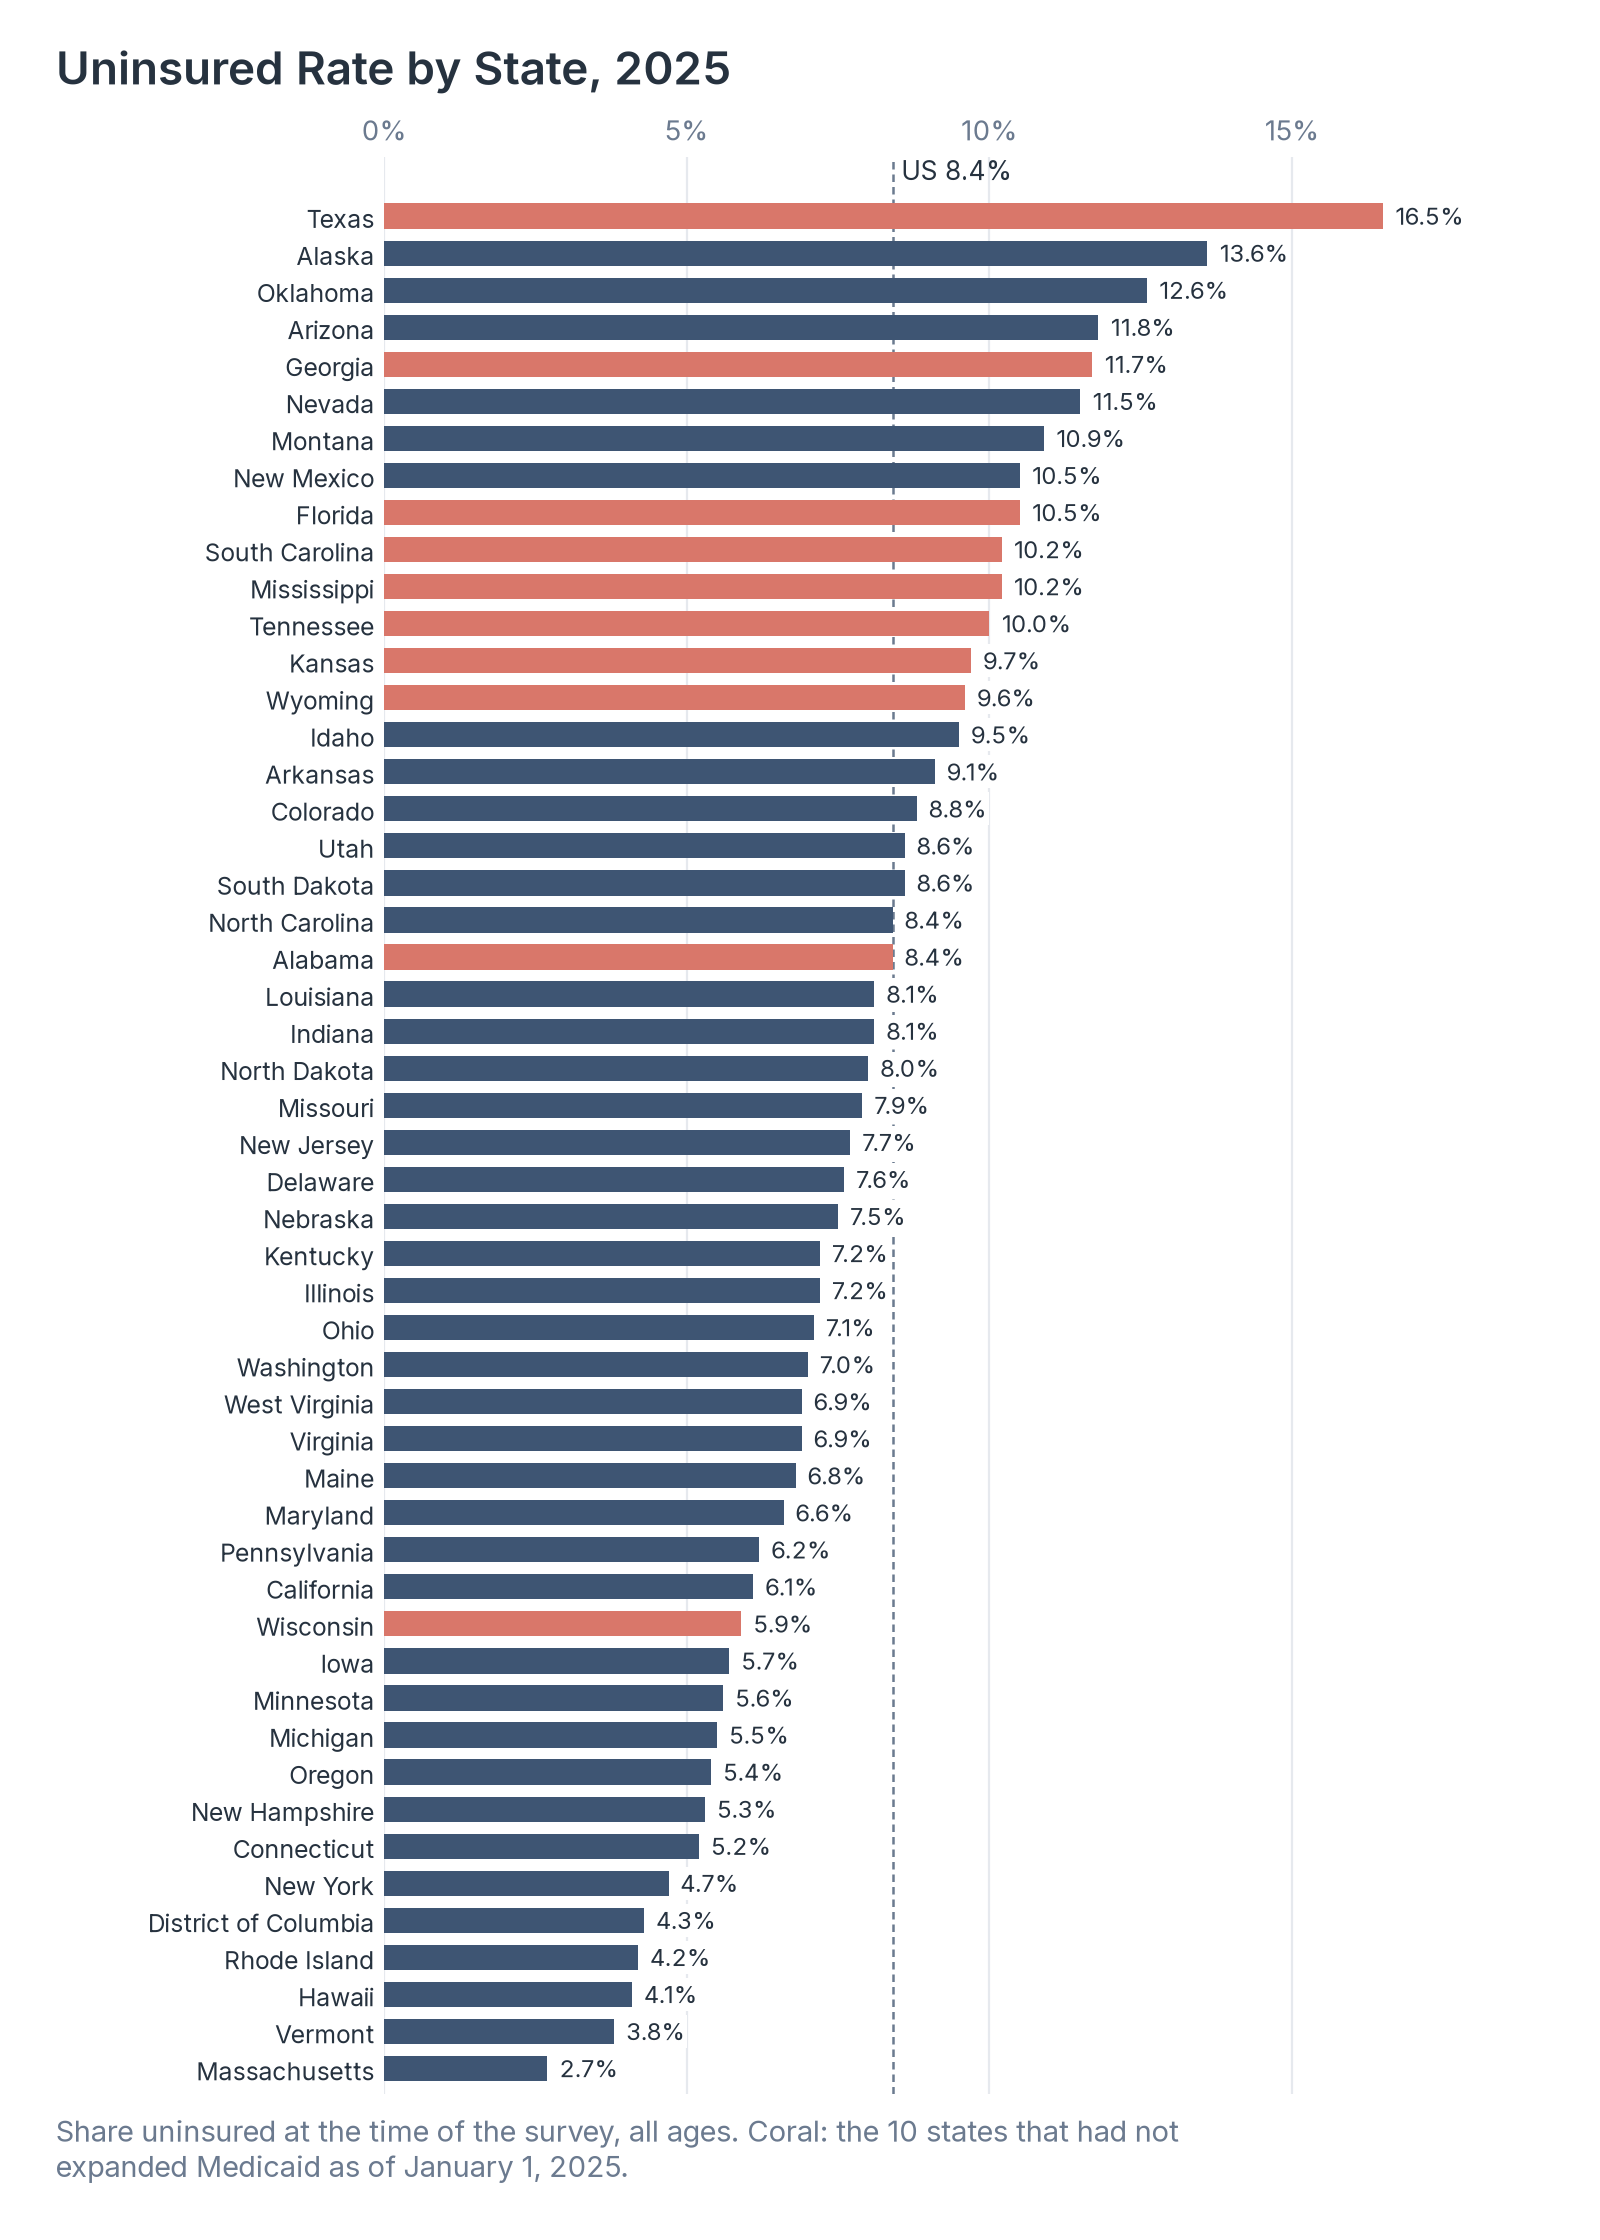
Source: Healthcare Industry Reviews analysis of Census Bureau ACS data, conducted November 2026.
Key Findings
- Texas (16.5%), Alaska (13.6%), Oklahoma (12.6%), Arizona (11.8%), and Georgia (11.7%) had the highest uninsured rates. Massachusetts (2.7%), Vermont (3.8%), Hawaii (4.1%), and Rhode Island (4.2%) had the lowest.
- The Census Bureau found 16 states with uninsured rates above the national rate and 26 states and DC below it. The average rate for Medicaid expansion states was 6.9%, compared with 12.1% for states that had not expanded.
- Texas had the highest rates for both working-age adults (21.8%) and children (13.0%). Alaska (12.7%), Montana (11.0%), Arizona (10.7%), and Oklahoma (10.5%) also had children's rates above 10%.
How Medicaid Expansion and Income Affect the Uninsured Rate
The Affordable Care Act let states extend Medicaid to adults with incomes up to 138% of the federal poverty line. As of January 1, 2025, 40 states and DC had expanded, and 10 states had not: Alabama, Florida, Georgia, Kansas, Mississippi, South Carolina, Tennessee, Texas, Wisconsin, and Wyoming.
| Group and family income | All states, 2025 | Expansion states and DC, 2025 | Nonexpansion states, 2025 | Nonexpansion states, 2024 |
|---|---|---|---|---|
| Children under 19, all incomes | 5.7% | 4.5% | 8.8% | 9.4% |
| Children under 19, below 100 percent of poverty | 9.0% | 7.1% | 12.6% | 12.6% |
| Children under 19, 100 to 399 percent of poverty | 7.3% | 5.8% | 10.7% | 11.3% |
| Children under 19, at or above 400 percent of poverty | 2.8% | 2.3% | 4.2% | 5.2% |
| Adults 19 to 64, all incomes | 11.0% | 9.0% | 16.2% | 15.6% |
| Adults 19 to 64, below 100 percent of poverty | 23.6% | 18.6% | 34.7% | 35.1% |
| Adults 19 to 64, 100 to 399 percent of poverty | 16.8% | 14.3% | 22.5% | 21.5% |
| Adults 19 to 64, at or above 400 percent of poverty | 4.3% | 3.5% | 6.5% | 6.1% |
Source: US Census Bureau, Health Insurance Coverage in the United States: 2025, September 2026. Income is family income as a percentage of the federal poverty line.
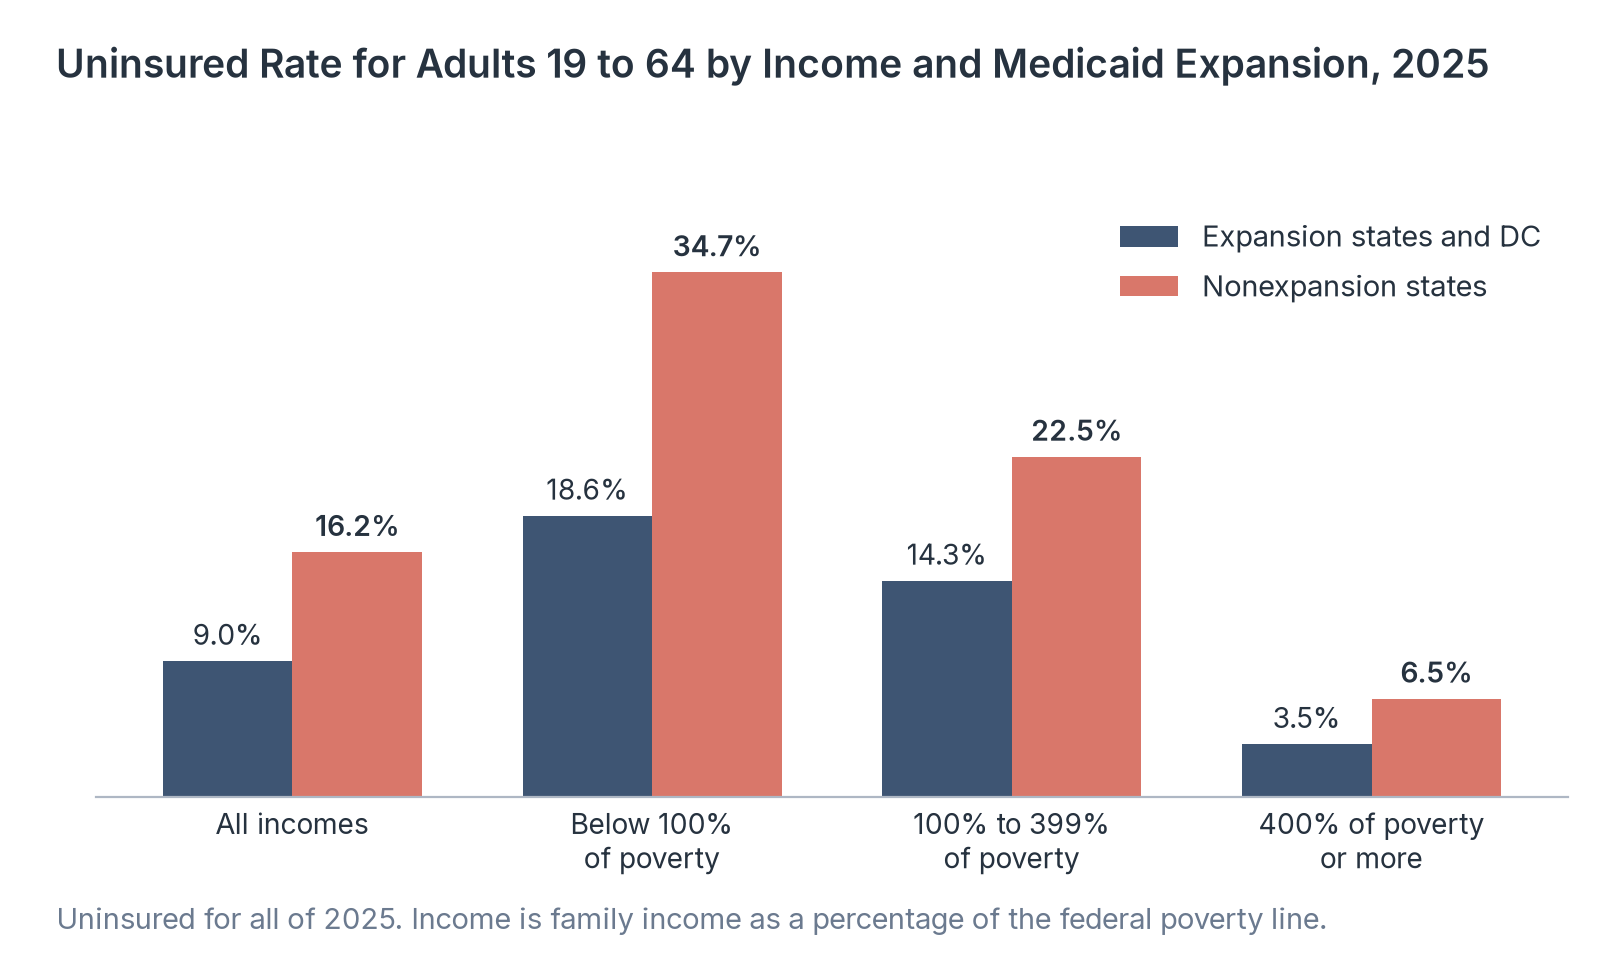
Source: Healthcare Industry Reviews analysis of Census Bureau CPS data, conducted November 2026.
Key Findings
- 34.7% of adults below the poverty line in nonexpansion states were uninsured all year in 2025, compared with 18.6% in expansion states and DC.
- The gap held at every income level. Adults with incomes from 100% to 399% of poverty had an uninsured rate of 22.5% in nonexpansion states and 14.3% in expansion states.
- Children were less affected, because Medicaid and CHIP cover children in every state. Still, 8.8% of children in nonexpansion states were uninsured, compared with 4.5% in expansion states.
Projected Changes in the Number of Uninsured People
The 2025 budget reconciliation law, Public Law 119-21, cuts federal Medicaid, CHIP, and Marketplace spending, and it adds a work reporting requirement for adults covered through Medicaid expansion. CBO has estimated how many more people will be uninsured each year as a result, compared with its January 2025 baseline.
| Year | Additional uninsured people |
|---|---|
| 2026 | 1.3 million |
| 2027 | 5.2 million |
| 2028 | 6.8 million |
| 2029 | 8.6 million |
| 2034 | 10.0 million |
Source: Georgetown University Center for Children and Families, New CBO Health Coverage Estimates of Budget Reconciliation Law, August 2025, summarizing CBO estimates issued August 11, 2025.
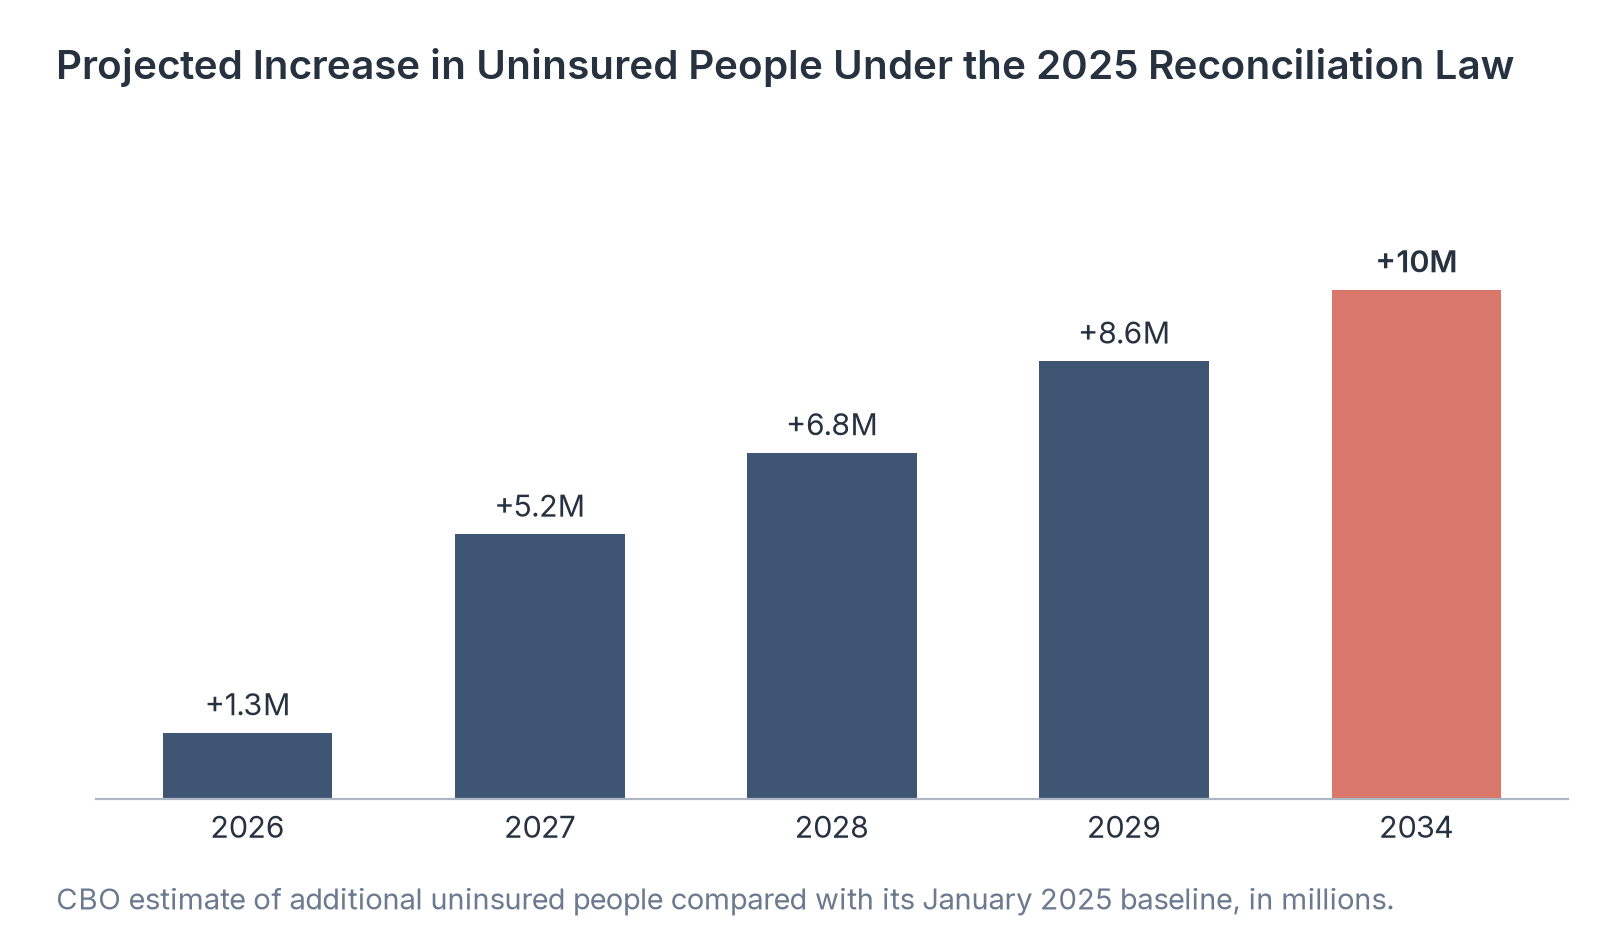
Source: Healthcare Industry Reviews analysis of CBO estimates, conducted November 2026.
Key Findings
- Medicaid and CHIP cuts account for 7.5 million of the 10 million additional uninsured people in 2034. The Medicaid work reporting requirement alone adds 5.3 million before interactions with other provisions.
- Marketplace changes add 2.4 million uninsured people in 2034, and a restriction on Medicare eligibility for some lawfully present immigrants adds 100,000.
- The estimates do not include the scheduled expiration of the enhanced Marketplace premium tax credits at the end of 2025. An earlier CBO estimate found that extending those credits would keep another 4.2 million people insured by 2034. Marketplace coverage for people under 65 had grown from 4.3% in 2021 to 6.3% (17.4 million people) in 2025.
What Uninsured Rate Statistics Show About US Coverage
The uninsured rate has held near its lowest recorded level for several years, at 7.9% for the full year in 2025. That stability covers wide differences by state, income, and citizenship. Adults in nonexpansion states, young adults, and noncitizens remain far more likely to go without coverage.
Sources of coverage are also shifting. Medicaid enrollment fell from 2024 to 2025, the enhanced premium tax credits were scheduled to end after 2025, and CBO expects the number of uninsured people to rise each year through 2034.
So if you are citing the uninsured rate, give the survey and its definition, because the full-year CPS rate (7.9%), the point-in-time ACS rate (8.4%), and the NHIS rate (8.3%) all describe 2025.
Data Collection and Methodology
National, age, race and Hispanic origin, citizenship, work, income, and Medicaid expansion figures come from the Census Bureau's Current Population Survey Annual Social and Economic Supplement (CPS ASEC), which surveyed about 88,000 addresses in 2026. The CPS counts people as uninsured if they had no coverage at any time during the calendar year.
Rates by income use the poverty universe, which leaves out unrelated people under 15, so the rate for children in the income table (5.7%) differs slightly from the overall rate for children (5.8%). Estimates for 2017 onward reflect an updated processing system, and the Census Bureau recommends caution when comparing 2019 with other years.
State figures come from the 2025 American Community Survey 1-year estimates, which count people uninsured at the time of the interview. Point-in-time national figures for 2021 to 2025 come from the NHIS early release, based on interviews with 24,808 adults and 6,051 children in 2025. December 2025 interviews were not conducted because of the October 1 to November 12, 2025, federal government shutdown.
Projections are CBO estimates published August 11, 2025, as summarized by the Georgetown University Center for Children and Families. We calculated changes in percentage points and in numbers of people from the published values.
Sources
- Healthcare Industry Reviews analysis of Census Bureau CPS ASEC and ACS data for 2013 to 2025, NCHS National Health Interview Survey estimates for 2021 to 2025, and CBO coverage projections for 2026 to 2034, conducted November 2026.
- Bunch LN, Ketema H. Health Insurance Coverage in the United States: 2025. US Census Bureau, Current Population Reports P60-291. September 2026.
- Carter C. Health Insurance Coverage by State: 2025. US Census Bureau, American Community Survey Briefs ACSBR-027. October 2026.
- Cohen RA, Briones EM. Health Insurance Coverage: Early Release of Estimates From the National Health Interview Survey, 2025. National Center for Health Statistics. May 2026.
- Park E. New CBO Health Coverage Estimates of Budget Reconciliation Law. Georgetown University Center for Children and Families. August 14, 2025.