Value-Based Care Adoption Statistics: 2026 Report
Published
Our analysts compiled national alternative payment model results for payments made from 2019 through 2024, along with physician survey data from 2014 through 2024, to show how much US health care spending has moved into value-based arrangements, which payers lead, and how far each falls from national goals, as of Q4 2026.
Key Findings
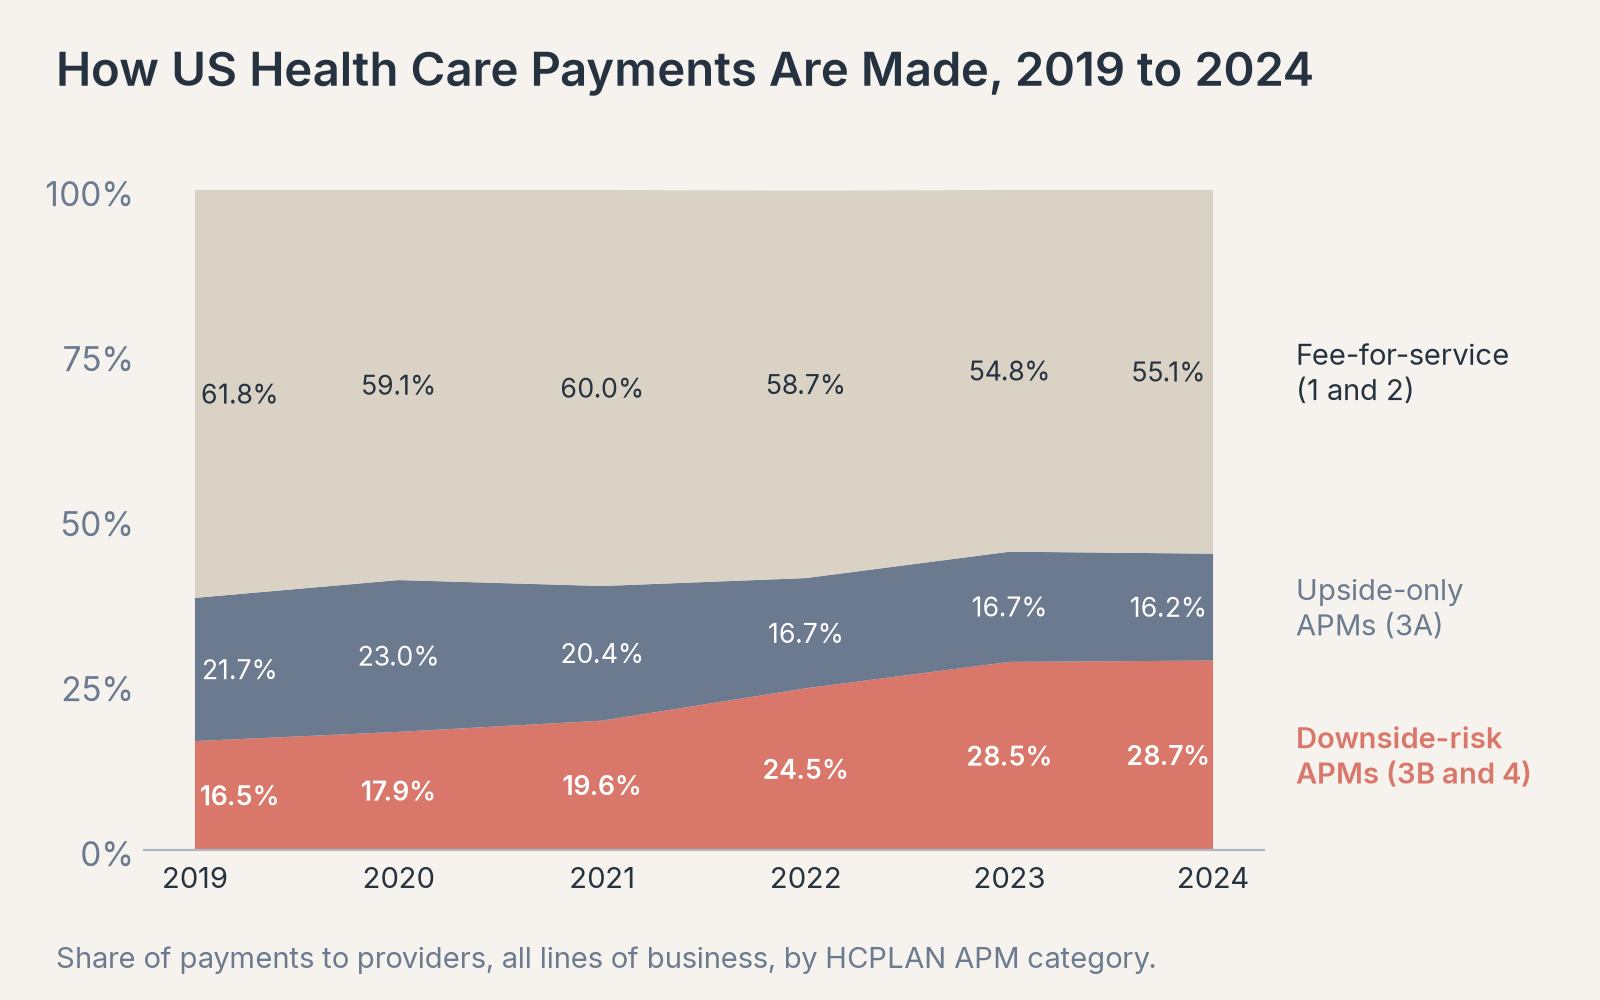
- In 2024, 44.9% of US health care payments to providers flowed through alternative payment models (APMs), compared with 45.2% in 2023 and 38.2% in 2019.
- Payments in downside-risk models, where providers can lose money if spending runs over target, reached 28.7% of all payments in 2024, up from 16.5% in 2019.
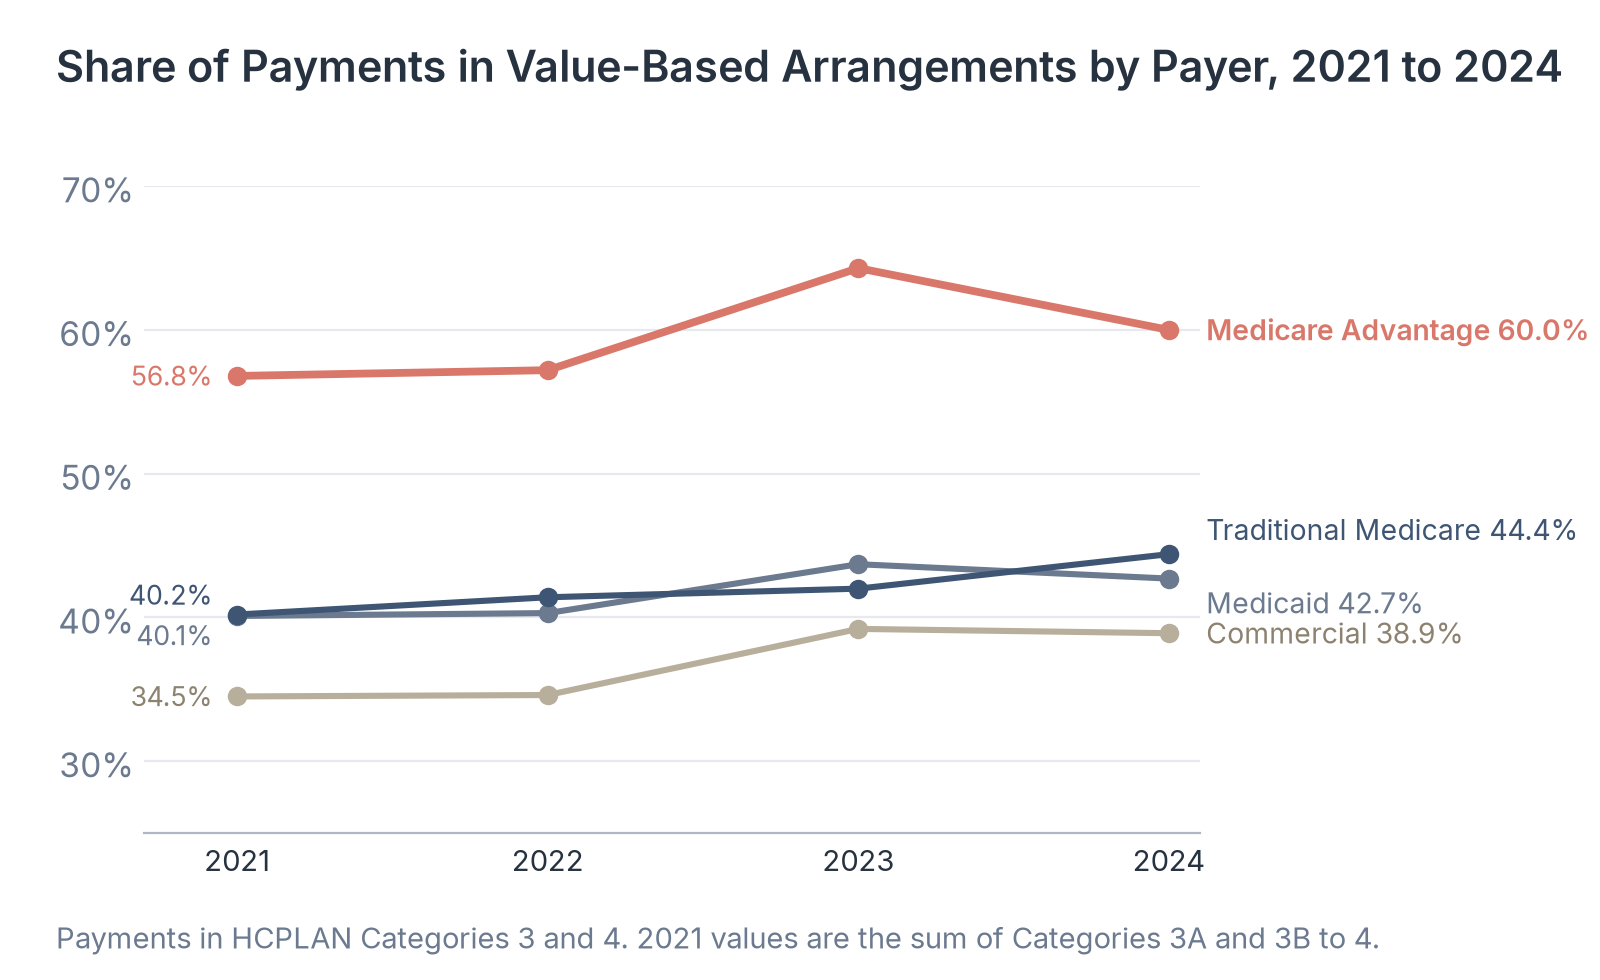
- Medicare Advantage had the highest APM share of any payer in 2024, at 60.0%, down from 64.3% in 2023. Commercial insurance had the lowest, at 38.9%, and 50.4% of commercial payments were pure fee-for-service.
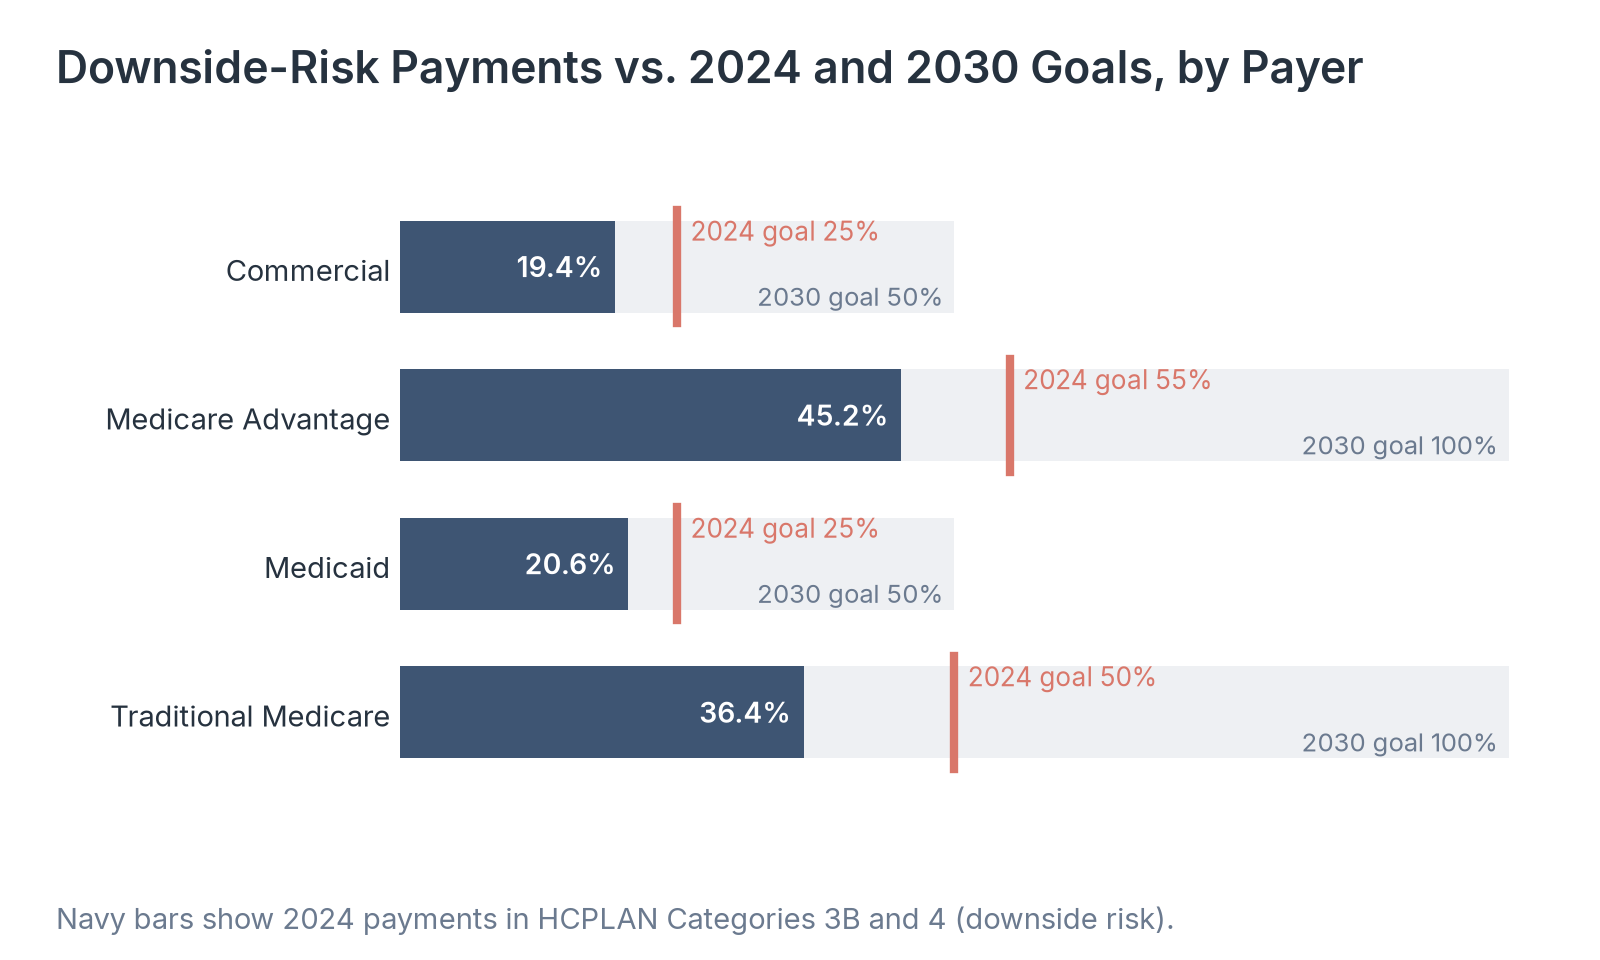
- No line of business met its 2024 interim goal for downside-risk payments. Traditional Medicare reached 36.4% against a 50% goal, Medicare Advantage 45.2% against 55%, Medicaid 20.6% against 25%, and commercial plans 19.4% against 25%.
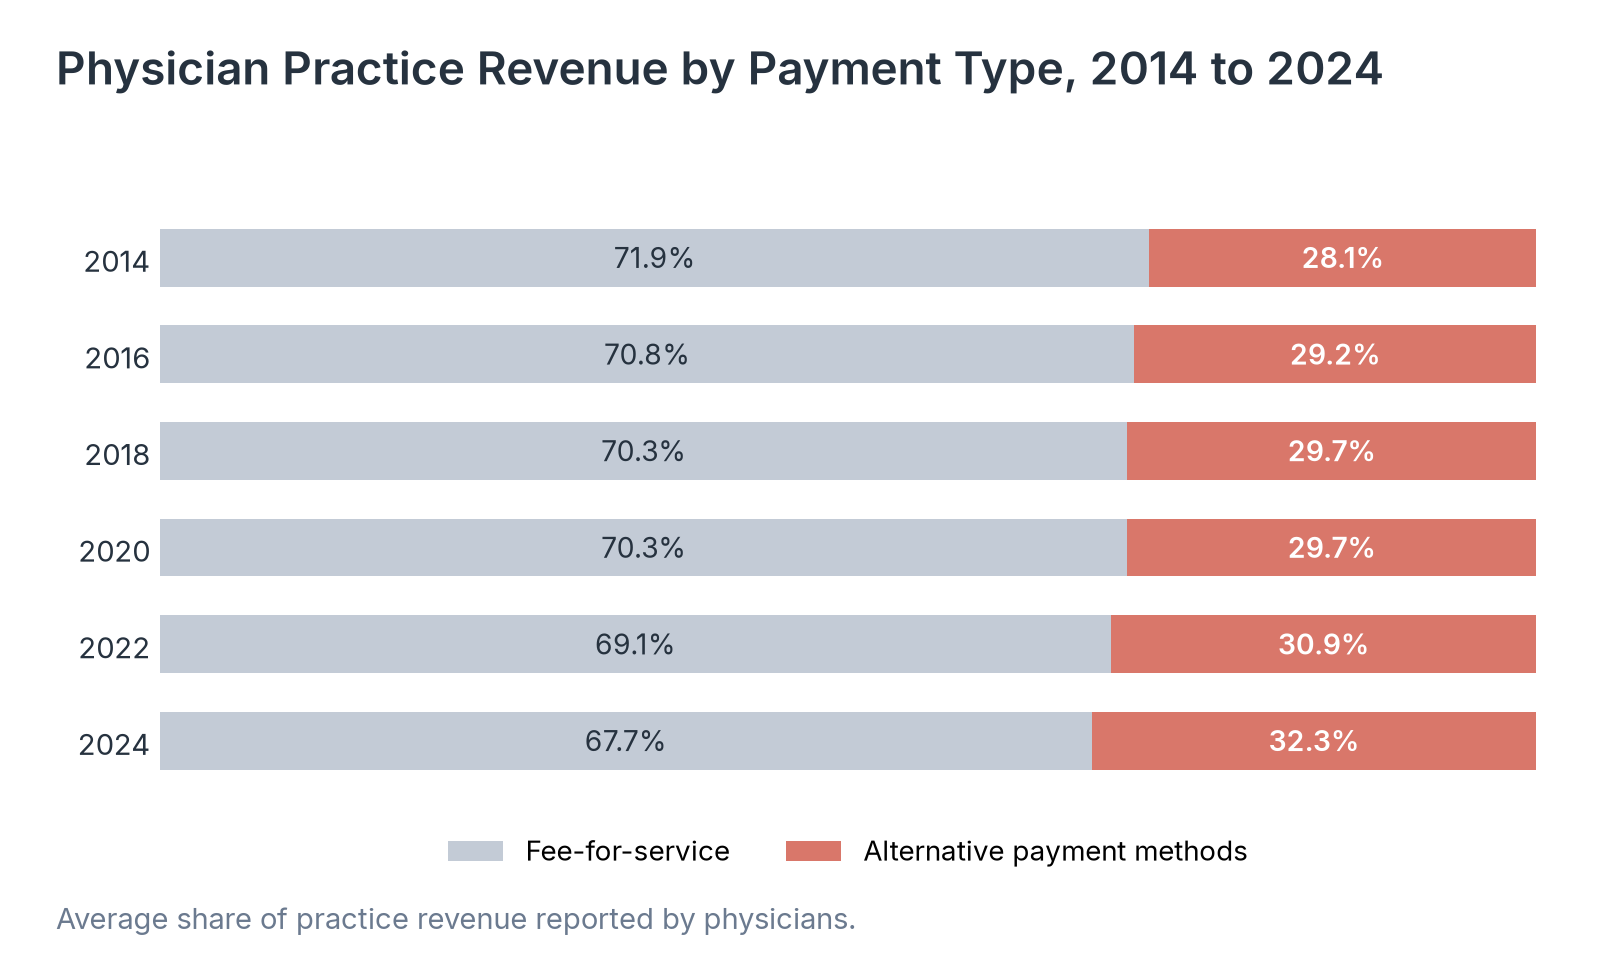
- Physicians reported that 32.3% of their practice revenue came from alternative payment methods in 2024, up from 28.1% in 2014. The other 67.7% still came from fee-for-service.
For most of its history, the US health system has paid doctors and hospitals for each visit, test, and procedure. Value-based care ties some of that money to quality and total cost instead, through arrangements such as shared savings, bundled payments for an episode of care, and capitation. Since 2016, the Health Care Payment Learning & Action Network (HCPLAN) has measured how much of the nation's payments to providers flow through these alternative payment models each year, sorting dollars into four categories that run from pure fee-for-service (Category 1) to population-based payments such as capitation (Category 4).3 The network has also set goals: by 2030, all Medicare Advantage and Traditional Medicare payments and half of commercial and Medicaid payments should flow through arrangements where providers carry downside risk.3 In 2025, AHIP took over the annual survey from HCPLAN, keeping the same framework and its partnership with the Centers for Medicare & Medicaid Services (CMS) and the Blue Cross Blue Shield Association.2 Health plans, reporters, and policymakers use the results to judge how far the shift has gone and where it has stalled.
Our analysts compiled six years of national results from the HCPLAN and AHIP measurement reports, covering payments made in 2019 through 2024 by commercial plans, Medicare Advantage plans, Medicaid programs, and Traditional Medicare. We compared each payer's results with the HCPLAN goals for 2024, 2025, and 2030, and added the American Medical Association's Physician Practice Benchmark Survey to show how value-based payment looks from inside physician practices. The 2024 survey covered 58 health plans, two fee-for-service Medicaid states, and Original Medicare, representing 271 million people, or 87.5% of the insured population.2
In the following sections, we break down value-based care adoption by payment category, line of business, progress toward national goals, physician practice revenue, and health plan expectations.
How US Health Care Payments Are Made
HCPLAN groups payments into Categories 1 and 2, which are fee-for-service with or without a link to quality, and Categories 3 and 4, which are alternative payment models. Category 3A covers shared-savings models where providers can earn a bonus but face no penalty, while Categories 3B and 4 add downside risk or a fixed population-based payment.
| Payment year | Fee-for-service (Categories 1 and 2) | Upside-only APMs (3A) | Downside-risk APMs (3B and 4) | All APMs (3 and 4) | Share of insured population surveyed |
|---|---|---|---|---|---|
| 2019 | 61.8% | 21.7% | 16.5% | 38.2% | 72.5% |
| 2020 | 59.1% | 23.0% | 17.9% | 40.9% | 80.2% |
| 2021 | 60.0% | 20.4% | 19.6% | 40.0% | 77.7% |
| 2022 | 58.7% | 16.7% | 24.5% | 41.3% | 86.7% |
| 2023 | 54.8% | 16.7% | 28.5% | 45.2% | 92.7% |
| 2024 | 55.1% | 16.2% | 28.7% | 44.9% | 87.5% |
Source: Healthcare Industry Reviews analysis of HCPLAN and AHIP APM Measurement Effort results for 2019 to 2024 and AMA Physician Practice Benchmark Survey data, conducted November 2026. 2021 and 2024 Category 3A shares are calculated as all APMs minus downside-risk APMs.
Source: Healthcare Industry Reviews analysis of HCPLAN and AHIP APM Measurement Effort results for 2019 to 2024 and AMA Physician Practice Benchmark Survey data, conducted November 2026.
Key Findings
- The APM share of payments rose from 38.2% in 2019 to 45.2% in 2023, then held nearly flat at 44.9% in 2024. Fee-for-service payments in Categories 1 and 2 still made up 55.1% of the total.
- Downside-risk payments grew in every year measured, from 16.5% in 2019 to 28.7% in 2024. Over the same years, upside-only shared savings fell from a high of 23.0% in 2020 to 16.2% in 2024.
- Pure fee-for-service with no link to quality, Category 1, was 39.7% of payments in 2024, compared with 39.3% in 2019.4 Category 2, fee-for-service tied to quality reporting or pay-for-performance, fell from 22.5% to 15.4% over the same period.
Value-Based Care Adoption by Line of Business
Each type of payer has moved at its own pace. Medicare Advantage plans are paid a fixed monthly amount per member by CMS and contract with provider groups on their own terms. Traditional Medicare relies on its own programs, such as the Medicare Shared Savings Program for accountable care organizations (ACOs), which our Medicare ACO statistics report covers in detail.
| Line of business | 2021 | 2022 | 2023 | 2024 | Change, 2021 to 2024 (points) |
|---|---|---|---|---|---|
| Commercial | 34.5% | 34.6% | 39.2% | 38.9% | +4.4 |
| Medicare Advantage | 56.8% | 57.2% | 64.3% | 60.0% | +3.2 |
| Medicaid | 40.1% | 40.3% | 43.7% | 42.7% | +2.6 |
| Traditional Medicare | 40.2% | 41.4% | 42.0% | 44.4% | +4.2 |
| All lines of business | 40.0% | 41.3% | 45.2% | 44.9% | +4.9 |
Source: Healthcare Industry Reviews analysis of HCPLAN and AHIP APM Measurement Effort results for 2019 to 2024 and AMA Physician Practice Benchmark Survey data, conducted November 2026. 2021 values are the sum of Categories 3A and 3B to 4 as reported.
Source: Healthcare Industry Reviews analysis of HCPLAN and AHIP APM Measurement Effort results for 2019 to 2024 and AMA Physician Practice Benchmark Survey data, conducted November 2026.
Key Findings
- Medicare Advantage led every year, rising from 56.8% of payments in APMs in 2021 to 64.3% in 2023 before falling to 60.0% in 2024. Its downside-risk share still grew in 2024, from 43.0% to 45.2%.
- Traditional Medicare was the only line of business whose APM share rose in every year measured, from 40.2% in 2021 to 44.4% in 2024, which moved it ahead of Medicaid at 42.7%.
- Commercial plans had the lowest APM share each year, 38.9% in 2024. Half of commercial payments, 50.4%, were pure fee-for-service with no link to quality.4
Progress Toward Downside-Risk Goals
HCPLAN's goals focus on downside risk, Categories 3B and 4, where providers share in losses as well as savings. Interim goals for 2024 and 2025 were set as checkpoints toward the 2030 targets.3 The table compares each payer's downside-risk share with those goals.
| Line of business | 2022 | 2023 | 2024 | 2024 goal | 2025 goal | 2030 goal |
|---|---|---|---|---|---|---|
| Commercial | 16.5% | 21.6% | 19.4% | 25% | 30% | 50% |
| Medicare Advantage | 38.9% | 43.0% | 45.2% | 55% | 65% | 100% |
| Medicaid | 18.7% | 21.1% | 20.6% | 25% | 30% | 50% |
| Traditional Medicare | 30.2% | 33.7% | 36.4% | 50% | 60% | 100% |
Source: Healthcare Industry Reviews analysis of HCPLAN and AHIP APM Measurement Effort results for 2019 to 2024 and AMA Physician Practice Benchmark Survey data, conducted November 2026.
Source: Healthcare Industry Reviews analysis of HCPLAN and AHIP APM Measurement Effort results for 2019 to 2024 and AMA Physician Practice Benchmark Survey data, conducted November 2026.
Key Findings
- Every line of business fell short of its 2024 interim goal. Traditional Medicare had the largest gap, 13.6 points, and Medicaid had the smallest, 4.4 points.
- Medicare Advantage and Traditional Medicare added the most downside-risk share from 2022 to 2024, 6.3 and 6.2 points. Traditional Medicare would need to add 23.6 more points in one year to reach its 2025 goal of 60%.
- Commercial downside-risk payments fell from 21.6% in 2023 to 19.4% in 2024, and Medicaid slipped from 21.1% to 20.6%. Both remain less than halfway to their 2030 goal of 50%.
Value-Based Payment in Physician Practices
Payer surveys count dollars. The American Medical Association asks physicians directly, through its Physician Practice Benchmark Survey, how their practices are paid and which ACOs they belong to.5 Its averages are weighted by physician, so they show the typical doctor's experience.
| Survey year | Revenue from fee-for-service | Revenue from alternative payment methods | Physicians in a Medicare ACO | Physicians in a commercial ACO | Physicians in a Medicaid ACO |
|---|---|---|---|---|---|
| 2014 | 71.9% | 28.1% | 28.6% | Not asked | Not asked |
| 2016 | 70.8% | 29.2% | 31.8% | 31.7% | 20.9% |
| 2018 | 70.3% | 29.7% | 38.2% | 39.0% | 26.3% |
| 2020 | 70.3% | 29.7% | 36.7% | 42.7% | 29.5% |
| 2022 | 69.1% | 30.9% | 38.1% | 45.1% | 30.0% |
| 2024 | 67.7% | 32.3% | 37.6% | 40.8% | 28.6% |
Source: Healthcare Industry Reviews analysis of HCPLAN and AHIP APM Measurement Effort results for 2019 to 2024 and AMA Physician Practice Benchmark Survey data, conducted November 2026. Revenue shares are averages reported by physicians.
Source: Healthcare Industry Reviews analysis of HCPLAN and AHIP APM Measurement Effort results for 2019 to 2024 and AMA Physician Practice Benchmark Survey data, conducted November 2026.
Key Findings
- The share of practice revenue from alternative payment methods rose 4.2 points over ten years, from 28.1% in 2014 to 32.3% in 2024. The largest two-year gain, 1.4 points, came between 2022 and 2024.
- In 2024, 82.8% of physicians were in practices that received some fee-for-service revenue, and 62.4% were in practices that received at least some payment through an alternative method. Bundled payments (38.5%) and pay-for-performance (37.6%) were the most common methods, followed by capitation (20.3%) and shared savings (17.7%).5
- In 2024, 53.5% of physicians said their practice was in at least one ACO, down from 57.8% in 2022.5 Commercial ACO participation fell from 45.1% to 40.8% and Medicare ACO participation from 38.1% to 37.6%.
What Health Plans Expect From Value-Based Care
The AHIP and Blue Cross Blue Shield Association surveys also ask health plans where they expect APMs to go and what they expect APMs to do.2 The 2025 survey asked about the next 24 months.
| APM adoption will bring | Agree | Disagree |
|---|---|---|
| Better quality of care | 95% | 2% |
| Improved care coordination | 93% | 2% |
| More affordable care | 85% | 3% |
| More consolidation among providers | 28% | 47% |
| Higher unit prices for discrete services | 14% | 47% |
Source: Healthcare Industry Reviews analysis of HCPLAN and AHIP APM Measurement Effort results for 2019 to 2024 and AMA Physician Practice Benchmark Survey data, conducted November 2026. Remaining responses were not sure or blank.
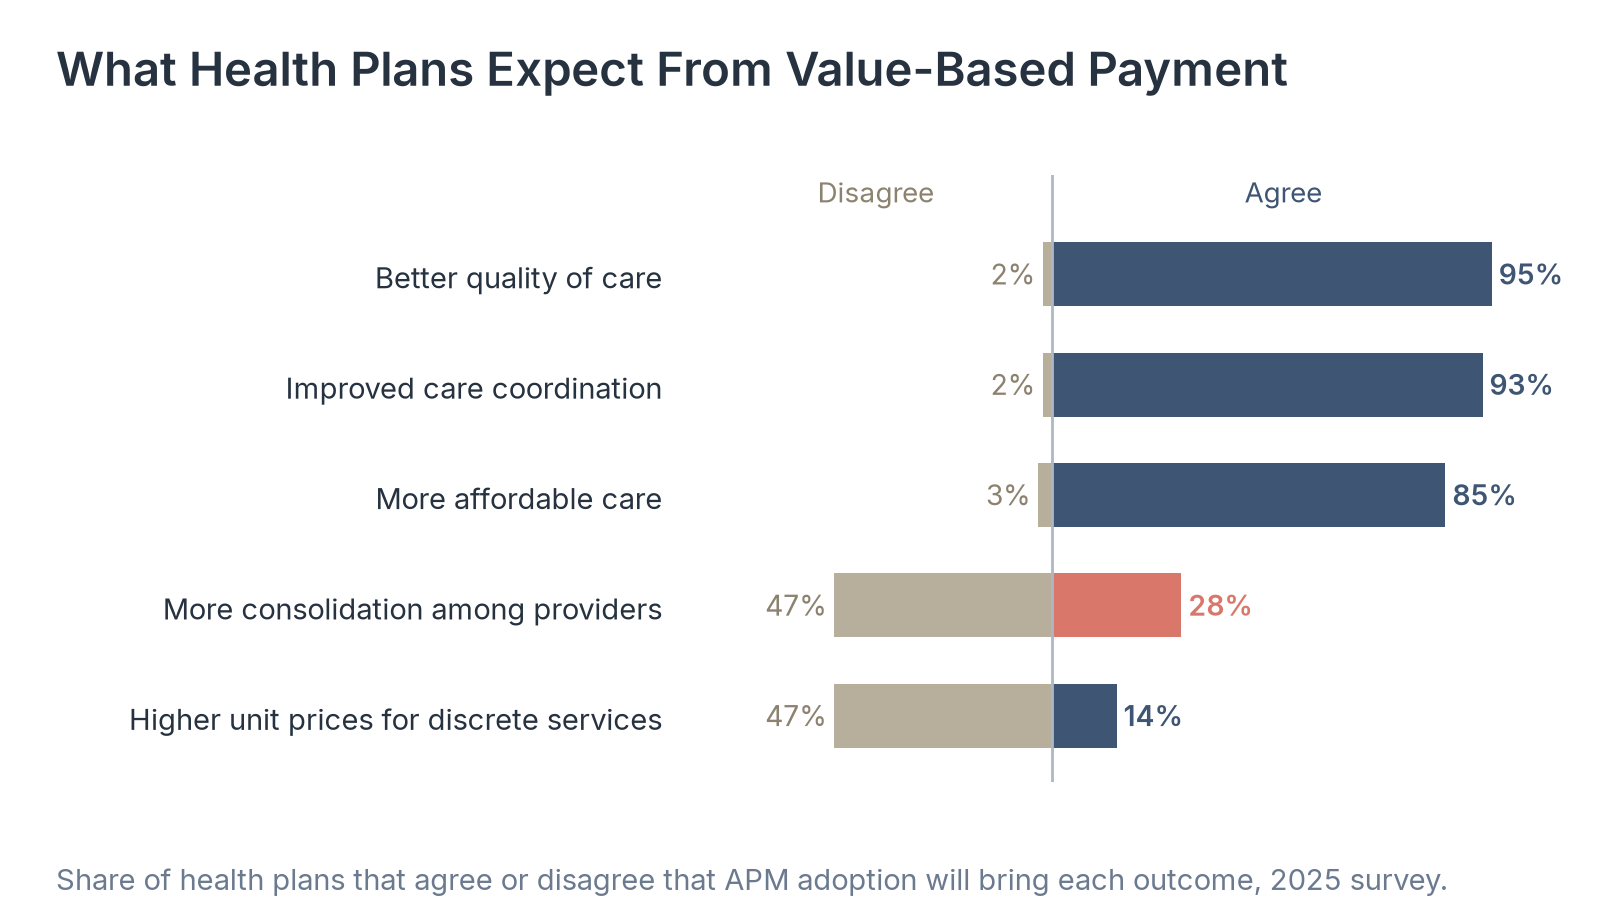
Source: Healthcare Industry Reviews analysis of HCPLAN and AHIP APM Measurement Effort results for 2019 to 2024 and AMA Physician Practice Benchmark Survey data, conducted November 2026.
Key Findings
- Most responding health plans, 70%, expect APM activity to increase over the next 24 months, 20% expect it to stay the same, and 3% expect it to decrease. More than half, 55%, said Category 3B, shared risk and procedure-based bundled payments, will grow the most.2
- Nearly all plans, 95%, agree APMs will bring better quality of care, 93% improved care coordination, and 85% more affordable care. Fewer than 4% disagree with any of the three.
- Plans are split on side effects. On consolidation among providers, 28% agree APMs will bring more and 47% disagree. On unit prices for discrete services, 14% expect them to rise and 47% do not.
What Slow Value-Based Care Growth Means for Patients and Providers
Fee-for-service still decides how most health care dollars move in the United States, nearly a decade after the first national measurement. The shift that has happened is a change of kind more than of scale: fewer upside-only contracts and more arrangements in which providers can lose money, led by Medicare Advantage and Traditional Medicare.
For patients, that means the doctor or hospital they see is more likely than in 2019 to be paid in part on total cost and quality, but most of their bills are still built on individual services. Commercial insurance has moved the least, and its downside-risk share fell in 2024.
So if you are reporting on value-based care, the payer and the payment category tell you more than any single national figure, because Medicare Advantage and commercial plans are more than 20 points apart.
Data Collection and Methodology
We compiled national results from five annual APM Measurement Effort reports and their infographics: the HCPLAN 2020 to 2021, 2022, 2023, and 2024 reports, and the 2025 report published by AHIP on February 2, 2026. Each report covers payments made in the prior calendar year, so the 2025 report describes 2024 payments. Health plans, states, and Original Medicare report the dollars they paid to providers in each HCPLAN category, and the reports combine those dollars into national shares for each line of business. The share of the insured population covered by respondents varied from 72.5% (2019 payments) to 92.7% (2023 payments), so year-to-year changes partly reflect who responded.
Category 3A shares for 2021 and 2024 payments are calculated as the reported Categories 3 and 4 total minus the reported 3B and 4 total. 2021 line-of-business totals for Categories 3 and 4 are the sum of the reported 3A and 3B to 4 shares. The 2024 Category 1 and 2 split and the commercial fee-for-service share come from coverage of the AHIP survey results.4 Goals come from Figure 2 of the HCPLAN 2024 report. Physician data come from the AMA Physician Practice Benchmark Surveys for 2014 through 2024, as reported by the AMA. We calculated differences and point changes from the published values.
Sources
- Healthcare Industry Reviews analysis of HCPLAN and AHIP APM Measurement Effort results for 2019 to 2024 payments and AMA Physician Practice Benchmark Survey data for 2014 to 2024, conducted November 2026.
- AHIP. 2025 APM Measurement Methodology and Results Report. February 2, 2026.
- Health Care Payment Learning & Action Network. APM Measurement Effort, 2024 Methodology and Results Report, with the 2024 APM infographic, and the earlier 2023, 2022, and 2020 to 2021 reports and infographics.
- TechTarget. Nearly 45% of healthcare payments tied to APMs: Survey. February 4, 2026.
- Hardiman A. Alternative Payment and Delivery Models: A Decade in Review Shows Stagnant Growth Between 2014 and 2024. American Medical Association Policy Research Perspectives. 2025.